REVIEW 4 major objections 5 minor 21 references
Coverage Biases in High-Resolution Satellite Imagery
T0 review · 4 major / 5 minor · reviewed 2026-08-16 · deepseek-v4-flash
Pith's one-line read The paper argues that very high-resolution satellite imagery is distributed unequally: orbital geometry favors high latitudes, and historic archives skew toward developed, densely populated subnational regions, with a Gini coefficient of…
desk verdict Solid empirical measurement of geographic and socio-economic bias in commercial VHR satellite imagery, but the causal story outruns the evidence without a Landsat/Sentinel control. read the letter →
The pith
A machine-rendered reading of the paper's core claim, the machinery that carries it, and where it could break.
The reading
What carries the argument
The argument is carried by two matched measurement tools. Forward-looking, the paper propagates public two-line element orbital data at one-minute intervals using the Skyfield library, buffers each predicted orbital path by 250 kilometers, and counts how often each grid tile or subnational centroid falls inside that buffer over 30 days, yielding a theoretical revisit ceiling. Backward-looking, it harvests metadata from Spatiotemporal Asset Catalogs of major providers, assigns each historic image to a subnational region by centroid, and regresses normalized image counts on absolute latitude, longitude, area size, household count, cloud coverage, and the Subnational Human Development Index. The Gini coefficient computed from the Lorenz curve of images per square kilometer ordered by development quantifies the resulting inequality.
What would settle it
Recompute the 30-day revisit map from two-line element data at several dates between 2017 and 2023 and compare the resulting revisit-to-image ratios in each continent and resolution bin. If the ratios change substantially across epochs, the paper's comparison of potential versus actual availability depends on the chosen orbital snapshot rather than on stable physical and economic factors.
Extended reading notes
Core claim
If the paper's argument holds, the availability of very high resolution optical satellite imagery is jointly determined by physics and business. The orbital paths of sun-synchronous constellations make high-latitude locations revisitable more often, with revisit rates fairly flat between -50 and 50 degrees latitude but rising sharply toward the poles. Historic archives from major providers for 2017-2023 show that more populated and more developed subnational regions have more available images per unit area, and the distribution of images per square kilometer sorted by development has a Gini coefficient of about 0.64. Conflict case studies in Gaza, Sudan, and Ukraine show that geopolitical events produce sharp spikes in imagery that track front lines. The paper concludes that less developed, more rural places have slightly fewer opportunities to reap the digital dividend of remote sensing.
Load-bearing premise
The forward-looking revisit ceiling is computed from orbital data for a single day in 2024, but it is compared with image archives spanning 2017 to 2023, so the comparison assumes that one orbital snapshot represents the constellations across all those years.
Editorial extensions
If this is right
- If the revisit ceiling rises with absolute latitude, analyses that exploit revisit frequency will systematically have more observations to work with in high-latitude regions than near the equator.
- If historic archives skew toward populated and developed regions, any model trained on very high resolution imagery inherits a geography of richer, denser places and will likely transfer poorly to rural or low-income regions.
- Because conflict produces spikes in imagery, event-driven analyses of recent wars can rely on better data than tranquil periods or regions, making before-after comparisons uneven.
- The low explanatory power of the Subnational Human Development Index in the regression implies that development level matters for which regions are covered, but area size dominates how many images exist.
Reading between the lines
- One testable extension is to recompute the forward-looking revisit ceiling from orbital elements at multiple epochs within 2017-2023; if the ceiling shifts materially, the revisit-to-image ratios in Table 2 are period-dependent rather than structural.
- A second extension is to run the same regression on mid-resolution government programs such as Landsat or Sentinel; the paper's reasoning predicts their 'gotta catch them all' capture strategy should weaken or remove the socio-economic gradient, which would isolate the business-model mechanism.
- If the bias is real, downstream users could publish coverage-adjusted confidence intervals for any statistic derived from high-resolution archives, weighting regions by their revisit ceiling and archive count.
Signed reviews
Editorial analysis
A structured set of objections, weighed in public.
Referee Report
Summary. The paper studies whether the availability of very high resolution (VHR) optical satellite imagery is geographically and socio-economically biased. Forward-looking, it propagates TLE data for one 30-day window (starting 29 January 2024) to compute revisit opportunities from several commercial constellations, finding higher revisit rates at higher absolute latitudes. Backward-looking, it collects STAC metadata from Up42, Maxar, and Planet for 2017–2023, assigns images to 1726 subnational regions, and regresses image counts on area, number of households, the Subnational Human Development Index (SHDI), centroid latitude and longitude, and cloud cover. The main regression reports positive and significant associations of image counts with household counts and SHDI after area controls, and the paper reports a Gini coefficient of 0.64 for images per km² across regions ordered by SHDI. Three conflict case studies (Gaza, Sudan, Ukraine) show increased image availability after conflict onset. The paper concludes that coverage differences are mainly due to business considerations rather than physical orbital factors.
Significance. The forward-looking latitude gradient is a credible consequence of polar-orbit geometry, and the backward-looking analysis is a useful empirical contribution: it assembles multi-provider archive metadata, includes area-size controls, and provides extensive robustness tables in the appendix. If the socio-economic associations hold, the paper demonstrates a measurable 'digital divide' in VHR imagery that matters for downstream global analyses. The paper is also honest about several limitations, including omitted-variable bias and the exclusion of government-led programs. However, the strongest interpretive claim—that disparities are 'mainly due to business considerations'—is not backed by a control comparison with government-led systems, and the country-fixed-effects results weaken the HDI finding. The manuscript is therefore promising but needs substantive revision before the central conclusions can be considered fully supported.
major comments (4)
- [Methodology (Orbital path estimation); Results, Table 2] The forward-looking revisit counts are generated from TLEs propagated for a single 30-day window starting on 29 January 2024, while the backward-looking archive counts cover 2017–2023. Because the constellations changed over that period (e.g., WorldView-4 was retired, SkySat has different blocks, and Planet Dove generations evolved), the 'potential' revisit counts used as the denominator in Table 2 are not the correct upper bound for the historical actual counts. This temporal mismatch affects the headline revisit-to-image ratios in Table 2. Please either propagate TLEs for each year in the study window, restrict the comparison to a period in which the fleet composition is stable, or clearly quantify and discuss the resulting uncertainty.
- [Introduction; Discussion; Conclusion] The paper's central explanation—that the observed biases are 'mainly due to business considerations'—rests on an untested assumption. The Introduction states that because Landsat and Sentinel are government-led and follow a 'gotta catch them all' capture model, 'we expect that the backward-looking coverage should not be influenced by socio-economic factors.' This premise is never checked. Without a negative control using, for example, Sentinel-2 browse counts or Landsat metadata for the same subnational units, the socio-economic gradient in Tables 3 and 12 could reflect a general property of all optical satellite archives (e.g., cloud cover, population distribution, or national research capacity) rather than a tasking-driven business model. Please add such a control or explicitly restrict the interpretation to the commercial providers studied.
- [Appendix, Table 10, models 3–4] In the country-fixed-effects specification, the Subnational HDI coefficient drops to 0.011 and is not statistically significant at conventional levels (no significance star in model 4), and it is only borderline significant in model 3. This means the HDI effect in the main Table 3 specification is driven mainly by between-country variation, not by within-country differences. The text says the effect is 'robust across three of four model specifications' but does not report or discuss this loss of significance in the fixed-effects table. This should be acknowledged explicitly, and the socio-economic claim should be tempered accordingly.
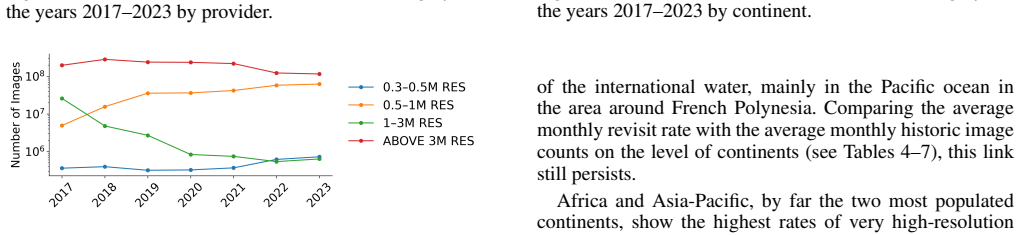
- [Results (Backward-looking); Appendix, Tables 8 and 9] The main regression excludes Planet Dove imagery on the grounds that its capture strategy is structurally different, but Tables 8 and 9 show that the socio-economic pattern is provider-dependent: in the all-images specification (Table 9, model 3), the number of households is exactly zero (0.000) and SHDI is insignificant (0.001), while in the Planet-only specification (Table 8, model 4) SHDI is negative and significant. These results are compatible with the paper's business-model story, but the paper does not provide a formal test of provider heterogeneity. Please add an explicit interaction or provider-group comparison, or limit the socio-economic conclusion to the Maxar/21AT/Airbus/ImageSat imagery on which the claim is actually identified.
minor comments (5)
- [Results; Discussion] There are unresolved placeholder cross-references: 'as described in Section .' and 'discussed in Section .' should be replaced with the actual section numbers.
- [Introduction; Data] The Introduction names Capella Space among the studied constellations, but the Data section does not describe Capella or explain which data source covers it; the list of providers should be consistent.
- [Table 3 and robustness tables] The significance note uses one star for p < 0.1, so the text 'positive and significant' should state the threshold used, especially where coefficients are significant only at the 10% level.
- [Figure 7] The map of historic image centroids would benefit from an explicit color scale or legend, as the current figure makes it hard to compare counts across continents.
- [Results (Backward-looking)] The paper reports normalized regression coefficients but does not state effect sizes in interpretable units; for example, Table 3, model 4 has an SHDI coefficient of 0.007, which would be more informative if translated into an expected change in image counts per standard deviation or per IQR of SHDI.
Circularity Check
No significant circularity: the central claims rest on independent satellite metadata, orbital simulations, and external socio-economic datasets.
full rationale
The forward-looking analysis propagates public TLE orbital data with the Skyfield library to count revisits per grid cell; no parameter of that simulation is fitted to the historic image counts. The backward-looking analysis counts historic images from STAC metadata of Maxar, Up42, and Planet, then regresses those counts on external covariates (SHDI from Global Data Lab, households from GLOPOP-S, area, cloud cover from Open-Meteo). The Gini coefficient is a descriptive inequality measure over the observed distribution, not a fitted quantity. No equation in the paper defines any predicted quantity in terms of a fitted parameter, and no core result is imported from the authors' prior work: Koebe et al. (2022) and Rufener et al. (2024) appear only as illustrative applications of satellite imagery and are not load-bearing premises. The skeptical concern about the missing Landsat/Sentinel negative control is a legitimate design limitation regarding causal or external interpretation of the socio-economic association, but it is not a circularity because the paper does not derive its main estimates from the assumption that government programmes are unbiased; it states that expectation verbally and leaves it untested. Similarly, the sensitivity of the SHDI coefficient to country fixed effects in Table 10 is an internal robustness result, not a reduction of the conclusion to its inputs. The paper is therefore self-contained with respect to its empirical derivation chains, and no circular step can be exhibited.
Assumptions & free parameters
free parameters (4)
- Orbital path buffer width =
250 km
- Grid cell edge length =
approximately 500 km
- Path propagation interval =
1 minute
- Revisit window =
30 days
assumptions (5)
- domain assumption TLE propagation via Skyfield accurately predicts satellite ground tracks over the simulated 30-day window.
- domain assumption One SkySat satellite's revisit-latitude pattern represents all studied constellations because most use sun-synchronous orbits.
- domain assumption STAC catalogs from Up42, Maxar, and Planet provide a complete or unbiased record of high-resolution images captured from 2017 to 2023.
- domain assumption Assigning each image to a subnational region by its centroid is a valid proxy for actual spatial coverage.
- domain assumption 2023 cloud cover measured at region centroids represents cloud conditions over 2017 to 2023.
Cite this review
Pith. "Pith review of Coverage Biases in High-Resolution Satellite Imagery." pith.science (2026). https://pith.science/paper/273FCABS
@misc{pith2026250503842,
  author       = {Pith},
  title        = {Pith review of: Coverage Biases in High-Resolution Satellite Imagery},
  year         = {2026},
  howpublished = {\url{https://pith.science/paper/273FCABS}},
  note         = {Machine review of arXiv:2505.03842}
}
read the original abstract
Satellite imagery is increasingly used to complement traditional data collection approaches such as surveys and censuses across scientific disciplines. However, we ask: Do all places on earth benefit equally from this new wealth of information? In this study, we investigate coverage bias of major satellite constellations that provide optical satellite imagery with a ground sampling distance below 10 meters, evaluating both the future on-demand tasking opportunities as well as the availability of historic images across the globe. Specifically, forward-looking, we estimate how often different places are revisited during a window of 30 days based on the satellites' orbital paths, thus investigating potential coverage biases caused by physical factors. We find that locations farther away from the equator are generally revisited more frequently by the constellations under study. Backward-looking, we show that historic satellite image availability -- based on metadata collected from major satellite imagery providers -- is influenced by socio-economic factors on the ground: less developed, less populated places have less satellite images available. Furthermore, in three small case studies on recent conflict regions in this world, namely Gaza, Sudan and Ukraine, we show that also geopolitical events play an important role in satellite image availability, hinting at underlying business model decisions. These insights lay bare that the digital dividend yielded by satellite imagery is not equally distributed across our planet.
Figures


Figures from the paper (9 more)



Reference graph
Works this paper leans on
-
[1]
, " * write output.state after.block = add.period write newline
ENTRY address archivePrefix author booktitle chapter edition editor eid eprint howpublished institution isbn journal key month note number organization pages publisher school series title type volume year label extra.label sort.label short.list INTEGERS output.state before.all mid.sentence after.sentence after.block FUNCTION init.state.consts #0 'before.a...
-
[2]
write newline
" write newline "" before.all 'output.state := FUNCTION n.dashify 't := "" t empty not t #1 #1 substring "-" = t #1 #2 substring "--" = not "--" * t #2 global.max substring 't := t #1 #1 substring "-" = "-" * t #2 global.max substring 't := while if t #1 #1 substring * t #2 global.max substring 't := if while FUNCTION word.in bbl.in capitalize " " * FUNCT...
-
[3]
Demir, I.; Koperski, K.; Lindenbaum, D.; Pang, G.; Huang, J.; Basu, S.; Hughes, F.; Tuia, D.; and Raskar, R. 2018. Deepglobe 2018: A challenge to parse the earth through satellite images. In Proceedings of the IEEE conference on computer vision and pattern recognition workshops, 172--181
work page 2018
-
[4]
Koebe, T.; Arias-Salazar, A.; Rojas-Perilla, N.; and Schmid, T. 2022. Intercensal updating using structure-preserving methods and satellite imagery. Journal of the Royal Statistical Society Series A: Statistics in Society, 185(Supplement\_2): S170--S196
work page 2022
-
[5]
Kumar, L.; and Mutanga, O. 2018. Google Earth Engine applications since inception: Usage, trends, and potential. Remote sensing, 10(10): 1509
work page 2018
-
[6]
C.; Sturn, T.; Schepaschenko, D.; Karner, M.; Moorthy, I.; McCallum, I.; and Fritz, S
Lesiv, M.; See, L.; Laso Bayas, J. C.; Sturn, T.; Schepaschenko, D.; Karner, M.; Moorthy, I.; McCallum, I.; and Fritz, S. 2018. Characterizing the spatial and temporal availability of very high resolution satellite imagery in google earth and microsoft bing maps as a source of reference data. Land, 7(4): 118
work page 2018
-
[7]
Li, J.; and Roy, D. P. 2017. A global analysis of Sentinel-2A, Sentinel-2B and Landsat-8 data revisit intervals and implications for terrestrial monitoring. Remote Sensing, 9(9): 902
work page 2017
-
[8]
Olbrich, P. 2018. Open space: The global effort for open access to environmental satellite data
work page 2018
Show all 21 references
-
[9]
Onoda, M.; and Young, O. R. 2017. Satellite earth observations and their impact on society and policy. Springer Nature
2017
-
[10]
Pokhriyal, N.; and Jacques, D. C. 2017. Combining disparate data sources for improved poverty prediction and mapping. Proceedings of the National Academy of Sciences, 114(46): E9783--E9792
2017
-
[11]
Rhodes , B. 2019. Skyfield: High precision research-grade positions for planets and Earth satellites generator . Astrophysics Source Code Library, record ascl:1907.024
2019
-
[12]
Rufener, M.-C.; Ofli, F.; Fatehkia, M.; and Weber, I. 2024. Estimation of internal displacement in Ukraine from satellite-based car detections. Scientific Reports, 14(1): 31638
2024
-
[13]
Shankar, S.; Halpern, Y.; Breck, E.; Atwood, J.; Wilson, J.; and Sculley, D. 2017. No classification without representation: Assessing geodiversity issues in open data sets for the developing world. arXiv preprint arXiv:1711.08536
2017 arXiv
-
[14]
Smits, J.; and Permanyer, I. 2019. The subnational human development database. Scientific data, 6(1): 1--15
2019
-
[15]
Sudmanns, M.; Tiede, D.; Augustin, H.; and Lang, S. 2020. Assessing global Sentinel-2 coverage dynamics and data availability for operational Earth observation (EO) applications using the EO-Compass. International journal of digital earth, 13(7): 768--784
2020
-
[16]
J.; Ingels, M
Ton, M. J.; Ingels, M. W.; de Bruijn, J. A.; de Moel, H.; Reimann, L.; Botzen, W. J.; and Aerts, J. C. 2024. A global dataset of 7 billion individuals with socio-economic characteristics. Scientific Data, 11(1): 1096
2024
-
[17]
K.; Szantoi, Z.; Buchanan, G.; Dech, S.; Dwyer, J.; Herold, M.; et al
Turner, W.; Rondinini, C.; Pettorelli, N.; Mora, B.; Leidner, A. K.; Szantoi, Z.; Buchanan, G.; Dech, S.; Dwyer, J.; Herold, M.; et al. 2015. Free and open-access satellite data are key to biodiversity conservation. Biological Conservation, 182: 173--176
2015
-
[18]
K.; Czaran, L.; et al
Voigt, S.; Giulio-Tonolo, F.; Lyons, J.; Ku c era, J.; Jones, B.; Schneiderhan, T.; Platzeck, G.; Kaku, K.; Hazarika, M. K.; Czaran, L.; et al. 2016. Global trends in satellite-based emergency mapping. Science, 353(6296): 247--252
2016
-
[19]
A.; Masek, J
Wulder, M. A.; Masek, J. G.; Cohen, W. B.; Loveland, T. R.; and Woodcock, C. E. 2012. Opening the archive: How free data has enabled the science and monitoring promise of Landsat. Remote Sensing of Environment, 122: 2--10
2012
-
[20]
Xia, J.; Yokoya, N.; Adriano, B.; and Broni-Bediako, C. 2023. Openearthmap: A benchmark dataset for global high-resolution land cover mapping. In Proceedings of the IEEE/CVF Winter Conference on Applications of Computer Vision, 6254--6264
2023
-
[21]
Zippenfenig, P. 2023. Open-Meteo.com Weather API
2023
Reviewed August 16, 2026 · model on record in the stance chip above.
Discussion (0). Continue with ORCID to comment.