REVIEW 5 major objections 4 minor 44 references
ComBAT Harmonization for diffusion MRI: Challenges and Best Practices
T0 review · 5 major / 4 minor · reviewed 2026-08-15 · deepseek-v4-flash
Pith's one-line read ComBAT, the standard method for pooling MRI measurements across sites, works only when age's effect is identical at every site; violating that hidden assumption misaligns populations and corrupts variance estimates.
desk verdict A useful, honest practical evaluation of ComBAT's known limitations, but the new quantitative thresholds rest on simulations that mirror ComBAT's own linear assumptions and are not statistically grounded. read the letter →
The pith
A machine-rendered reading of the paper's core claim, the machinery that carries it, and where it could break.
The reading
What carries the argument
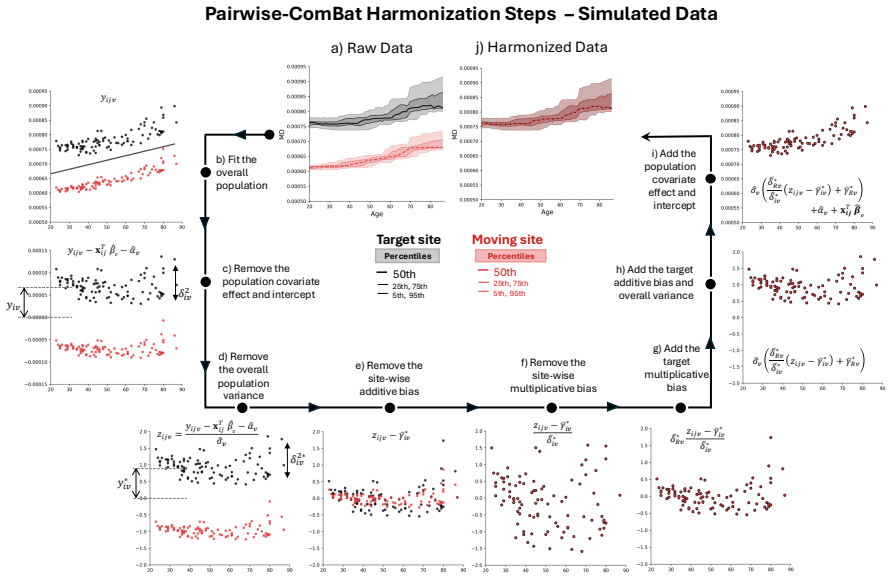
The load-bearing object is the linear generative model $y_{ijv} = \alpha_v + x_{ij}^T\beta_v + \gamma_{iv} + \delta_{iv}\varepsilon_{ijv}$, where $x_{ij}$ collects covariates such as age and sex, $\beta_v$ is the common population slope, $\gamma_{iv}$ the additive site effect, and $\delta_{iv}$ the multiplicative site effect. Because ComBAT standardizes data by removing the population trend $x_{ij}^T\hat{\beta}_v$, any site-specific multiplication of that slope — written as the factor $S$ in $y_{ijv} = \alpha_v + \gamma_{iv}A + x_{ij}^T\beta_v S + \delta_{iv}\varepsilon_{ijv}M$ — bypasses the correction and survives as a misalignment. The experimental vehicle is Pairwise-ComBAT, a reconfiguration that harmonizes each moving site independently onto a fixed reference population rather than onto a pooled average, and a synthetic-protocol design in which a real healthy-aging cohort is rescaled with known additive ($A$), slope ($S$), and variance ($M$) factors so that harmonization error can be measured exactly. A closed-form Bhattacharyya distance between rectified Gaussian populations serves as the quality metric.
What would settle it
Take two real sites whose age-versus-metric slopes are known to differ markedly, run standard ComBAT with more than 32 subjects and a full age span at each site, and measure the Bhattacharyya distance between the harmonized and reference distributions on held-out subjects: the paper predicts a large distance whenever the slope factor departs from 1, so near-zero distance on such a pair would contradict the central claim. A second check targets the variance claim: on two sites with matched slopes, compare ComBAT's estimated site variance with the empirical within-site variance; if they converge well before 100 subjects, the paper's claim that the prior keeps disproportionately high weight near 100 subjects would be refuted.
Extended reading notes
Core claim
ComBAT models each measured value as a linear function of covariates plus an additive site effect and a multiplicative site effect, and assumes the covariate regression vector $\beta_v$ — the population slope relating age to the measured metric — is identical at every site. The central demonstration is that this slope assumption is often wrong: when a moving site has been rescaled by a slope factor $S \neq 1$ relative to the reference, ComBAT compensates the additive bias but leaves the multiplicative bias uncorrected, so the harmonized populations stay misaligned and the estimated site variance $\hat{\delta}^{2*}_{iv}$ carries a growing quadratic error. In controlled experiments with known injected bias, slope, and variance factors, harmonization quality deteriorates sharply for slope factors of 0 and 1.8 even though pure additive and pure multiplicative differences are handled well. The paper also shows that the variance estimator keeps a disproportionately large weight on its prior even for populations above roughly 100 subjects, and introduces a Bhattacharyya-distance measure on covariate-rectified data as a goodness-of-fit metric for harmonization.
Load-bearing premise
The experiments assume real inter-site differences are exactly the kind the authors inject — a global additive offset, a slope change, and a variance change applied to one healthy population — so if genuine site effects are messier, such as nonlinear age trajectories or acquisition-specific artifacts, the diagnosed failure modes and the recommended sample-size and age-range thresholds may not transfer to real data.
Editorial extensions
If this is right
- Multi-site studies should verify that covariate slopes, such as the age-versus-metric relationship, are approximately equal across sites before running ComBAT, because large slope discrepancies predict failed harmonization even when additive and multiplicative biases are modest.
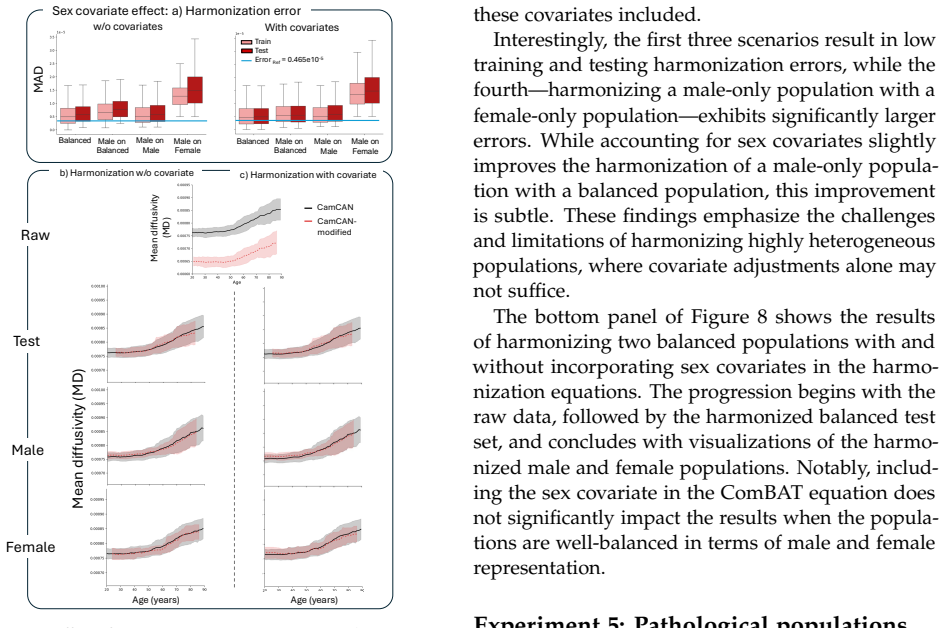
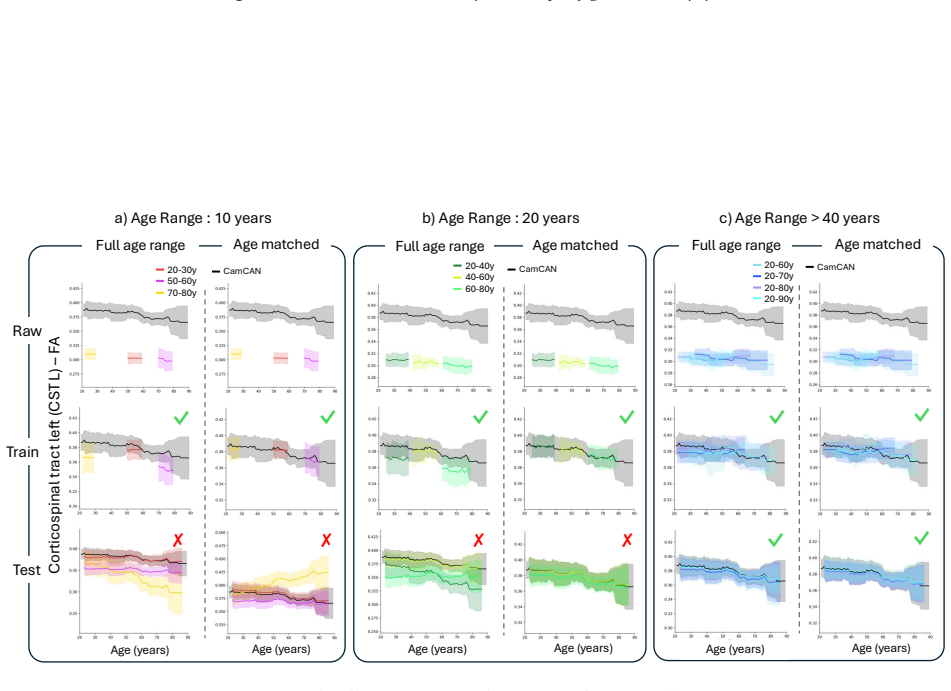
- Reliable harmonization has concrete lower bounds on the moving site: at least 16 to 32 training subjects, an age span of roughly 40 years or more, and balanced male/female composition; below these, test-set generalization degrades even when training fits look good.
- For normative modeling and clinical applications, harmonization parameters should be estimated on healthy control subjects only and then applied to pathological subjects; including pathology in the estimation compresses diseased populations into the normal range and erases the disease signal.
- Harmonizing each site to a single fixed reference dataset, rather than to the pooled average of all sites, allows new sites to be added without re-estimating previously established parameters, a direct benefit for open-data sharing, longitudinal studies, and clinical data streams.
- Because a slope mismatch corrupts the estimated site variance, any downstream statistic built from post-harmonization variance — such as normative deviation scores — inherits the bias unless the slope condition is checked first.
Reading between the lines
- A cheap pre-flight check the authors do not propose: fit the covariate model inside each site separately, compare slope estimates and their confidence intervals, and restrict ComBAT harmonization to site pairs whose slopes overlap, turning the paper's negative result into a positive screening test.
- Because the variance estimator keeps strong prior weight even near 100 subjects, a natural extension is a sample-size-aware prior or reporting both the shrunk and the empirical variance; the paper documents the symptom but does not propose the remedy.
- The equal-slope requirement is stated for linear slopes, yet many diffusion metrics change nonlinearly with age; a testable prediction is that the 40-year age-range rule is necessary but not sufficient on cohorts with curvilinear age trajectories, where a global linear fit can mask locally mismatched slopes.
- The reference-anchored framing implies a frozen-parameter protocol for live clinical data: estimate the harmonization function once on a normative reference, then harmonize each incoming subject with those fixed parameters, eliminating the moving-target problem by construction rather than by re-estimation.
Signed reviews
Editorial analysis
A structured set of objections, weighed in public.
Referee Report
Summary. The manuscript re-derives the linear model underlying ComBAT harmonization and pinpoints the assumption that the covariate slope β_v is identical across sites. It introduces Pairwise-ComBAT, which harmonizes each site to a fixed reference dataset, and proposes a Bhattacharyya-distance goodness-of-fit measure. Using a synthetic "modified-CamCAN" dataset created by applying additive, slope, and multiplicative transforms to CamCAN, plus two real datasets (ADNI and NIMH), the authors run experiments varying bias magnitude, sample size, age range, sex covariates, and pathological contamination. They conclude with recommendations: ComBAT should not be used as a black box; covariate slopes should be matched; at least 16–32 subjects per site are recommended; the age range should span at least 40 years; sex distributions should be balanced; and harmonization parameters should be estimated on healthy controls only.
Significance. If the central claims hold, the paper is a useful service to the ComBAT user community. The formal observation around Eq. (14)—that a site-specific slope multiplier S_i leaves a residual x^T β(S_i−1) that no additive or multiplicative correction can remove—is correct and is illustrated in the synthetic and NIMH examples. The train/test decomposition of harmonization error is a good methodological instinct, and the recommendation to estimate batch parameters on healthy controls is clinically sensible. The ADNI pathology illustration in Fig. 10 convincingly shows the risk of compressing patient distributions into the normative range. However, the quantitative thresholds that are the paper's headline contribution rest on simulations that satisfy ComBAT's linear assumptions by construction, and no uncertainty is reported on the 30-repeat averages. The significance is therefore real, but the strength of the quantitative recommendations currently exceeds what the evidence supports.
major comments (5)
- [Mathematical limitations and Dataset studied (Eqs. 14 and 16)] The generative model used to create the synthetic moving site is not the model analyzed in the theory. Eq. (14) shows that a slope multiplier S_i necessarily changes the intercept through the term γ_iv = α_v(S_i−1)+A_i, so slope and additive site effects are coupled. Eq. (16), by contrast, applies the additive factor A and slope factor S independently to the CamCAN baseline. The simulated failure modes in Figs. 3–7 therefore do not directly instantiate the theoretical failure mode of Eq. (14), and the measured effects may not transfer to situations where slope and intercept changes are coupled. Please justify the independent parameterization or rerun the central experiments under the coupled model derived in Eq. (14).
- [Results (Figs. 5 and 7)] The recommendations "at least 16 to 32 subjects" and "age range at least 40 years" are read off MAD curves that are averaged over 30 repetitions but presented without confidence intervals, error bars, or any inferential test. In Fig. 5(a) and Fig. 7, the training and testing curves approach the reference floor smoothly, and it is not possible to tell whether the apparent plateau at N≈32 or age span≈40 is statistically distinguishable from the floor at larger N or wider age spans. Because these thresholds are a central product of the paper, please report per-condition variability (e.g., bootstrap CIs or box plots over the 30 repeats) and, where possible, a test comparing the error at the recommended operating point with the reference error.
- [Experiments 2 and 3; Dataset studied (Modified-CamCAN)] The sample-size and age-range experiments are conducted exclusively on Modified-CamCAN, in which the moving site and the test set are generated by applying the same global linear transform to the same CamCAN distribution used as the reference. This means the data satisfy ComBAT's model assumptions by construction, with no nonlinear age trajectories, voxel-dependent scanner effects, or acquisition-specific artifacts. The experiments therefore test interpolation under a correct model, not robustness to model misspecification. The ADNI and NIMH analyses are qualitative illustrations rather than quantitative validation of the thresholds. The recommendations should be labeled as conditional on the synthetic model, or supported by additional real-data analyses with varying sample size and age range.
- [Pairwise-ComBAT (Eq. 15)] Eq. (15) adds back the covariate effect as x^T_Rj β̂_v, i.e., using the covariates of a reference-site subject rather than those of the moving-site subject being harmonized. If this is not a typographical error, the method replaces each moving subject's age/sex effect with the reference subject's covariates and thereby destroys biological variability. If it is a typo, it should read x^T_Mj β̂_v. Either way, the current text cannot be implemented faithfully, and the accompanying code is not yet public, so a reader cannot resolve the ambiguity from the repository.
- [Goodness of fit] The formula for the Bhattacharyya distance is inconsistent and, as printed, incorrect. The notation switches between subscripts R and T (z_Rjv is defined while the expression uses µ_Tv and σ_Tv), and the logarithmic term should have denominator 2 σ_Tv σ_Mv, not 2 σ_Tv + σ_Mv. Since all BD values in Figs. 3, 4, 9, and 10 are quantitative evidence for the paper's conclusions, the printed formula and notation must be corrected.
minor comments (4)
- [Abstract and Recommendations] The abstract states "five essential recommendations," but the Recommendations section lists six bullet points and the Conclusion also says "six recommendations." Please align the count.
- [Code and Data Availability] The availability statement says the code and data "will be rendered public upon acceptance." For a paper whose stated goals are reproducibility and open science, please make the Pairwise-ComBAT code and the modified-CamCAN generation scripts available during review, at least as supplementary material.
- [Captions of Figs. 8 and 9] "Mean Absolution Difference" should be "Mean Absolute Difference." In addition, the MAD metric is used without a formal definition; please define it in the Method section or figure captions.
- [Figure 5(a)] The label "Error Ref = 0.465e10-5" appears to mean 0.465×10⁻⁵ but the typesetting is confusing. Please write it unambiguously.
Circularity Check
No significant circularity: the slope-assumption failure follows from the paper's own Eq. (14), and experiments include external ADNI/NIMH validation, so the central claim does not reduce to its inputs.
full rationale
The paper's central claim is mathematical: ComBAT assumes a site-independent slope βv in Eq. (1), and when data are generated under Eq. (14) with a site-specific slope multiplier Si, the harmonized population retains a residual xTβv(Si−1) that no additive or multiplicative site correction removes. This is derived from the paper's own equations and is not an input restated as a conclusion. The simulation studies generate Modified-CamCAN via Eq. (16), which is deliberately within ComBAT's linear model family; measuring MAD/BD on such data is a controlled internal-consistency check, not a prediction equivalent to its inputs by construction. Crucially, the paper does not stop at the synthetic data: NIMH and ADNI datasets are harmonized and show qualitatively the same slope-mismatch and pathology-compression effects, providing independent external evidence. The recommendations on sample size and age range are empirical thresholds read from these simulations; while their portability to real, nonlinear, or confounded site effects may be a generalizability concern, that is a correctness/validity question, not circular reasoning. The only self-references (TractoFlow, response function) concern processing tools and are not load-bearing for the harmonization claims. No step was found in which a fitted parameter is renamed as a prediction or in which a uniqueness or prior-work citation is doing the argumentative work.
Assumptions & free parameters
free parameters (1)
- A, S, M factors in modified-CamCAN generation =
A in {0.6, 0.8, 1.2}; S in {0, 0.8, 1.8}; M in {0.2, 0.8, 1.8}
assumptions (5)
- domain assumption The ComBAT data model (Eq. 1) with a site-independent slope βv and Gaussian noise ε.
- domain assumption Empirical Bayes priors: Gaussian for γ, inverse Gamma for δ^2 (Eqs. 6-7).
- domain assumption The reference site R is well-populated and representative of healthy controls.
- ad hoc to paper Synthetic site differences in modified-CamCAN follow Eq. (16) and are representative of real site effects.
- domain assumption After rectification, harmonized populations are Gaussian so the Bhattacharyya closed-form applies.
Cite this review
Pith. "Pith review of ComBAT Harmonization for diffusion MRI: Challenges and Best Practices." pith.science (2026). https://pith.science/paper/PU3MNTJH
@misc{pith2026250514722,
  author       = {Pith},
  title        = {Pith review of: ComBAT Harmonization for diffusion MRI: Challenges and Best Practices},
  year         = {2026},
  howpublished = {\url{https://pith.science/paper/PU3MNTJH}},
  note         = {Machine review of arXiv:2505.14722}
}
read the original abstract
Over the years, ComBAT has become the standard method for harmonizing MRI-derived measurements, with its ability to compensate for site-related additive and multiplicative biases while preserving biological variability. However, ComBAT relies on a set of assumptions that, when violated, can result in flawed harmonization. In this paper, we thoroughly review ComBAT's mathematical foundation, outlining these assumptions, and exploring their implications for the demographic composition necessary for optimal results. Through a series of experiments involving a slightly modified version of ComBAT called Pairwise-ComBAT tailored for normative modeling applications, we assess the impact of various population characteristics, including population size, age distribution, the absence of certain covariates, and the magnitude of additive and multiplicative factors. Based on these experiments, we present five essential recommendations that should be carefully considered to enhance consistency and supporting reproducibility, two essential factors for open science, collaborative research, and real-life clinical deployment.
Figures


Figures from the paper (27 more)






Reference graph
Works this paper leans on
-
[1]
Mapping human brain charts cross-sectionally and longitudinally
Maria A. Di Biase et al. “Mapping human brain charts cross-sectionally and longitudinally”. In: procs of the National Academy of Sciences 120 (20 May 2023). issn: 0027-8424
work page 2023
-
[2]
Understanding Heterogeneity in Clinical Cohorts Using Normative Models: Beyond Case- Control Studies
Andre F. Marquand et al. “Understanding Heterogeneity in Clinical Cohorts Using Normative Models: Beyond Case- Control Studies”. In: Biological Psychiatry 80 (7 Oct. 2016), pp. 552–561. issn: 00063223
work page 2016
-
[3]
Evidence for embracing normative modeling
Saige Rutherford et al. “Evidence for embracing normative modeling”. In: eLife 12 (Mar. 2023). issn: 2050-084X
work page 2023
-
[4]
Beyond the average patient: how neu- roimaging models can address heterogeneity in dementia
Serena Verdi et al. “Beyond the average patient: how neu- roimaging models can address heterogeneity in dementia”. In: Brain 144 (10 Nov. 2021), pp. 2946–2953. issn: 0006-8950
work page 2021
-
[5]
Julio E. Villalón-Reina et al. “Multi-site Normative Modeling of Diffusion Tensor Imaging Metrics Using Hierarchical Bayesian Regression”. In: proc of MICCAI. 2022, pp. 207–217
work page 2022
-
[6]
Suheyla Cetin-Karayumak et al. “Harmonized diffusion MRI data and white matter measures from the Adolescent Brain Cognitive Development Study”. In: Scientific Data 11 (1 Feb. 2024), p. 249. issn: 2052-4463
work page 2024
-
[7]
Fengling Hu et al. “Image harmonization: A review of statis- tical and deep learning methods for removing batch effects and evaluation metrics for effective harmonization”. In: Neu- roImage 274 (2023), p. 120125
work page 2023
-
[8]
Multi-Site Harmonization of Dif- fusion MRI Data via Method of Moments
Khoi Minh Huynh et al. “Multi-Site Harmonization of Dif- fusion MRI Data via Method of Moments”. In: IEEE Trans. on Med. Ima. 38 (7 July 2019), pp. 1599–1609. issn: 0278-0062. 14
work page 2019
Show all 44 references
-
[9]
Scanner invariant representations for diffusion MRI harmonization
Daniel Moyer et al. “Scanner invariant representations for diffusion MRI harmonization”. In: Magnetic Resonance in Medicine 84 (4 Oct. 2020), pp. 2174–2189. issn: 0740-3194
2020
-
[10]
Schilling et al
Kurt G. Schilling et al. “Fiber tractography bundle segmen- tation depends on scanner effects, vendor effects, acquisition resolution, diffusion sampling scheme, diffusion sensitiza- tion, and bundle segmentation workflow”. In: NeuroImage 242 (Nov. 2021), p. 118451. issn: 10538119
2021
-
[11]
Site effects how-to and when: An overview of retrospective techniques to accommodate site effects in multi-site neuroimaging analyses
Johanna MM Bayer et al. “Site effects how-to and when: An overview of retrospective techniques to accommodate site effects in multi-site neuroimaging analyses”. In: Frontiers in neurology 13 (2022), p. 923988
2022
-
[12]
Multi-site study of diffusion metric variability: effects of site, vendor, field strength, and echo time on regions-of-interest and histogram-bin analyses
Karl G Helmer et al. “Multi-site study of diffusion metric variability: effects of site, vendor, field strength, and echo time on regions-of-interest and histogram-bin analyses”. In: Medical Imaging 2016: Biomedical Applications in Molecular, Structural, and Functional Imaging...
2016
-
[13]
Harmonization of Brain Diffu- sion MRI: Concepts and Methods
Maíra Siqueira Pinto et al. “Harmonization of Brain Diffu- sion MRI: Concepts and Methods”. In: Frontiers in Neuro- science 14 (May 2020). issn: 1662-453X
2020
-
[14]
Mitigating site effects in covariance for machine learning in neuroimaging data
Andrew A Chen et al. “Mitigating site effects in covariance for machine learning in neuroimaging data”. In: Human brain mapping 43.4 (2022), pp. 1179–1195
2022
-
[15]
Cross-site harmonization of multi- shell diffusion MRI measures based on rotational invariant spherical harmonics (RISH)
Alberto De Luca et al. “Cross-site harmonization of multi- shell diffusion MRI measures based on rotational invariant spherical harmonics (RISH)”. In: NeuroImage 259 (Oct. 2022), p. 119439. issn: 10538119
2022
-
[16]
Generalized ComBat harmonization methods for radiomic features with multi-modal distribu- tions and multiple batch effects
Hannah Horng et al. “Generalized ComBat harmonization methods for radiomic features with multi-modal distribu- tions and multiple batch effects”. In: Scientific Reports 12 (1 Mar. 2022), p. 4493. issn: 2045-2322
2022
-
[17]
DeepComBat: A Statistically Motivated, Hyperparameter-Robust, Deep Learning Approach to Har- monization of Neuroimaging Data
Fengling Hu et al. “DeepComBat: A Statistically Motivated, Hyperparameter-Robust, Deep Learning Approach to Har- monization of Neuroimaging Data”. In: bioRxiv (Apr. 2023), p. 2023.04.24.537396
2023
-
[18]
Adjusting batch effects in microarray expression data using empirical Bayes methods
W. Evan Johnson, Cheng Li, and Ariel Rabinovic. “Adjusting batch effects in microarray expression data using empirical Bayes methods”. In: Biostatistics 8 (1 Jan. 2007), pp. 118–127. issn: 1468-4357
2007
-
[19]
Harmonization of multi-site diffusion tensor imaging data
Jean-Philippe Fortin et al. “Harmonization of multi-site diffusion tensor imaging data”. In: NeuroImage 161 (Nov. 2017), pp. 149–170. issn: 10538119
2017
-
[20]
Cross-scanner and cross-protocol diffusion MRI data harmonisation: A benchmark database and evaluation of algorithms
Chantal MW Tax et al. “Cross-scanner and cross-protocol diffusion MRI data harmonisation: A benchmark database and evaluation of algorithms”. In: NeuroImage 195 (2019), pp. 285–299
2019
-
[21]
Retrospective harmoniza- tion of multi-site diffusion MRI data acquired with differ- ent acquisition parameters
Suheyla Cetin Karayumak et al. “Retrospective harmoniza- tion of multi-site diffusion MRI data acquired with differ- ent acquisition parameters”. In: NeuroImage 184 (Jan. 2019), pp. 180–200. issn: 10538119
2019
-
[22]
Harmonization of cortical thick- ness measurements across scanners and sites
Jean-Philippe Fortin et al. “Harmonization of cortical thick- ness measurements across scanners and sites”. In: NeuroIm- age 167 (Feb. 2018), pp. 104–120. issn: 10538119
2018
-
[23]
Increased power by harmoniz- ing structural MRI site differences with the ComBat batch adjustment method in ENIGMA
Joaquim Radua and et.al. “Increased power by harmoniz- ing structural MRI site differences with the ComBat batch adjustment method in ENIGMA”. In: NeuroImage 218 (Sept. 2020), p. 116956. issn: 10538119
2020
-
[24]
MASiVar: Multisite, multiscanner, and multisubject acquisitions for studying variability in diffu- sion weighted MRI
Leon Y Cai et al. “MASiVar: Multisite, multiscanner, and multisubject acquisitions for studying variability in diffu- sion weighted MRI”. In: Magnetic resonance in medicine 86.6 (2021), pp. 3304–3320
2021
-
[25]
Impact of ComBat harmonization on PET radiomics-based tissue classification: a dual-center PET/MRI and PET/CT study
Doris Leithner et al. “Impact of ComBat harmonization on PET radiomics-based tissue classification: a dual-center PET/MRI and PET/CT study”. In: Journal of Nuclear Medicine 63.10 (2022), pp. 1611–1616
2022
-
[26]
Longitudinal ComBat: A method for harmonizing longitudinal multi-scanner imaging data
Joanne C. Beer et al. “Longitudinal ComBat: A method for harmonizing longitudinal multi-scanner imaging data”. In: NeuroImage 220 (Oct. 2020), p. 117129. issn: 10538119
2020
-
[27]
AutoComBat: a generic method for harmonizing MRI-based radiomic features
Alexandre Carré et al. “AutoComBat: a generic method for harmonizing MRI-based radiomic features”. In: Scientific Reports 12.1 (2022), p. 12762
2022
-
[28]
Performance comparison of modified Com- Bat for harmonization of radiomic features for multicenter studies
R. Da-ano et al. “Performance comparison of modified Com- Bat for harmonization of radiomic features for multicenter studies”. In: Scientific Reports 10 (1 June 2020), p. 10248. issn: 2045-2322
2020
-
[29]
Harmonization of large MRI datasets for the analysis of brain imaging patterns through- out the lifespan
Raymond Pomponio et al. “Harmonization of large MRI datasets for the analysis of brain imaging patterns through- out the lifespan”. In: NeuroImage 208 (Mar. 2020), p. 116450. issn: 10538119
2020
-
[30]
Distributed Harmonization: Federated Clustered Batch Effect Adjustment and Generalization
Bao Hoang et al. “Distributed Harmonization: Federated Clustered Batch Effect Adjustment and Generalization”. In: in proc of SIGKDD. 2024, pp. 5105–5115
2024
-
[31]
Efficacy of MRI data harmonization in the age of machine learning: a multicenter study across 36 datasets
Chiara Marzi et al. “Efficacy of MRI data harmonization in the age of machine learning: a multicenter study across 36 datasets.” In: Sci Data 115.11 (2024)
2024
-
[32]
A guide to ComBat harmonization of imaging biomarkers in multicenter studies
Fanny Orlhac et al. “A guide to ComBat harmonization of imaging biomarkers in multicenter studies”. In: Journal of Nuclear Medicine 63.2 (2022), pp. 172–179
2022
-
[33]
Sample size requirement for achiev- ing multisite harmonization using structural brain MRI features
Pravesh Parekh et al. “Sample size requirement for achiev- ing multisite harmonization using structural brain MRI features”. In: NeuroImage 264 (2022), p. 119768
2022
-
[34]
The Cambridge Centre for Age- ing and Neuroscience (Cam-CAN) study protocol: a cross- sectional, lifespan, multidisciplinary examination of healthy cognitive ageing
Meredith A Shafto et al. “The Cambridge Centre for Age- ing and Neuroscience (Cam-CAN) study protocol: a cross- sectional, lifespan, multidisciplinary examination of healthy cognitive ageing”. In: BMC Neurology 14 (1 Dec. 2014), p. 204. issn: 1471-2377
2014
-
[35]
The Cambridge Centre for Ageing and Neuroscience (Cam-CAN) data repository: Structural and functional MRI, MEG, and cognitive data from a cross- sectional adult lifespan sample
Jason R. Taylor et al. “The Cambridge Centre for Ageing and Neuroscience (Cam-CAN) data repository: Structural and functional MRI, MEG, and cognitive data from a cross- sectional adult lifespan sample”. In: NeuroImage 144 (Jan. 2017), pp. 262–269. issn: 10538119
2017
-
[36]
Clinical core of the Alzheimer’s disease neuroimaging initiative: Progress and plans
Paul S. Aisen et al. “Clinical core of the Alzheimer’s disease neuroimaging initiative: Progress and plans”. In: Alzheimer’s & Dementia 6 (3 May 2010), pp. 239–246. issn: 1552-5260
2010
-
[37]
The MCIC Collection: A Shared Repository of Multi-Modal, Multi-Site Brain Image Data from a Clinical Investigation of Schizophrenia
Randy L. Gollub et al. “The MCIC Collection: A Shared Repository of Multi-Modal, Multi-Site Brain Image Data from a Clinical Investigation of Schizophrenia”. In: Neuroin- formatics 11 (3 July 2013), pp. 367–388
2013
-
[38]
Closing the life-cycle of normative modeling using federated hierarchical Bayesian regression
Seyed Mostafa Kia et al. “Closing the life-cycle of normative modeling using federated hierarchical Bayesian regression”. In: PLoS One 17.12 (Dec. 2022)
2022
-
[39]
The NIMH Healthy Research Volun- teer Dataset
Allison C Nugent et al. "The NIMH Healthy Research Volun- teer Dataset". 2024
2024
-
[40]
TractoFlow: A robust, efficient and reproducible diffusion MRI pipeline leveraging Nextflow & Singularity
Guillaume Theaud et al. “TractoFlow: A robust, efficient and reproducible diffusion MRI pipeline leveraging Nextflow & Singularity”. In: NeuroImage 218 (Sept. 2020), p. 116889. issn: 1053-8119
2020
-
[41]
Deterministic and probabilistic tractography based on complex fibre orientation distribu- tions
Maxime Descoteaux et al. “Deterministic and probabilistic tractography based on complex fibre orientation distribu- tions”. In: IEEE trans. on med. ima. 28.2 (2008), pp. 269–286
2008
-
[42]
Regionconnect: Rapidly extracting standardized brain connectivity informa- tion in voxel-wise neuroimaging studies
Xiaoxiao Qi and Konstantinos Arfanakis. “Regionconnect: Rapidly extracting standardized brain connectivity informa- tion in voxel-wise neuroimaging studies”. In: Neuroimage 225 (2021), p. 117462. 15
2021
-
[43]
Empirical assessment of the assump- tions of ComBat with diffusion tensor imaging
Michael E Kim et al. “Empirical assessment of the assump- tions of ComBat with diffusion tensor imaging”. In: Jour of Med Ima 11.2 (2024), pp. 024011–024011
2024
-
[44]
Volumetric analysis from a har- monized multisite brain MRI study of a single subject with multiple sclerosis
Russell T Shinohara et al. “Volumetric analysis from a har- monized multisite brain MRI study of a single subject with multiple sclerosis”. In: American Journal of Neuroradiology 38.8 (2017), pp. 1501–1509. . 16 Supplementary material This document contains complementary resul...
2017
Reviewed August 15, 2026 · model on record in the stance chip above.
Discussion (0). Continue with ORCID to comment.