REVIEW 4 major objections 6 minor 37 references
Is Hyperbolic Space All You Need for Medical Anomaly Detection?
T0 review · 4 major / 6 minor · reviewed 2026-08-07 · deepseek-v4-flash
Pith's one-line read The paper claims that hyperbolic space, not a larger model or dataset, is the active ingredient in medical anomaly detection: projecting frozen pre-trained features onto a Lorentz hyperboloid and separating them with a learned hyperplane…
desk verdict Solid empirical win for a hyperbolic anomaly-detection pipeline on BMAD, but the title and abstract overclaim attribution to geometry; needs a Euclidean twin and an honest abstract before I'd trust the 'all you need' framing. read the letter →
The pith
A machine-rendered reading of the paper's core claim, the machinery that carries it, and where it could break.
The reading
What carries the argument
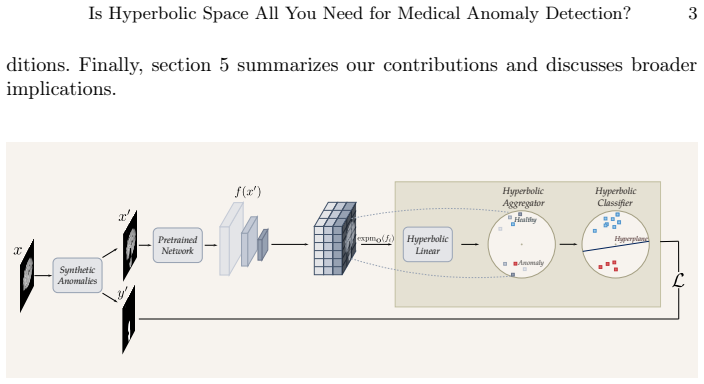
The load-bearing object is the Lorentz hyperboloid $\mathbb{L}_c^n$, the standard model of hyperbolic space with constant negative curvature $c$, used as the feature space for every image. The argument runs through three ingredients: the exponential map of eq. (1) carries Euclidean patch features onto the hyperboloid; the weighted Lorentzian centroid of eq. (2) aggregates features from different network layers into a single point, with weights given by the Euclidean norm of each feature after mapping to the Poincaré ball, interpreted as confidence; and the hyperbolic hyperplane of eqs. (3)–(5) classifies a point by the signed geodesic distance to a learned separating hyperplane, trained with binary cross-entropy. The curvature $c$ is itself trainable, so the geometry adapts to each dataset, and the ablations show that fixing the curvature hurts performance.
What would settle it
The cleanest test is to keep every component identical but replace the Lorentz exponential map with the identity so features stay Euclidean; if this Euclidean twin matches or exceeds the reported image-level AUROC on the five BMAD datasets, the central claim that hyperbolic geometry is responsible for the gains is falsified.
Extended reading notes
Core claim
The paper's central claim is that hyperbolic geometry itself, not a larger model or richer training set, is what buys the improvement. Starting from a frozen WideResNet-50, the authors generate synthetic anomalies and push patchified features from layers 2 and 3 onto the Lorentz hyperboloid via the exponential map; a hyperbolic linear layer adapts the ImageNet-pretrained features to the medical domain, and a weighted Lorentzian centroid pools the hierarchical levels into one point per image, with weights set by each feature's distance from the origin. A learned hyperplane in the Lorentz model then separates normal from anomalous samples. Across the five BMAD datasets (brain MRI, liver CT, retinal OCT, chest X-ray), the paper reports the best image-level AUROC for every dataset—for example, 92.49 versus 92.02 for PatchCore on BraTS2021—while pixel-level AUROC is competitive but not uniformly the best. The paper also claims strong few-shot behaviour, beating PaDiM and PatchCore when only a handful of healthy images are available, and graceful degradation when the hyperbolic embedding dimension is cut to as low as two.
Load-bearing premise
The paper's claims rest on synthetic anomalies—CutPaste patches, Gaussian intensity changes, and source deformations—being a faithful proxy for the real lesions in the BMAD test sets, since the hyperbolic hyperplane is trained only on those synthetic examples.
Editorial extensions
If this is right
- Medical anomaly detection can be improved by a geometric swap alone: no new backbone, no extra labels, and no data augmentation are needed.
- Few-shot deployment becomes feasible: with as few as one to twenty-five healthy images, the hyperbolic detector is reported to outperform PaDiM and PatchCore, which matters for rare diseases and new imaging modalities.
- The framework tolerates low-dimensional embeddings, so memory-constrained settings can use compact hyperbolic representations without losing much localization accuracy.
- Because the curvature is learned per dataset, the method effectively tunes the shape of the representation space rather than assuming a fixed geometry.
Reading between the lines
- A natural test the paper does not run is to train the same hyperplane on real, annotated lesion patches instead of synthetic anomalies; if the reported advantage shrinks, the synthetic proxy is carrying part of the result.
- The same recipe—frozen features, confidence-weighted hyperbolic centroid, learned hyperplane—should transfer beyond medicine to industrial or satellite anomaly detection, since none of the components is modality-specific.
- The table suggests the geometric gain is larger for whole-image decisions than for pixel-level localization, since different Euclidean baselines win PAUROC on specific datasets; testing aggregation weights or adding earlier-layer features could show where the localization ceiling comes from.
- Because the backbone is frozen, the method could be composed with larger or medical-specific feature extractors as they appear, likely preserving the geometric advantage.
Editorial analysis
A structured set of objections, weighed in public.
Referee Report
Summary. This paper proposes a hyperbolic anomaly detection and localization framework for medical images. The method generates synthetic anomalies (CutPaste, Gaussian intensity, source deformation), extracts patchified features from a frozen WideResNet50, projects them into the Lorentz model of hyperbolic space, aggregates layer-wise features using confidence weights based on Euclidean L2 norms, and trains a hyperbolic hyperplane classifier with binary cross-entropy. It is evaluated on five BMAD datasets (BraTS2021, BTCV+LiTs, RESC, OCT2017, RSNA) using image-level and pixel-level AUROC, with comparisons to five Euclidean baselines (RD4AD, STFPM, PaDiM, PatchCore, CFA). The paper also reports ablations on curvature, patch size, and dimensionality, plus few-shot experiments with 1 to 25 normal images.
Significance. If the headline claim were fully supported, this would be a practical empirical contribution: a simple, frozen-backbone method that beats established Euclidean anomaly-detection benchmarks on medical images would be useful, especially in low-data regimes. The paper has clear strengths: it uses the standardized BMAD benchmark, reports mean/min/max over five random seeds, includes ablations of key hyperparameters, and compares against five standard baselines. The image-level results are favorable and the experimental setup is described in enough detail to be reproduced. However, the core attribution of the gains to hyperbolic geometry is not established by the current design, and the pixel-level and few-shot claims are stronger than the reported evidence. The paper would be materially improved by adding a Euclidean control of the same pipeline and by toning down the abstract and conclusions to match the quantitative results.
major comments (4)
- [Abstract and Table 2] The abstract states that hyperbolic space achieves higher AUROC scores at both image and pixel levels across multiple datasets, but Table 2 does not support the pixel-level part: on BraTS2021 the proposed method reaches PAUROC 95.56 versus RD4AD's 96.36, and on RESC it reaches PAUROC 95.32 versus PatchCore's 95.87. The text in Section 4 correctly describes the pixel-level results as competitive, but the abstract and Section 5 repeat the stronger claim. Please revise the abstract and conclusions to state that image-level IAUROC is the consistently superior metric and that pixel-level PAUROC is competitive but not always best.
- [Sections 2.3-2.4 and Table 2] The central claim that hyperbolic geometry causes the observed improvement is not tested. The proposed pipeline differs from every Euclidean baseline in several components at once: the synthetic anomaly generation (Section 2.1), the confidence-weighted aggregation (Eq. 2), and the hyperplane classifier (Eqs. 3-6). None of the five baselines shares these components, so the higher IAUROC could come from the anomaly synthesis or the classifier rather than from curvature. To justify the title's claim, the authors should add a Euclidean counterpart of the same pipeline with identical frozen features, synthetic anomalies, aggregation weights, and an analogous Euclidean hyperplane classifier, and report whether hyperbolic projection still improves over that control. Without this comparison, the statement that hyperbolic space is what matters remains an attribution hypothesis rather than a demonstrated result.
- [Section 4.2 and Figure 3] The few-shot claim is supported only by Figure 3, with no numeric table, confidence intervals, or significance tests. The text says the hyperbolic model 'significantly outperforms' PaDiM and PatchCore, but no Mann-Whitney U results are reported for these comparisons, and only two baselines are included. Please provide a table with mean/min/max IAUROC and PAUROC for each dataset and each sample count (1, 3, 5, 10, 25), and report p-values for the comparisons against both baselines.
- [Eq. (2) and Section 2.3] The confidence weights w_{i,l} are a distinctive part of the method, but there is no ablation that removes them or replaces them with equal weights. As a consequence, the contribution of the hyperbolic projection is conflated with the contribution of the weighting scheme. Please add an ablation with equal weights and, ideally, with weights computed from Euclidean norms, to show which component drives the reported gains.
minor comments (6)
- [Section 2.2] Please clarify the notation f_{i,l} and the aggregation dimensions after upsampling; the text says 'to give a feature map f_{i,l} ∈ R^C' but Eq. (2) sums over l in a way that suggests each level contributes a centroid.
- [Table 2] The caption should state explicitly that PAUROC is not reported for OCT2017 and RSNA, or the missing entries should be marked; the current table header is ambiguous about which columns are image-level and which are pixel-level for these datasets.
- [Section 4.1] Please report the learned curvature values for each dataset and add a log-scale label to the x-axis of the curvature plot, since the text claims the learnable curvature adaptively optimizes the geometry.
- [Figure 3] The x-axis values 1, 3, 5, 10, 25 are not evenly spaced; use a consistent linear or logarithmic scale and ensure the legend is identical across subplots.
- [Throughout] Minor typos and heading issues: 'Synthesis Anomalies' in Section 2.1 should be 'Anomaly Synthesis' or 'Synthesizing Anomalies'; 'the the exponential map' appears in Section 2.3; 'T able 1' appears before Table 1.
- [Section 5] The conclusions mention reconstruction-based methods [24, 25] and gradient-based methods [15] without introducing them earlier; add a sentence of context where these categories first appear.
Circularity Check
No significant circularity: empirical benchmark study; self-citations are motivational, not load-bearing.
full rationale
This paper is an empirical benchmark study, not a derivation whose conclusion is secretly an input. The method in Section 2 is a standard hyperbolic pipeline: Lorentz exponential map (Eq. 1), weighted centroid aggregation (Eq. 2), hyperplane distance and logit (Eqs. 3-5), and binary cross-entropy training (Eq. 6). The hyperplane is trained on synthetic anomalies and evaluated on held-out real anomalies from the external BMAD benchmark, so the reported AUROC scores are not fitted parameters renamed as predictions. The main self-citation [14] appears in motivational statements about confidence-based weighting and low-dimensional efficiency, but the central claim that hyperbolic space helps anomaly detection is tested against independent Euclidean baselines in Table 2 and Figure 3, not established by that citation. The absence of a Euclidean version of the exact same pipeline is a legitimate experimental confound, but it is not a circular reduction: no equation or fitted value is equivalent to the claimed result by construction. Consequently, no circular step meets the threshold for flagging, and the appropriate score is 0.
Assumptions & free parameters
free parameters (4)
- curvature c =
trainable, initialized to 1
- patch size =
3
- hyperbolic layer dimensionality =
1024
- learning rate, epochs, batch size =
1e-3, 50, 32
assumptions (4)
- domain assumption Pre-trained WideResNet50 features encode hierarchical medical image attributes useful for anomaly detection.
- ad hoc to paper Synthetic anomalies (CutPaste, Gaussian intensity, source deformation) are a valid proxy for real clinical anomalies.
- ad hoc to paper Euclidean L2 norms of features transformed to the Poincaré ball indicate confidence or hierarchical depth.
- standard math Standard Lorentz model formulas (exponential map, hyperplane distance) are applied correctly.
Cite this review
Pith. "Pith review of Is Hyperbolic Space All You Need for Medical Anomaly Detection?." pith.science (2026). https://pith.science/paper/C6FGII4L
@misc{pith2026250521228,
  author       = {Pith},
  title        = {Pith review of: Is Hyperbolic Space All You Need for Medical Anomaly Detection?},
  year         = {2026},
  howpublished = {\url{https://pith.science/paper/C6FGII4L}},
  note         = {Machine review of arXiv:2505.21228}
}
read the original abstract
Medical anomaly detection has emerged as a promising solution to challenges in data availability and labeling constraints. Traditional methods extract features from different layers of pre-trained networks in Euclidean space; however, Euclidean representations fail to effectively capture the hierarchical relationships within these features, leading to suboptimal anomaly detection performance. We propose a novel yet simple approach that projects feature representations into hyperbolic space, aggregates them based on confidence levels, and classifies samples as healthy or anomalous. Our experiments demonstrate that hyperbolic space consistently outperforms Euclidean-based frameworks, achieving higher AUROC scores at both image and pixel levels across multiple medical benchmark datasets. Additionally, we show that hyperbolic space exhibits resilience to parameter variations and excels in few-shot scenarios, where healthy images are scarce. These findings underscore the potential of hyperbolic space as a powerful alternative for medical anomaly detection. The project website can be found at https://hyperbolic-anomalies.github.io
Figures


Reference graph
Works this paper leans on
-
[14]
Gonzalez-Jimenez, A., Lionetti, S., Bazazian, D., Gottfrois, P., Gröger, F., Pouly, M., Navarini, A.: Hyperbolic Metric Learning for Visual Outlier Detection. In: ECCVW (Sep 2024)
work page 2024
-
[1]
Baid, U., Ghodasara, S., Mohan, S., Bilello, M., Calabrese, E., Colak, E., Fara- hani, K., Kalpathy-Cramer, J., Kitamura, F.C., Pati, S., et al.: The RSNA-ASNR- MICCAIBraTS2021BenchmarkonBrainTumorSegmentationandRadiogenomic Classification (Sep 2021)
work page 2021
-
[2]
Bao, J., Sun, H., Deng, H., He, Y., Zhang, Z., Li, X.: BMAD: Benchmarks for Medical Anomaly Detection. In: CVPRW (Apr 2024)
work page 2024
-
[3]
Baugh, M., Tan, J., Müller, J.P., Dombrowski, M., Batten, J., Kainz, B.: Many tasks make light work: Learning to localise medical anomalies from multiple syn- thetic tasks. In: MICCAI (Jul 2023)
work page 2023
-
[4]
Bdeir, A., Schwethelm, K., Landwehr, N.: Fully Hyperbolic Convolutional Neural Networks for Computer Vision. In: ICLR (Oct 2023)
work page 2023
-
[5]
Medical Image Analysis (Feb 2023)
Bilic,P.,Christ,P.,Li,H.B.,Vorontsov,E.,Ben-Cohen,A.,Kaissis,G.,Szeskin,A., Jacobs, C., Mamani, G.E.H., Chartrand, G., et al.: The Liver Tumor Segmentation Benchmark (LiTS). Medical Image Analysis (Feb 2023)
work page 2023
-
[6]
Bridson, M.R., Haefliger, A.: Metric Spaces of Non-Positive Curvature (1999)
work page 1999
-
[7]
Chen, W., Han, X., Lin, Y., Zhao, H., Liu, Z., Li, P., Sun, M., Zhou, J.: Fully hyperbolic neural networks. In: Proceedings of the 60th Annual Meeting of the Association for Computational Linguistics (Volume 1: Long Papers) (2022)
work page 2022
Show all 37 references
-
[8]
In: ICPRW (2021)
Defard, T., Setkov, A., Loesch, A., Audigier, R.: PaDiM: A Patch Distribution Modeling Framework for Anomaly Detection and Localization. In: ICPRW (2021)
2021
-
[9]
In: CVPR (Mar 2022)
Deng, H., Li, X.: Anomaly Detection via Reverse Distillation from One-Class Em- bedding. In: CVPR (Mar 2022)
2022
-
[10]
In: CVPR (Jun 2009)
Deng, J., Dong, W., Socher, R., Li, L.J., Li, K., Fei-Fei, L.: Imagenet: A large-scale hierarchical image database. In: CVPR (Jun 2009)
2009
-
[11]
In: ICML (2023) 10 Gonzalez-Jimenez et al
Desai, K., Nickel, M., Rajpurohit, T., Johnson, J., Vedantam, S.R.: Hyperbolic Image-text Representations. In: ICML (2023) 10 Gonzalez-Jimenez et al
2023
-
[12]
In: ICML (Jun 2018)
Ganea, O.E., Bécigneul, G., Hofmann, T.: Hyperbolic Entailment Cones for Learn- ing Hierarchical Embeddings. In: ICML (Jun 2018)
2018
-
[13]
In: CVPR (Mar 2022)
GhadimiAtigh, M., Schoep, J., Acar, E., van Noord, N., Mettes, P.: Hyperbolic Image Segmentation. In: CVPR (Mar 2022)
2022
-
[15]
In: CVPRW
Gonzalez-Jimenez, A., Lionetti, S., Pouly, M., Navarini, A.A.: Sano: Score-based diffusion model for anomaly localization in dermatology. In: CVPRW. pp. 2988– 2994 (2023)
2023
-
[16]
Medical Image Analysis (Jul 2019)
Hu, J., Chen, Y., Yi, Z.: Automated segmentation of macular edema in OCT using deep neural networks. Medical Image Analysis (Jul 2019)
2019
-
[17]
Cell (Feb 2018)
Kermany, D.S., Goldbaum, M., Cai, W., Valentim, C.C.S., Liang, H., Baxter, S.L., McKeown, A., Yang, G., Wu, X., Yan, F., et al.: Identifying Medical Diagnoses and Treatable Diseases by Image-Based Deep Learning. Cell (Feb 2018)
2018
-
[18]
In: CVPR (Mar 2020)
Khrulkov, V., Mirvakhabova, L., Ustinova, E., Oseledets, I., Lempitsky, V.: Hy- perbolic Image Embeddings. In: CVPR (Mar 2020)
2020
-
[19]
In: NeurIPS (Feb 2024)
Kusupati, A., Bhatt, G., Rege, A., Wallingford, M., Sinha, A., Ramanujan, V., Howard-Snyder, W., Chen, K., Kakade, S., Jain, P., et al.: Matryoshka Represen- tation Learning. In: NeurIPS (Feb 2024)
2024
-
[20]
In: MICCAI (2015)
Landman, B., Xu, Z., Igelsias, J., Styner, M., Langerak, T., Klein, A.: Multi-Atlas Labeling Beyond the Cranial Vault - Workshop and Challenge. In: MICCAI (2015)
2015
-
[21]
In: ICML (2019)
Law,M.,Liao,R.,Snell,J.,Zemel,R.:LorentzianDistanceLearningforHyperbolic Representations. In: ICML (2019)
2019
-
[22]
IEEE Access (2022)
Lee, S., Lee, S., Song, B.C.: CFA: Coupled-hypersphere-based Feature Adaptation for Target-Oriented Anomaly Localization. IEEE Access (2022)
2022
-
[23]
In: CVPR (2021)
Li, C.L., Sohn, K., Yoon, J., Pfister, T.: CutPaste: Self-Supervised Learning for Anomaly Detection and Localization. In: CVPR (2021)
2021
-
[24]
arXiv preprint arXiv: 2501.11430 (2025)
Liu, J., Ma, Z., Wang, Z., Zou, C., Ren, J., Wang, Z., Song, L., Hu, B., Liu, Y., Leung, V.C.M.: A survey on diffusion models for anomaly detection. arXiv preprint arXiv: 2501.11430 (2025)
2025 arXiv
-
[25]
ICLR (2023)
Livernoche, V., Jain, V., Hezaveh, Y., Ravanbakhsh, S.: On diffusion modeling for anomaly detection. ICLR (2023)
2023
-
[26]
In: ICML (2023)
Mishne, G., Wan, Z., Wang, Y., Yang, S.: The Numerical Stability of Hyperbolic Representation Learning. In: ICML (2023)
2023
-
[27]
In: NeurIPS (2017)
Nickel, M., Kiela, D.: Poincaré Embeddings for Learning Hierarchical Representa- tions. In: NeurIPS (2017)
2017
-
[28]
In: CVPR (May 2022)
Roth, K., Pemula, L., Zepeda, J., Schölkopf, B., Brox, T., Gehler, P.: Towards Total Recall in Industrial Anomaly Detection. In: CVPR (May 2022)
2022
-
[29]
In: ICML (2018)
Ruff, L., Vandermeulen, R., Goernitz, N., Deecke, L., Siddiqui, S.A., Binder, A., Müller, E., Kloft, M.: Deep One-Class Classification. In: ICML (2018)
2018
-
[30]
In: ICML (2018)
Sala, F., Sa, C.D., Gu, A., Re, C.: Representation Tradeoffs for Hyperbolic Em- beddings. In: ICML (2018)
2018
-
[31]
In: ECCV (Jul 2022)
Schlüter, H.M., Tan, J., Hou, B., Kainz, B.: Natural Synthetic Anomalies for Self- Supervised Anomaly Detection and Localization. In: ECCV (Jul 2022)
2022
-
[32]
In: Data Science – Analytics and Applications (2022)
Tschuchnig, M.E., Gadermayr, M.: Anomaly Detection in Medical Imaging - A Mini Review. In: Data Science – Analytics and Applications (2022)
2022
-
[33]
In: ICCV (2023)
van Spengler, M., Berkhout, E., Mettes, P.: Poincare ResNet. In: ICCV (2023)
2023
-
[34]
In: CVPR (2017) Is Hyperbolic Space All You Need for Medical Anomaly Detection? 11
Wang, X., Peng, Y., Lu, L., Lu, Z., Bagheri, M., Summers, R.M.: ChestX-Ray8: Hospital-Scale Chest X-Ray Database and Benchmarks on Weakly-Supervised Classification and Localization of Common Thorax Diseases. In: CVPR (2017) Is Hyperbolic Space All You Need for Medical Anomaly ...
2017
-
[35]
Yamada, S., Hotta, K.: Reconstruction Student with Attention for Student-Teacher Pyramid Matching (Mar 2022)
2022
-
[36]
arXiv preprint arXiv: 1605.07146 (2016)
Zagoruyko, S., Komodakis, N.: Wide residual networks. arXiv preprint arXiv: 1605.07146 (2016)
2016 arXiv
-
[37]
In: MICCAI (2024)
Zhang, X., Xu, M., Qiu, D., Yan, R., Lang, N., Zhou, X.: MediCLIP: Adapting CLIP for Few-shot Medical Image Anomaly Detection. In: MICCAI (2024)
2024
Reviewed August 7, 2026 · model on record in the stance chip above.
Discussion (0). Sign in to comment.