Pith. sign in

REVIEW 3 major objections 4 minor 20 references

The Geometries of Truth Are Orthogonal Across Tasks

T0 review · 3 major / 4 minor · reviewed 2026-08-07 · deepseek-v4-flash

Pith's one-line read Linear probes of truthfulness do not transfer across tasks because each task has its own nearly orthogonal direction.

desk verdict Negative transfer result is solid; the 'orthogonal geometries' explanation needs a noise-floor control before it carries the weight the title gives it. read the letter →

arxiv 2506.08572 v2 pith:WYJCJTC2 submitted 2025-06-10 cs.LG cs.AIcs.CLstat.ML

classification cs.LGcs.AIcs.CLstat.ML
keywords linearprobingtruthfulnessLLMhiddenstatescross-taskgeneralizationorthogonaldirectionssparseprobesuncertaintyquantificationconformalprediction
verification ladder T0 review T1 audit T2 compute T3 formal

The pith

A machine-rendered reading of the paper's core claim, the machinery that carries it, and where it could break.

The reading

This paper argues that the 'geometry of truth'—the linear direction in an LLM's hidden states that separates correct from incorrect answers—is not a single universal structure. Across seven datasets and three models, probes trained on one task barely transfer to another: the weight vectors are nearly orthogonal and their sparse supports are almost disjoint. The paper concludes that LLMs contain multiple, task-dependent truthfulness geometries, so no probe learned on other tasks can reliably detect correctness on a new task. That matters because such probes are promoted as cheap, general-purpose uncertainty estimators.

What carries the argument

The argument is carried by linear logistic-regression probes trained on the final-token hidden states of an LLM, compared through cosine similarity of their weight vectors and through support overlap of L1-regularized sparse probes. A constrained optimization that restricts a target probe to the linear span of probes from other tasks quantifies whether target directions can be recovered from other tasks. The paper also uses t-SNE visualizations to show that different tasks form distinct clusters in hidden space, with the correct-versus-incorrect distinction secondary to task boundaries, and tests conformal prediction as a conservative deployment strategy.

What would settle it

Train the same probes on the same seven datasets but canonicalize each weight vector to unit norm (or fix the decision boundary scale via Platt scaling) before computing cosine similarities; if typical pairwise cosines rise above 0.5, the near-orthogonality reported in the paper is an artifact of probe scaling rather than a property of the model's geometry.

Watch

Extended reading notes

Core claim

The central discovery is that truthfulness directions in LLM hidden states are largely orthogonal across tasks, and this orthogonality explains why linear probes fail to generalize. The paper shows that probes trained on different tasks share little cosine similarity, that L1-regularized sparse probes have nearly disjoint dimension supports, and that even training on task mixtures or using mixture-of-probes architectures cannot recover a usable direction for a held-out task. In particular, the optimal direction for a target task lies outside the linear span of directions learned on other tasks. The authors conclude that LLMs likely have multiple geometries of truth that are irreconcilable and highly task-dependent.

Load-bearing premise

The whole argument depends on measuring probe similarity with cosine similarity, yet logistic-regression probes are only determined up to a positive rescaling; if that scaling, rather than the model's geometry, is causing the low cosine values, the paper's central conclusion fails.

Editorial extensions

If this is right

  • A probe trained on one question-answering dataset should not be trusted to detect hallucinations on a different domain; its direction only fits tasks whose geometry it shares.
  • Multi-task training, parameter summation, and mixture-of-probes architectures do not recover a universal truthfulness direction, so complexity alone will not fix the transfer failure.
  • Transfer works only between semantically similar tasks, so practitioners need a task-similarity map before reusing a probe.
  • Conformal prediction can cap the false-positive rate in cross-task settings, but only by setting thresholds so conservative that recall drops dramatically.
  • Sparse probes provide an interpretable diagnostic: the near-disjoint supports show which hidden dimensions each task's truth signal actually uses.

Reading between the lines

Editorial extensions of the paper, not claims the author makes directly.

  • If these geometries are genuinely task-specific, then inference-time steering methods that nudge generations toward truth may only steer within the task they were trained on, and may need task-conditioned directions to work elsewhere.
  • The same probe-comparison methodology could be applied to other binary properties of LLM outputs, such as toxicity or reasoning correctness, to test whether task-specific orthogonal encoding is a general property of hidden states.
  • A testable prediction follows: augmenting a probe with task identity as an input feature should recover a large share of the cross-task performance gap if the orthogonality is driven by task clusters, and should fail to do so if the gap has another cause.
  • The near-disjoint supports suggest that dimensions in the hidden space are functionally allocated per task, raising the question of whether a shared low-dimensional truth subspace exists but is rotated by task-specific transformations.
Share X Bluesky LinkedIn Reddit HN

Editorial analysis

A structured set of objections, weighed in public.

Desk editor's note, referee report, and a circularity audit.

Referee Report

3 major / 4 minor

Summary. The paper studies whether linear 'geometry of truth' probes for LLM answer correctness generalize across tasks. Using Qwen 2.5 7B, Phi-4 Mini, and Llama 3.1 8B and seven QA/math datasets, it reports that probes trained on one task drop in AUROC on other tasks; that L2 probe weight vectors have low cosine similarity; that L1-regularized probes have nearly disjoint supports; and that hidden states cluster by task in t-SNE plots. It further shows that training on mixtures of tasks, summing probe parameters, and a 16-expert mixture-of-probes architecture do not recover task-specific probe performance, and evaluates conformal prediction as a conservative deployment alternative. The paper concludes that LLMs have multiple task-dependent, mutually orthogonal truthfulness geometries.

Significance. The empirical mapping of cross-task transfer failures across three model families, multiple layers and token positions, and seven datasets is a valuable contribution; five-run averages and the extensive appendix make the non-transfer result credible. If the paper were to establish the proposed noise-floor controls, the orthogonality mechanism would be an important qualification to the universal 'geometry of truth' literature. As it stands, the robustly supported claim is that linear probes do not transfer; the geometric explanation (orthogonality of task-specific truth subspaces) is plausible but not yet separated from estimator noise. The conformal-prediction comparison is a useful practical addition.

major comments (3)
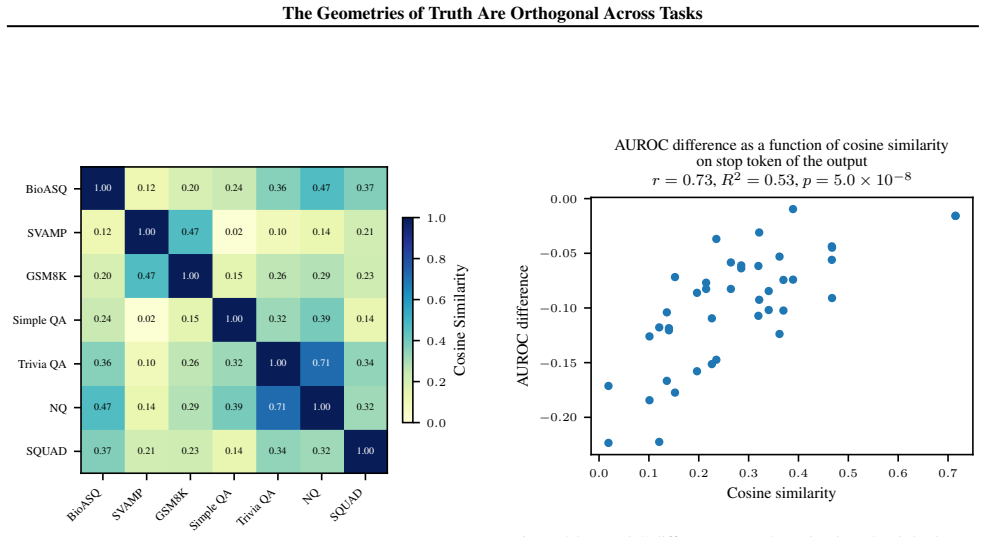
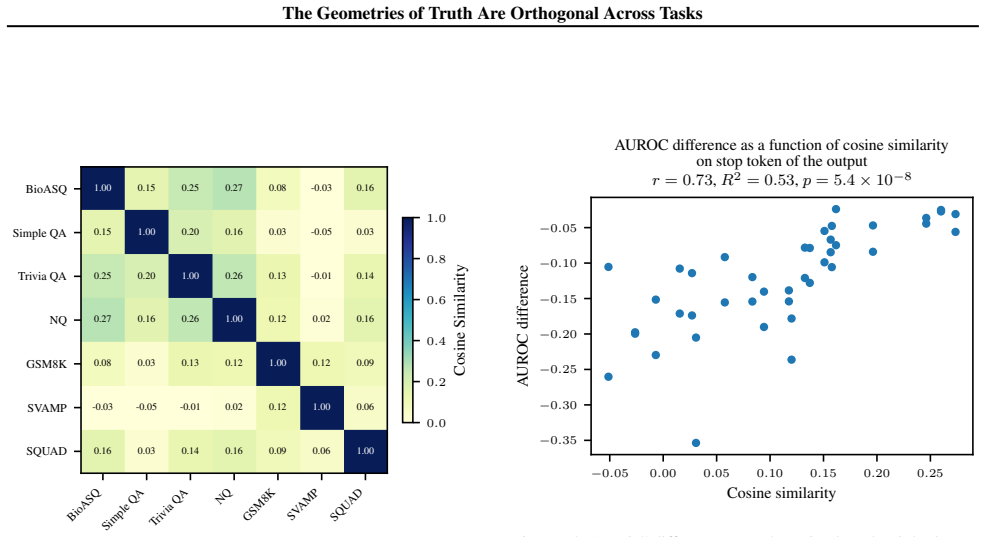
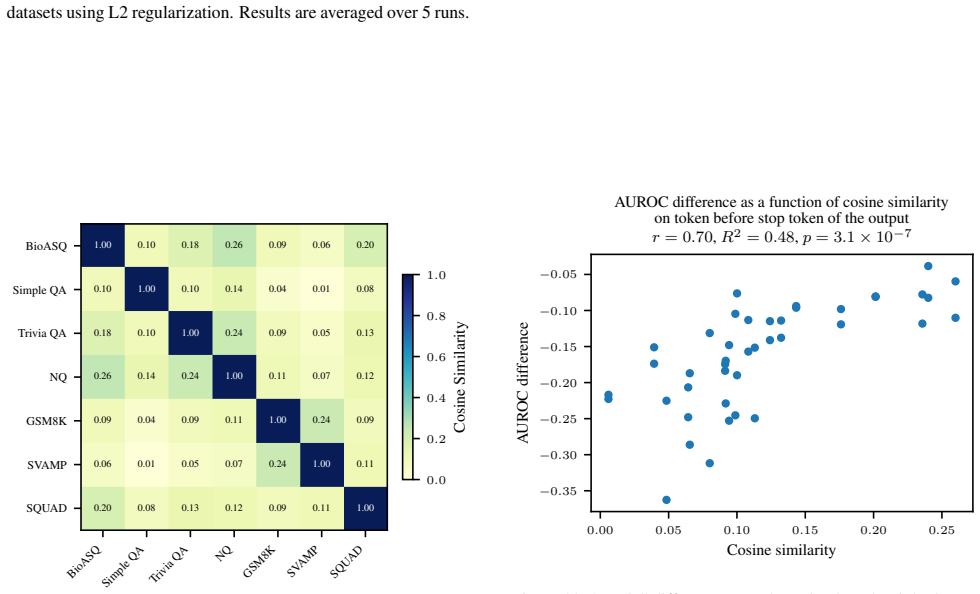
  1. [Section 3, 'Underlying geometry'] The central geometric evidence in Figures 2 and 6 is the low cosine similarity and low support overlap between probes trained on different tasks, compared against the diagonal value of 1. The paper explicitly claims that these patterns reflect 'fundamental differences ... rather than mere statistical artifacts of limited training data,' but no same-task noise floor is reported. In d=3584 with L1-regularized probes, both cosine similarity and support overlap can be driven down by finite-sample estimation noise, by the sparsity of the supports, or by label noise. Please report (a) cosine similarity and support overlap between probes trained on independent subsamples of the same task, and (b) the same quantities for probes trained on shuffled labels. If these control values are comparable to the observed cross-task values in Figures 2 and 6, the orthogonality conclusion is not supported.
  2. [Section 4.1, constrained-span test] The span test is interpreted as showing that 'target task directions lie outside the subspace generated by directions of the other tasks,' but the span is generated by six individually noisy probe vectors. Underperformance of the constrained fit only shows that the target direction is not well approximated by these six vectors; it does not establish that the target direction lies outside a task-specific truth subspace. Add a control in which the target probe is reconstructed from six same-task re-estimates, or in which the span test is run with same-task repeat probes, to calibrate how much of the constrained-fit gap is attributable to estimator instability rather than to geometric orthogonality.
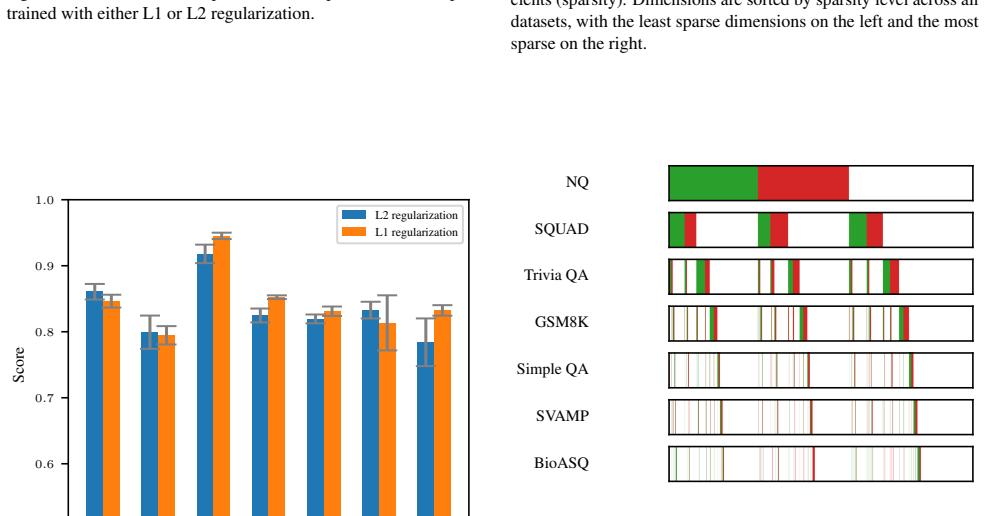
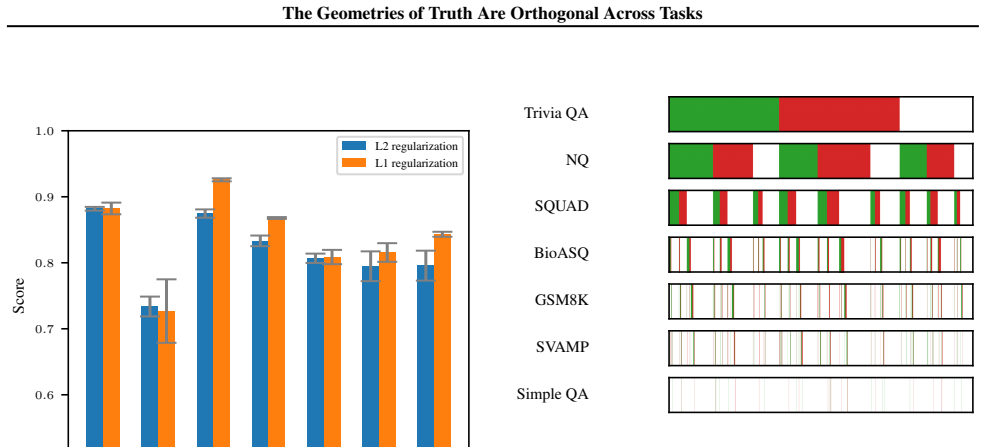
  3. [Section 3, 'Sparse probes'] The claim that probe supports are 'nearly disjoint' is not yet evidence for orthogonality. For high-dimensional sparse vectors, two support sets chosen independently at random will have very low overlap simply because the ambient dimension is large relative to the support sizes. The paper reports support overlap percentages but does not report support sizes or an expected-overlap value under a null model with the same sparsity levels. Please provide a random-support or same-task-repeat baseline for Figure 6 so that the observed 4-15% overlaps can be judged against a meaningful null.
minor comments (4)
  1. [Section 2] There are several typos and formatting issues: 'a mixture of tasks night help' should be 'might help'; 'there are paper that report' should be 'there are papers that report'; and the reference 'V ovk et al.' contains an unintended space.
  2. [Figure 3 and related scatter plots] The reported p-values for the cosine-similarity/AUROC-difference correlation treat the 21 task pairs as independent, but the pairs share tasks and are not independent. Please report a cluster- or permutation-based significance estimate, or present the correlation as purely descriptive.
  3. [Title and abstract] The word 'orthogonal' is stronger than the measurements support: most cosine similarities in Figure 2 are in the 0.2-0.5 range rather than near zero. Consider using 'near-orthogonal' or 'low-similarity' throughout, or justify the 0.5 threshold used to define near-orthogonality.
  4. [Figures 7, 26, and similar t-SNE plots] The axis labeled 'Datasets' is unclear; t-SNE axes should be described or removed, and the color/legend mapping between dataset names and the 'Prediction right/wrong' panels should be clarified.

Circularity Check

0 steps flagged · score 0.0 of 10

No significant circularity: the cross-task orthogonality is measured from fitted probes and public benchmarks, not derived from the paper's conclusions.

full rationale

The paper's central claims are empirical measurements on fitted probes. Section 3 computes cosine similarities between L2-regularized logistic-regression weight vectors (Eq. 1) and support overlap between L1-regularized sparse probes (Eq. 2); these are descriptive statistics of the fitted objects, not quantities that are presupposed by the conclusion that truthfulness directions are task-specific. Section 4.1's constrained-span experiment refits an L2-regularized logistic loss over coefficients alpha in the span of the other probes; the suboptimality of that constrained fit relative to unconstrained task-specific training is an experimental finding, not an identity. No fitted parameter is renamed as a prediction, and no equation reduces the output to the input. The paper's self-citations (Xiong et al. 2024 and Santilli et al. 2025, both including author Kirchhof) appear only as background on linear-probe practice and LLM-as-a-judge labeling; they are not load-bearing for the orthogonality claim, and no uniqueness theorem or ansatz is imported from them. The absence of a same-task noise floor is a legitimate validity concern for the mechanistic interpretation of low cosine similarity, but it does not make any step circular. Overall, the derivation chain is self-contained with respect to the experimental setup, so the circularity score is 0.

Assumptions & free parameters 4 free parameters · 4 assumptions · 0 invented entities

The paper contributes measurements, not a derivation. Its observable quantities: probe directions, support overlap, and transfer AUROC, all depend on the regularization hyperparameters above and on the judge-generated labels. No new entities are postulated; the geometry-of-truth phrase is inherited from Marks and Tegmark (2024), and Meta-CP is imported from Park et al. (2022).

free parameters (4)
  • L1 regularization strength for sparse probes = tuned per task on a held-out validation set
    Support overlap and sparse-probe supports in Figures 5 and 6 depend on this choice; the paper does not give the selected values.
  • L2 regularization strength for dense probes = tuned per task via cross-validation
    Probe weight norms and therefore cosine similarities in Figure 2 depend on this choice.
  • Mixture-of-probes hyperparameters (learning rate, weight decay, auxiliary loss coefficient, number of experts) = grid-searched on validation, with an oracle setting
    Only the negative conclusion, that the mixture fails, is robust to these choices; exact values are not reported.
  • Conformal threshold alpha = 0.3
    Target false-positive rate chosen by the authors for the deployment experiment; a policy choice rather than a fitted quantity.
assumptions (4)
  • domain assumption LLM-as-a-judge annotations correctly label generated answers as right or wrong.
    Used in Section 2 to build the training labels D; if judge labels are noisy or biased by answer length, probe geometry would inherit that bias.
  • domain assumption Cosine similarity between L2-regularized probe weight vectors measures geometric alignment of truthfulness directions.
    Invoked in Section 3, Figure 2; scale-invariance of logistic regression is not discussed.
  • domain assumption The final-token hidden state at the chosen layer is a sufficient representation for answer correctness.
    All probes are trained on h_{T,l*} only; other layers and tokens are checked only in appendices.
  • domain assumption t-SNE cluster separation reflects genuine task structure rather than projection artifacts.
    Used in Figure 7 to argue that task boundaries dominate the right/wrong distinction; t-SNE is nonlinear and can create spurious clusters.

how reviews work

0 comments
Cite this review

Pith. "Pith review of The Geometries of Truth Are Orthogonal Across Tasks." pith.science (2026). https://pith.science/paper/WYJCJTC2

@misc{pith2026250608572,
  author       = {Pith},
  title        = {Pith review of: The Geometries of Truth Are Orthogonal Across Tasks},
  year         = {2026},
  howpublished = {\url{https://pith.science/paper/WYJCJTC2}},
  note         = {Machine review of arXiv:2506.08572}
}
read the original abstract

Large Language Models (LLMs) have demonstrated impressive generalization capabilities across various tasks, but their claim to practical relevance is still mired by concerns on their reliability. Recent works have proposed examining the activations produced by an LLM at inference time to assess whether its answer to a question is correct. Some works claim that a "geometry of truth" can be learned from examples, in the sense that the activations that generate correct answers can be distinguished from those leading to mistakes with a linear classifier. In this work, we underline a limitation of these approaches: we observe that these "geometries of truth" are intrinsically task-dependent and fail to transfer across tasks. More precisely, we show that linear classifiers trained across distinct tasks share little similarity and, when trained with sparsity-enforcing regularizers, have almost disjoint supports. We show that more sophisticated approaches (e.g., using mixtures of probes and tasks) fail to overcome this limitation, likely because activation vectors commonly used to classify answers form clearly separated clusters when examined across tasks.

Figures

Figures reproduced from arXiv: 2506.08572 by the authors.

Figure 1
Figure 1. AUROC of probes trained on different tasks on the stop token of the output on last layer. Rows correspond to evaluation tasks while columns correspond to training tasks. The second plot represents the difference between the probe trained on this task and probes trained on the other datasets. Results are averaged over 5 runs. rather emerge from task-specific representations within the model’s hidden states. To visual… view at source ↗
Figure 4
Figure 4. AUROC of linear probes with L1 or L2 regularisation. Results are averaged over 5 runs. Trivia QA NQ SQUAD GSM8K BioASQ SVAMP Simple QA [PITH_FULL_IMAGE:figures/full_fig_p005_4.png] view at source ↗
Figure 5
Figure 5. Signed support of sparse probes trained on different datasets at the stop token of the output, using L1 regularization at layer 28. Each row represents one probe trained on the correspond￾ing dataset (y-axis labels). The x-axis shows the 3584 dimensions of the hidden state vector. Green indicates positive coefficients, red indicates negative coefficients, and white indicates zero coeffi￾cients (sparsity). Dimensions… view at source ↗
Figures from the paper (72 more)
Figure 6
Figure 6. Figure 6: Support overlap between sparse probes trained on differ￾ent datasets. Darker colors indicate higher overlap percentages. Task pairs with > 30% overlap (TriviaQA, NQ) correspond to suc￾cessful cross-task generalization, while most pairs show < 15% overlap, explaining ge…
Figure 7
Figure 7. Figure 7: t-SNE plots of the hidden space at layer 28 at the stop token of the output. Different tasks form distinct clusters in rep￾resentation space, with the correct/incorrect distinction being sec￾ondary to task boundaries. task. Despite this diverse training mixture, we obs…
Figure 8
Figure 8. Figure 8: AUROC of linear probes at the stop token of the output in the multi-task setting, using L2 regularization. In both cases, performance remains below that of linear probes trained directly on the target task. Moreover, the performance of this non-linear model matches tha…
Figure 9
Figure 9. Figure 9: AUROC of different methods in the multi-task setting. Mixture of probes are trained on six non-target tasks and evaluated on the target task. ”Validation” uses hyperparameters selected on a validation set from the training tasks; ”Test” uses hyperparameters selected on…
Figure 10
Figure 10. Figure 10: False positive rates (FPR) and recall for thresholds tuned using different methods: standard training (Plain), split conformal prediction (CP), conformal prediction for multi-task settings (Meta-CP). The results are averaged over 5 repetitions and test tasks. Method M…
Figure 11
Figure 11. Figure 11: False positive rates (FPR) and recall for thresholds tuned using different methods: standard training (Plain), split conformal prediction (CP), conformal prediction for multi-task settings (Meta-CP). The results are averaged over 5 repetitions and means and 80% quanti…
Figure 13
Figure 13. Figure 13: AUROC of probes trained on different tasks on the token before the stop token of the output on last layer. Rows cor￾respond to evaluation tasks while columns correspond to training tasks. The second plot represents the difference between the probe trained on this task…
Figure 16
Figure 16. Figure 16: AUROC difference to probe trained on the right dataset as a function of cosine similarity between probes. Results are averaged over 5 runs. 0.1 0.2 0.3 0.4 Cosine similarity −0.30 −0.25 −0.20 −0.15 −0.10 −0.05 AUROC difference AUROC difference as a function of cosine …
Figure 17
Figure 17. Figure 17: AUROC difference to probe trained on the right dataset as a function of cosine similarity between probes. Results are averaged over 5 runs. 12 [PITH_FULL_IMAGE:figures/full_fig_p012_17.png]
Figure 20
Figure 20. Figure 20: Signed support of sparse probes trained on different datasets at the stop token of the output, using L1 regularization at layer 28. Each row represents one probe trained on the correspond￾ing dataset (y-axis labels). The x-axis shows the 3584 dimensions of the hidden …
Figure 21
Figure 21. Figure 21: Signed support of sparse probes trained on different datasets at the token before the stop token of the output, using L1 regularization at layer 28. Each row represents one probe trained on the corresponding dataset (y-axis labels). The x-axis shows the 3584 dimension…
Figure 24
Figure 24. Figure 24: AUROC of probes trained using L1 regularisation as a function of the sparsity level on the stop token of the output. 0.0 0.2 0.4 0.6 0.8 1.0 Sparsity 0.5 0.6 0.7 0.8 0.9 Score BioASQ Simple QA Trivia QA NQ GSM8K SVAMP SQUAD [PITH_FULL_IMAGE:figures/full_fig_p014_24.png]
Figure 25
Figure 25. Figure 25: AUROC of probes trained using L1 regularisation as a function of the sparsity level on the token before the stop token of the output. 14 [PITH_FULL_IMAGE:figures/full_fig_p014_25.png]
Figure 26
Figure 26. Figure 26: t-SNE plots of the hidden space at layer 28 at the stop token of the output. 100 75 50 25 0 25 50 75 100 Datasets BioASQ SVAMP GSM8K Simple QA Trivia QA NQ SQUAD Prediction right wrong [PITH_FULL_IMAGE:figures/full_fig_p015_26.png]
Figure 27
Figure 27. Figure 27: t-SNE plots of the hidden space at layer 28 at the token before stop token of the output. 15 [PITH_FULL_IMAGE:figures/full_fig_p015_27.png]
Figure 28
Figure 28. Figure 28: AUROC of linear probes at the stop token of the output in the multi-task setting, using L2 regularization. BioASQ SVAMP GSM8K Simple QA Trivia QA NQ SQUAD 0.5 0.6 0.7 0.8 0.9 1.0 Score Sum of all probes Trained on all other datasets Mixture of probes of other datasets…
Figure 29
Figure 29. Figure 29: AUROC of linear probes at the token before the stop token of the output in the multi-task setting, using L2 regularization. 16 [PITH_FULL_IMAGE:figures/full_fig_p016_29.png]
Figure 31
Figure 31. Figure 31: AUROC of probes trained on different tasks on the token before the stop token of the output on last layer. Rows cor￾respond to evaluation tasks while columns correspond to training tasks. The second plot represents the difference between the probe trained on this task…
Figure 34
Figure 34. Figure 34: AUROC difference to probe trained on the right dataset as a function of cosine similarity between probes. Results are averaged over 5 runs. 0.00 0.05 0.10 0.15 0.20 0.25 0.30 0.35 Cosine similarity −0.25 −0.20 −0.15 −0.10 −0.05 AUROC difference AUROC difference as a f…
Figure 35
Figure 35. Figure 35: AUROC difference to probe trained on the right dataset as a function of cosine similarity between probes. Results are averaged over 5 runs. 18 [PITH_FULL_IMAGE:figures/full_fig_p018_35.png]
Figure 38
Figure 38. Figure 38: Signed support of sparse probes trained on different datasets at the stop token of the output, using L1 regularization at layer 21. Each row represents one probe trained on the correspond￾ing dataset (y-axis labels). The x-axis shows the 3584 dimensions of the hidden …
Figure 39
Figure 39. Figure 39: Signed support of sparse probes trained on different datasets at the token before the stop token of the output, using L1 regularization at layer 21. Each row represents one probe trained on the corresponding dataset (y-axis labels). The x-axis shows the 3584 dimension…
Figure 42
Figure 42. Figure 42: AUROC of probes trained using L1 regularisation as a function of the sparsity level on the stop token of the output. 0.0 0.2 0.4 0.6 0.8 1.0 Sparsity 0.5 0.6 0.7 0.8 0.9 Score BioASQ Simple QA Trivia QA NQ GSM8K SVAMP SQUAD [PITH_FULL_IMAGE:figures/full_fig_p020_42.png]
Figure 43
Figure 43. Figure 43: AUROC of probes trained using L1 regularisation as a function of the sparsity level on the token before the stop token of the output. 20 [PITH_FULL_IMAGE:figures/full_fig_p020_43.png]
Figure 44
Figure 44. Figure 44: t-SNE plots of the hidden space at layer 21 at the stop token of the output. 100 75 50 25 0 25 50 75 Datasets BioASQ SVAMP GSM8K Simple QA Trivia QA NQ SQUAD Prediction right wrong [PITH_FULL_IMAGE:figures/full_fig_p021_44.png]
Figure 45
Figure 45. Figure 45: t-SNE plots of the hidden space at layer 21 at the token before stop token of the output. 21 [PITH_FULL_IMAGE:figures/full_fig_p021_45.png]
Figure 46
Figure 46. Figure 46: AUROC of linear probes at the stop token of the output in the multi-task setting, using L2 regularization. BioASQ SVAMP GSM8K Simple QA Trivia QA NQ SQUAD 0.5 0.6 0.7 0.8 0.9 1.0 Score Trained on all other datasets Mixture of probes of other datasets Sum of all probes…
Figure 47
Figure 47. Figure 47: AUROC of linear probes at the token before the stop token of the output in the multi-task setting, using L2 regularization. 22 [PITH_FULL_IMAGE:figures/full_fig_p022_47.png]
Figure 49
Figure 49. Figure 49: AUROC of probes trained on different tasks on the token before the stop token of the output on last layer. Rows cor￾respond to evaluation tasks while columns correspond to training tasks. The second plot represents the difference between the probe trained on this task…
Figure 52
Figure 52. Figure 52: AUROC difference to probe trained on the right dataset as a function of cosine similarity between probes. Results are averaged over 5 runs. 0.05 0.10 0.15 0.20 0.25 Cosine similarity −0.20 −0.15 −0.10 −0.05 AUROC difference AUROC difference as a function of cosine sim…
Figure 53
Figure 53. Figure 53: AUROC difference to probe trained on the right dataset as a function of cosine similarity between probes. Results are averaged over 5 runs. 24 [PITH_FULL_IMAGE:figures/full_fig_p024_53.png]
Figure 56
Figure 56. Figure 56: Signed support of sparse probes trained on different datasets at the stop token of the output, using L1 regularization at layer 32. Each row represents one probe trained on the correspond￾ing dataset (y-axis labels). The x-axis shows the 3584 dimensions of the hidden …
Figure 57
Figure 57. Figure 57: Signed support of sparse probes trained on different datasets at the token before the stop token of the output, using L1 regularization at layer 32. Each row represents one probe trained on the corresponding dataset (y-axis labels). The x-axis shows the 3584 dimension…
Figure 60
Figure 60. Figure 60: AUROC of probes trained using L1 regularisation as a function of the sparsity level on the stop token of the output. 0.0 0.2 0.4 0.6 0.8 1.0 Sparsity 0.5 0.6 0.7 0.8 0.9 Score BioASQ Simple QA Trivia QA NQ GSM8K SVAMP SQUAD [PITH_FULL_IMAGE:figures/full_fig_p026_60.png]
Figure 61
Figure 61. Figure 61: AUROC of probes trained using L1 regularisation as a function of the sparsity level on the token before the stop token of the output. 26 [PITH_FULL_IMAGE:figures/full_fig_p026_61.png]
Figure 62
Figure 62. Figure 62: t-SNE plots of the hidden space at layer 32 at the stop token of the output. 100 75 50 25 0 25 50 75 Datasets BioASQ Simple QA Trivia QA NQ GSM8K SVAMP SQUAD Prediction right wrong [PITH_FULL_IMAGE:figures/full_fig_p027_62.png]
Figure 63
Figure 63. Figure 63: t-SNE plots of the hidden space at layer 32 at the token before stop token of the output. 27 [PITH_FULL_IMAGE:figures/full_fig_p027_63.png]
Figure 64
Figure 64. Figure 64: AUROC of linear probes at the stop token of the output in the multi-task setting, using L2 regularization. BioASQ Simple QA Trivia QA NQ GSM8K SVAMP SQUAD 0.5 0.6 0.7 0.8 0.9 1.0 Score Trained on all datasets Trained on all other datasets Mixture of probes of other da…
Figure 65
Figure 65. Figure 65: AUROC of linear probes at the token before the stop token of the output in the multi-task setting, using L2 regularization. 28 [PITH_FULL_IMAGE:figures/full_fig_p028_65.png]
Figure 67
Figure 67. Figure 67: AUROC of probes trained on different tasks on the token before the stop token of the output on last layer. Rows cor￾respond to evaluation tasks while columns correspond to training tasks. The second plot represents the difference between the probe trained on this task…
Figure 70
Figure 70. Figure 70: AUROC difference to probe trained on the right dataset as a function of cosine similarity between probes. Results are averaged over 5 runs. 0.05 0.10 0.15 0.20 0.25 0.30 Cosine similarity −0.25 −0.20 −0.15 −0.10 −0.05 0.00 AUROC difference AUROC difference as a functi…
Figure 71
Figure 71. Figure 71: AUROC difference to probe trained on the right dataset as a function of cosine similarity between probes. Results are averaged over 5 runs. 30 [PITH_FULL_IMAGE:figures/full_fig_p030_71.png]
Figure 74
Figure 74. Figure 74: Signed support of sparse probes trained on different datasets at the stop token of the output, using L1 regularization at layer 24. Each row represents one probe trained on the correspond￾ing dataset (y-axis labels). The x-axis shows the 3584 dimensions of the hidden …
Figure 75
Figure 75. Figure 75: Signed support of sparse probes trained on different datasets at the token before the stop token of the output, using L1 regularization at layer 24. Each row represents one probe trained on the corresponding dataset (y-axis labels). The x-axis shows the 3584 dimension…
Figure 78
Figure 78. Figure 78: AUROC of probes trained using L1 regularisation as a function of the sparsity level on the stop token of the output. 0.0 0.2 0.4 0.6 0.8 1.0 Sparsity 0.5 0.6 0.7 0.8 0.9 Score BioASQ Simple QA Trivia QA NQ GSM8K SVAMP SQUAD [PITH_FULL_IMAGE:figures/full_fig_p032_78.png]
Figure 79
Figure 79. Figure 79: AUROC of probes trained using L1 regularisation as a function of the sparsity level on the token before the stop token of the output. 32 [PITH_FULL_IMAGE:figures/full_fig_p032_79.png]
Figure 80
Figure 80. Figure 80: t-SNE plots of the hidden space at layer 24 at the stop token of the output. 100 75 50 25 0 25 50 75 100 Datasets BioASQ Simple QA Trivia QA NQ GSM8K SVAMP SQUAD Prediction right wrong [PITH_FULL_IMAGE:figures/full_fig_p033_80.png]
Figure 81
Figure 81. Figure 81: t-SNE plots of the hidden space at layer 24 at the token before stop token of the output. 33 [PITH_FULL_IMAGE:figures/full_fig_p033_81.png]
Figure 82
Figure 82. Figure 82: AUROC of linear probes at the stop token of the output in the multi-task setting, using L2 regularization. BioASQ Simple QA Trivia QA NQ GSM8K SVAMP SQUAD 0.5 0.6 0.7 0.8 0.9 1.0 Score Trained on all datasets Trained on all other datasets Sum of all probes Mixture of …
Figure 83
Figure 83. Figure 83: AUROC of linear probes at the token before the stop token of the output in the multi-task setting, using L2 regularization. 34 [PITH_FULL_IMAGE:figures/full_fig_p034_83.png]
Figure 85
Figure 85. Figure 85: AUROC of probes trained on different tasks on the token before the stop token of the output on last layer. Rows cor￾respond to evaluation tasks while columns correspond to training tasks. The second plot represents the difference between the probe trained on this task…
Figure 88
Figure 88. Figure 88: AUROC difference to probe trained on the right dataset as a function of cosine similarity between probes. Results are averaged over 5 runs. 0.00 0.05 0.10 0.15 0.20 0.25 Cosine similarity −0.35 −0.30 −0.25 −0.20 −0.15 −0.10 −0.05 AUROC difference AUROC difference as a…
Figure 89
Figure 89. Figure 89: AUROC difference to probe trained on the right dataset as a function of cosine similarity between probes. Results are averaged over 5 runs. 36 [PITH_FULL_IMAGE:figures/full_fig_p036_89.png]
Figure 92
Figure 92. Figure 92: Signed support of sparse probes trained on different datasets at the stop token of the output, using L1 regularization at layer 32. Each row represents one probe trained on the correspond￾ing dataset (y-axis labels). The x-axis shows the 3584 dimensions of the hidden …
Figure 93
Figure 93. Figure 93: Signed support of sparse probes trained on different datasets at the token before the stop token of the output, using L1 regularization at layer 32. Each row represents one probe trained on the corresponding dataset (y-axis labels). The x-axis shows the 3584 dimension…
Figure 96
Figure 96. Figure 96: AUROC of probes trained using L1 regularisation as a function of the sparsity level on the stop token of the output. 0.0 0.2 0.4 0.6 0.8 1.0 Sparsity 0.5 0.6 0.7 0.8 0.9 Score BioASQ Simple QA Trivia QA NQ GSM8K SVAMP SQUAD [PITH_FULL_IMAGE:figures/full_fig_p038_96.png]
Figure 97
Figure 97. Figure 97: AUROC of probes trained using L1 regularisation as a function of the sparsity level on the token before the stop token of the output. 38 [PITH_FULL_IMAGE:figures/full_fig_p038_97.png]
Figure 98
Figure 98. Figure 98: t-SNE plots of the hidden space at layer 32 at the stop token of the output. 100 75 50 25 0 25 50 75 100 Datasets BioASQ Simple QA Trivia QA NQ GSM8K SVAMP SQUAD Prediction right wrong [PITH_FULL_IMAGE:figures/full_fig_p039_98.png]
Figure 99
Figure 99. Figure 99: t-SNE plots of the hidden space at layer 32 at the token before stop token of the output. 39 [PITH_FULL_IMAGE:figures/full_fig_p039_99.png]
Figure 100
Figure 100. Figure 100: AUROC of linear probes at the stop token of the output in the multi-task setting, using L2 regularization. BioASQ Simple QA Trivia QA NQ GSM8K SVAMP SQUAD 0.5 0.6 0.7 0.8 0.9 1.0 Score Trained on all other datasets Mixture of probes of other datasets Sum of all probe…
Figure 101
Figure 101. Figure 101: AUROC of linear probes at the token before the stop token of the output in the multi-task setting, using L2 regularization. 40 [PITH_FULL_IMAGE:figures/full_fig_p040_101.png]
Figure 103
Figure 103. Figure 103: AUROC of probes trained on different tasks on the token before the stop token of the output on last layer. Rows cor￾respond to evaluation tasks while columns correspond to training tasks. The second plot represents the difference between the probe trained on this tas…
Figure 106
Figure 106. Figure 106: AUROC difference to probe trained on the right dataset as a function of cosine similarity between probes. Results are averaged over 5 runs. 0.05 0.10 0.15 0.20 0.25 0.30 Cosine similarity −0.35 −0.30 −0.25 −0.20 −0.15 −0.10 −0.05 AUROC difference AUROC difference as …
Figure 107
Figure 107. Figure 107: AUROC difference to probe trained on the right dataset as a function of cosine similarity between probes. Results are averaged over 5 runs. 42 [PITH_FULL_IMAGE:figures/full_fig_p042_107.png]
Figure 110
Figure 110. Figure 110: Signed support of sparse probes trained on different datasets at the stop token of the output, using L1 regularization at layer 24. Each row represents one probe trained on the correspond￾ing dataset (y-axis labels). The x-axis shows the 3584 dimensions of the hidden…
Figure 111
Figure 111. Figure 111: Signed support of sparse probes trained on different datasets at the token before the stop token of the output, using L1 regularization at layer 24. Each row represents one probe trained on the corresponding dataset (y-axis labels). The x-axis shows the 3584 dimensio…
Figure 114
Figure 114. Figure 114: AUROC of probes trained using L1 regularisation as a function of the sparsity level on the stop token of the output. 0.0 0.2 0.4 0.6 0.8 1.0 Sparsity 0.5 0.6 0.7 0.8 0.9 Score BioASQ Simple QA Trivia QA NQ GSM8K SVAMP SQUAD [PITH_FULL_IMAGE:figures/full_fig_p044_114.png]
Figure 115
Figure 115. Figure 115: AUROC of probes trained using L1 regularisation as a function of the sparsity level on the token before the stop token of the output. 44 [PITH_FULL_IMAGE:figures/full_fig_p044_115.png]
Figure 116
Figure 116. Figure 116: t-SNE plots of the hidden space at layer 24 at the stop token of the output. 100 75 50 25 0 25 50 75 100 Datasets BioASQ Simple QA Trivia QA NQ GSM8K SVAMP SQUAD Prediction right wrong [PITH_FULL_IMAGE:figures/full_fig_p045_116.png]
Figure 117
Figure 117. Figure 117: t-SNE plots of the hidden space at layer 24 at the token before stop token of the output. 45 [PITH_FULL_IMAGE:figures/full_fig_p045_117.png]
Figure 118
Figure 118. Figure 118: AUROC of linear probes at the stop token of the output in the multi-task setting, using L2 regularization. BioASQ Simple QA Trivia QA NQ GSM8K SVAMP SQUAD 0.5 0.6 0.7 0.8 0.9 1.0 Score Trained on all other datasets Sum of all probes Mixture of probes of other dataset…
Figure 119
Figure 119. Figure 119: AUROC of linear probes at the token before the stop token of the output in the multi-task setting, using L2 regularization. 46 [PITH_FULL_IMAGE:figures/full_fig_p046_119.png]

Discussion (0). Sign in to comment.

Reference graph

Works this paper leans on

20 extracted references · 9 canonical work pages

  1. [1]

    and Mitchell, T

    Azaria, A. and Mitchell, T. The internal state of an llm knows when it’s lying. In The 2023 Conference on Em- pirical Methods in Natural Language Processing ,

  2. [3]

    net/forum?id=ETKGuby0hcs

    URL https://openreview. net/forum?id=ETKGuby0hcs. Cobbe, K., Kosaraju, V ., Bavarian, M., Chen, M., Jun, H., Kaiser, L., Plappert, M., Tworek, J., Hilton, J., Nakano, R., Hesse, C., and Schulman, J. Training verifiers to solve math word problems. arXiv preprint arXiv:2110.14168,

  3. [6]

    Overview of BioASQ 2023: The eleventh BioASQ challenge on Large-Scale Biomedical Semantic Indexing and Question Answering

    URL https://openreview. net/forum?id=aajyHYjjsk. Nentidis, A., Katsimpras, G., Krithara, A., L ´opez, S. L., Farr´e-Maduell, E., Gasco, L., Krallinger, M., and Paliouras, G. Overview of bioasq 2023: The eleventh bioasq challenge on large-scale biomedical semantic in- dexing and question answering. arXiv preprint arXiv: 2307.05131,

  4. [11]

    Qwen2.5 technical report

    Qwen authors. Qwen2.5 technical report. arXiv preprint arXiv: 2412.15115,

  5. [12]

    Squad: 100,000+ questions for machine comprehension of text

    Rajpurkar, P., Zhang, J., Lopyrev, K., and Liang, P. Squad: 100,000+ questions for machine comprehension of text. In Proceedings of the 2016 Conference on Empirical Methods in Natural Language Processing , pp. 2383– 2392,

  6. [15]

    The curious case of hallucinatory (un) an- swerability: Finding truths in the hidden states of over- confident large language models

    Slobodkin, A., Goldman, O., Caciularu, A., Dagan, I., and Ravfogel, S. The curious case of hallucinatory (un) an- swerability: Finding truths in the hidden states of over- confident large language models. In Proceedings of the 2023 Conference on Empirical Methods in Natural Lan- guage Processing, pp. 3607–3625,

  7. [16]

    The llama 3 herd of models

    The Llama 3 authors. The llama 3 herd of models. arXiv preprint arXiv: 2407.21783,

  8. [18]

    48550/arXiv.2406.00034

    URL https://doi.org/10. 48550/arXiv.2406.00034. Wei, J., Karina, N., Chung, H. W., Jiao, Y . J., Papay, S., Glaese, A., Schulman, J., and Fedus, W. Measuring short- form factuality in large language models. arXiv preprint arXiv: 2411.04368,

Show all 20 references
  1. [19]

    Efficient and effective uncertainty quan- tification for LLMs

    Xiong, M., Santilli, A., Kirchhof, M., Golinski, A., and Williamson, S. Efficient and effective uncertainty quan- tification for LLMs. In Neurips Safe Generative AI Workshop 2024,

  2. [20]

    Zheng, L., Chiang, W.-L., Sheng, Y ., Zhuang, S., Wu, Z., Zhuang, Y ., Lin, Z., Li, Z., Li, D., Xing, E., et al

    URL https://arxiv.org/abs/2504.05419. Zheng, L., Chiang, W.-L., Sheng, Y ., Zhuang, S., Wu, Z., Zhuang, Y ., Lin, Z., Li, Z., Li, D., Xing, E., et al. Judging llm-as-a-judge with mt-bench and chatbot arena. Ad- vances in Neural Information Processing Systems , 36: 46595–46623,

  3. [168]

    naacl-main.168/

    URL https://aclanthology.org/2021. naacl-main.168/. Pedregosa, F., Varoquaux, G., Gramfort, A., Michel, V ., Thirion, B., Grisel, O., Blondel, M., Prettenhofer, P., Weiss, R., Dubourg, V ., Vanderplas, J., Passos, A., Cour- napeau, D., Brucher, M., Perrot, M., and Duchesnay, E...

  4. [2005]

    Adaptive activation steering: A tuning-free llm truthfulness improvement method for diverse hallucinations categories

    Wang, T., Jiao, X., He, Y ., Chen, Z., Zhu, Y ., Chu, X., Gao, J., Wang, Y ., and Ma, L. Adaptive activation steering: A tuning-free llm truthfulness improvement method for diverse hallucinations categories. CoRR, abs/2406.00034,

  5. [2011]

    Phi-4 technical report

    Phi-4 authors. Phi-4 technical report. arXiv preprint arXiv: 2412.08905,

  6. [2016]

    Revis- iting uncertainty quantification evaluation in language models: Spurious interactions with response length bias results

    Santilli, A., Golinski, A., Kirchhof, M., Danieli, F., Blaas, A., Xiong, M., Zappella, L., and Williamson, S. Revis- iting uncertainty quantification evaluation in language models: Spurious interactions with response length bias results. arXiv preprint arXiv:2504.13677,

  7. [2017]

    doi: 10.18653/v1/P17-1147

    Association for Computational Lin- guistics. doi: 10.18653/v1/P17-1147. URL https: //aclanthology.org/P17-1147/. Kadavath, S., Conerly, T., Askell, A., Henighan, T., Drain, D., Perez, E., Schiefer, N., Hatfield-Dodds, Z., DasSarma, N., Tran-Johnson, E., et al. Language models ...

  8. [2021]

    doi: 10.18653/v1/2021.naacl-main

    Association for Computa- tional Linguistics. doi: 10.18653/v1/2021.naacl-main

  9. [2022]

    Patel, A., Bhattamishra, S., and Goyal, N. Are NLP models really able to solve simple math word prob- lems? In Toutanova, K., Rumshisky, A., Zettlemoyer, L., Hakkani-Tur, D., Beltagy, I., Bethard, S., Cot- terell, R., Chakraborty, T., and Zhou, Y . (eds.), Pro- ceedings of the...

  10. [2023]

    Internalinspector i2: Robust confidence estimation in llms through internal states

    Beigi, M., Shen, Y ., Yang, R., Lin, Z., Wang, Q., Mohan, A., He, J., Jin, M., Lu, C.-T., and Huang, L. Internalinspector i2: Robust confidence estimation in llms through internal states. In Findings of the Association for Computational Linguistics: EMNLP 2024 , pp. 12847–12865,

  11. [2024]

    Switch transformers: Scaling to trillion parameter models with simple and effi- cient sparsity.(2021)

    Fedus, W., Zoph, B., and Shazeer, N. Switch transformers: Scaling to trillion parameter models with simple and effi- cient sparsity.(2021). arXiv preprint cs.LG/2101.03961,

  12. [2025]

    Do an- droids know they’re only dreaming of electric sheep? In Findings of the Association for Computational Linguistics ACL 2024, pp

    Sky, C.-W., Van Durme, B., Eisner, J., and Kedzie, C. Do an- droids know they’re only dreaming of electric sheep? In Findings of the Association for Computational Linguistics ACL 2024, pp. 4401–4420,

Pith tools

Reviewed August 7, 2026 · model on record in the stance chip above.