REVIEW 3 major objections 5 minor 35 references
Exploring Image Transforms derived from Eye Gaze Variables for Progressive Autism Diagnosis
T0 review · 3 major / 5 minor · reviewed 2026-08-07 · deepseek-v4-flash
Pith's one-line read Scan-path gaze images, particularly after a continuous wavelet transform, give the highest classification accuracy for autism versus typical development in this transfer-learning study.
desk verdict The 85% figure is a training accuracy, so the central diagnostic claim is unsupported as written, but the pilot comparison itself is a reasonable starting point. read the letter →
The pith
A machine-rendered reading of the paper's core claim, the machinery that carries it, and where it could break.
The reading
What carries the argument
The load-bearing object is the scan path converted into an image: an ordered sequence of fixations with coordinates and durations redrawn as a picture, which preserves temporal trajectory rather than averaged spatial density. This image is then transformed by the Continuous Wavelet Transform using a Haar mother wavelet, yielding a time-frequency representation that the network can use to separate ASD from TD gaze behavior. Transfer learning supplies the classifier: a pre-trained GoogleNet (and AlexNet for comparison) with its final layer replaced by a binary output, fine-tuned with cross-entropy loss and backpropagation.
What would settle it
Train the same GoogleNet pipeline on the same 600 gaze images but evaluate with leave-one-subject-out cross-validation, keeping all samples from a child out of training; if the CWT scan-path accuracy falls to near chance or well below 85%, the claim that these transforms enable autism classification is not supported. A quicker check is whether the reported confusion matrix and accuracy change when the 80/20 split is done by participant rather than by image.
Extended reading notes
Core claim
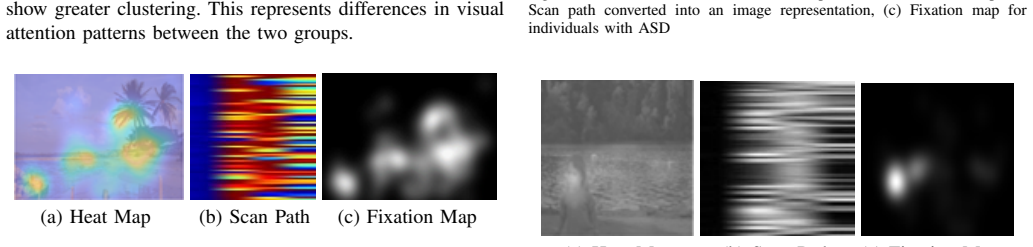
The paper's central claim is that among three gaze-derived input representations—heatmaps, scan paths, and fixation maps—scan paths carry the most discriminative signal for ASD versus TD classification, reaching 82.50% accuracy without transformation and 85.00% with the Continuous Wavelet Transform applied, using a fine-tuned GoogleNet. The paper attributes this to scan paths encoding the sequential spatial trajectory of gaze, which CWT enriches with time-frequency structure that highlights transient and localized patterns. Heatmaps, by contrast, perform poorly (40.83% untransformed), leading the authors to conclude that the spatial smoothing of heatmaps obscures autism-related gaze dynamics. The same ranking holds for AlexNet, where scan paths also give the best accuracy (81.20%), which the authors take as evidence that the input representation, not the specific network, drives the result.
Load-bearing premise
The results report training accuracies, so the central claim depends on the assumption that a model tuned to fit its training set will also perform well on new children's gaze data.
Editorial extensions
If this is right
- If the central claim holds, scan-path images alone—without raw video or facial data—could support automated ASD screening from a standard eye tracker.
- The CWT improvement suggests temporal-spectral preprocessing is worth pursuing for gaze-based screening, not just raw spatial inputs.
- The poor heatmap performance implies that smoothing gaze into density maps discards the sequential cues most tied to autism.
- The success with two different pre-trained networks argues the effect is tied to the input representation rather than one architecture.
- Image-transform preprocessing doubles as anonymization, so at-home screening could collect gaze data without storing identifiable video.
Reading between the lines
- Because the reported percentages are training accuracies from a split of 600 samples contributed by only 28 children, a reader should treat the 85% figure as an upper bound; a subject-level independent test could well be lower.
- A natural next experiment is leave-one-subject-out cross-validation, which would reveal whether the model generalizes to unseen children or memorizes per-subject artifacts.
- Comparing CWT scale choices and wavelet families could show whether the gain comes specifically from Haar wavelets or from any time-frequency transform.
- If validated on larger, more diverse populations, the scan-path-plus-CWT pipeline could be combined with clinical scores to produce a risk score rather than a binary label.
Editorial analysis
A structured set of objections, weighed in public.
Referee Report
Summary. The paper proposes a transfer-learning pipeline that classifies children with Autism Spectrum Disorder (ASD) versus typically developing (TD) children using image representations of eye-tracking data. Three input types are compared: heatmaps, scan paths, and fixation maps, each with and without Continuous Wavelet Transform (CWT) or Fast Fourier Transform (FFT) preprocessing. Using a dataset of 28 children (14 per group, 600 samples total) and two pretrained CNNs (GoogleNet and AlexNet), the authors report training accuracies in Table I, with scan paths plus CWT reaching 85.00% for GoogleNet. The paper concludes that scan paths, especially when CWT-transformed, are the most effective input representation for autism diagnosis.
Significance. If the reported accuracies were obtained on held-out, subject-independent test data, the approach would be a meaningful step toward accessible, privacy-preserving ASD screening. The systematic comparison of three gaze-derived image representations and two transforms is a useful contribution to the eye-tracking and computer-aided diagnosis literature. However, the current manuscript does not establish any generalization result: the headline figures are training accuracies, no test-set metrics are reported, and the sample size is very small. The paper is honest in labeling Table I as a training-results summary, but the subsequent analysis and conclusions treat those numbers as evidence of diagnostic performance, which is not justified.
major comments (3)
- [Section IV.A and Table I; Section V] The central performance claims are based solely on training accuracy. Table I is explicitly labeled 'Training Results Summary,' and Section IV.A states that these are training accuracies. Algorithm 1 step 6 says the model is evaluated on the test set, but no test-set accuracy, sensitivity, specificity, or confusion-matrix results for held-out data are reported anywhere. Consequently, the statements in Section V that scan paths 'achieving the highest accuracy of 82.50% without transformation and 85.00% when combined with CWT' are in-sample fit statistics, not estimates of diagnostic accuracy. This is load-bearing because the paper's conclusion that the method is promising for ASD diagnosis rests entirely on these numbers.
- [Section III.A (Experimental Setup)] The 80/20 train-test split is not described as subject-independent. With only 28 participants and 600 samples, there is a substantial risk that samples from the same child appear in both training and testing sets, which would inflate any held-out accuracy through within-subject correlation. The paper does not report a subject-level split, cross-validation, or any confidence intervals. Without this information, even the existence of a test-set evaluation would not support a generalization claim to new individuals.
- [Section III.A, reference [27]] The dataset is cited as reference [27], but [27] is the paper by Stanković and Falkowski on the Haar wavelet transform, not a Zenodo dataset. This citation error makes the data provenance unverifiable. The authors should provide the correct dataset identifier or a direct link so that readers can assess the data collection protocol and sample characteristics.
minor comments (5)
- [Section III.A, Eq. (1)] Equation (1) has a formatting issue: the summation subscript appears as 'NX' rather than a properly typeset 'N' over 'i=1'. This should be corrected.
- [Section II.A] The sentence 'Several studies also challenge these claims, arguing that autism is a behavioral disorder rather than a neurological condition' is vague and does not specify which claims are challenged or which studies are referenced; a more precise citation is needed.
- [Section IV.A and Fig. 7-8] The training and loss graph (Fig. 7) and the confusion matrix (Fig. 8) are not discussed in detail. The confusion matrix for the best configuration should be reported with class-wise performance, and the training curves should be interpreted in terms of overfitting or convergence.
- [Section III.D] The claim that 'AlexNet offers greater architectural flexibility than GoogleNet' is debatable and not elaborated; the comparison between the two architectures is not statistically characterized, as only single training runs are reported.
- [Section III.A] The text refers to '3D and phenotypic data' in the opening of Section III, but the experiment uses only 2D gaze-derived images. This phrase is misleading and should be clarified or removed.
Circularity Check
Headline accuracy is a training-set fit, not a held-out test-set prediction, so the central diagnostic claim is unsupported as stated.
-
fitted input called prediction
[Section IV.A (Table I) and Section V; Section III.A; Algorithm 1 step 6, Eq. (8)]
"Table I summarizes the results of training accuracies achieved when comparing the three inputs discussed in the previous section. ... scan paths have proven to be the most effective, achieving the highest accuracy of 82.50% without transformation and 85.00% when combined with the Continuous Wavelet Transform (CWT). Throughout the experiment, the dataset was split into 80% for training and 20% for testing to evaluate the model's performance."
The paper's own evaluation protocol defines accuracy on the test set (Algorithm 1 step 6, Eq. (8)), but Table I is explicitly labeled 'Training Results Summary' and the reported 82.50% and 85.00% figures are training accuracies. The model weights were fitted by backpropagation on that same 80% training split, so these accuracies measure in-sample fit, not predictive performance. The selection of scan paths and CWT as 'most effective' is a choice among these in-sample values, making the headline result a fitted quantity presented as a diagnostic prediction rather than a held-out evaluation.
full rationale
The central claim of the paper is the reported classification accuracy for ASD versus TD children. That claim rests on Table I, which is explicitly headed 'Training Results Summary' and described as 'training accuracies.' The paper never reports the test-set accuracy required by its own Algorithm 1 and Eq. (8), nor any subject-independent split, sensitivity, specificity, or confidence interval. Because the model parameters and the reported performance are both products of the same fitting procedure on the 80% training portion, the 85% figure is an in-sample estimate, not a prediction against unseen data. This is a fitted-input-called-prediction circularity: the conclusion reduces to a measure of fit rather than an independent benchmark. The few self-citations in the paper (e.g., [32] for CWT background) are not load-bearing, and there is no definitional equivalence or imported uniqueness theorem. The circularity is therefore concentrated in the evaluation step, but it is central: without a held-out test accuracy, the diagnostic claim is unsupported as written.
Assumptions & free parameters
free parameters (3)
- Training epochs per input type =
6 to 10 depending on input
- Gaussian spread sigma in heatmap generation =
not reported
- Optimizer and learning rate =
not reported
assumptions (4)
- domain assumption Gaze variables (reduced eye contact, atypical fixation) are reliable markers distinguishing ASD from TD children.
- domain assumption ImageNet-pretrained features transfer to small gaze-derived image inputs.
- domain assumption Samples are independent despite being drawn from only 28 children.
- standard math Standard definitions of CWT and FFT apply to the image inputs.
Cite this review
Pith. "Pith review of Exploring Image Transforms derived from Eye Gaze Variables for Progressive Autism Diagnosis." pith.science (2026). https://pith.science/paper/R5L5IGMP
@misc{pith2026250609065,
  author       = {Pith},
  title        = {Pith review of: Exploring Image Transforms derived from Eye Gaze Variables for Progressive Autism Diagnosis},
  year         = {2026},
  howpublished = {\url{https://pith.science/paper/R5L5IGMP}},
  note         = {Machine review of arXiv:2506.09065}
}
read the original abstract
The prevalence of Autism Spectrum Disorder (ASD) has surged rapidly over the past decade, posing significant challenges in communication, behavior, and focus for affected individuals. Current diagnostic techniques, though effective, are time-intensive, leading to high social and economic costs. This work introduces an AI-powered assistive technology designed to streamline ASD diagnosis and management, enhancing convenience for individuals with ASD and efficiency for caregivers and therapists. The system integrates transfer learning with image transforms derived from eye gaze variables to diagnose ASD. This facilitates and opens opportunities for in-home periodical diagnosis, reducing stress for individuals and caregivers, while also preserving user privacy through the use of image transforms. The accessibility of the proposed method also offers opportunities for improved communication between guardians and therapists, ensuring regular updates on progress and evolving support needs. Overall, the approach proposed in this work ensures timely, accessible diagnosis while protecting the subjects' privacy, improving outcomes for individuals with ASD.
Figures


Figures from the paper (4 more)


Reference graph
Works this paper leans on
-
[27]
The haar wavelet transform: its status and achievements,
R. S. Stankovi ´c and B. J. Falkowski, “The haar wavelet transform: its status and achievements,”Computers & Electrical Engineering, vol. 29, no. 1, pp. 25–44, 2003
work page 2003
-
[1]
Autism diagnosis on the rise, according to trends study,
A. Speaks, “Autism diagnosis on the rise, according to trends study,” November 2024, accessible at: https://www.autismspeaks.org/ science-news/. Accessed 17 November 2024
work page 2024
-
[2]
W. H. Organization, “Autism,” 2024, accessible at: https://www.who. int/news-room/fact-sheets/detail/autism-spectrum-disorders#, Accessed 14 November 2024
work page 2024
-
[3]
Autism diagnostic observation schedule (ados),
C. Lord, M. Rutter, S. Goode, J. Heemsbergen, H. Jordan, L. Mawhood, and E. Schopler, “Autism diagnostic observation schedule (ados),” 1989, database record
work page 1989
-
[4]
Autism diagnostic interview-revised,
S. Kim, V . Hus, and C. Lord, “Autism diagnostic interview-revised,” in Encyclopedia of Autism Spectrum Disorders, F. V olkmar, Ed. Springer, New York, NY , 2013
work page 2013
-
[5]
Eye gaze in autism spectrum disorder: A review of neural evidence for the eye avoidance hypothesis,
N. Stuart, A. Whitehouse, R. Palermo, E. Bothe, and N. Badcock, “Eye gaze in autism spectrum disorder: A review of neural evidence for the eye avoidance hypothesis,”J Autism Dev Disord, vol. 53, no. 5, pp. 1884–1905, 2023, epub 2022 Feb 4
work page 1905
-
[6]
F. Cilia, R. Carette, M. Elbattah, G. Dequen, J.-L. Gu ´erin, J. Bosche, L. Vandromme, B. Le Driantet al., “Computer-aided screening of autism spectrum disorder: eye-tracking study using data visualization and deep learning,”JMIR human factors, vol. 8, no. 4, p. e27706, 2021
work page 2021
-
[7]
F. Colonnese, F. Di Luzio, A. Rosato, and M. Panella, “Enhancing autism detection through gaze analysis using eye tracking sensors and data attribution with distillation in deep neural networks,”Sensors, vol. 24, no. 23, p. 7792, 2024
work page 2024
Show all 35 references
-
[8]
Using machine learning to diagnose autism based on eye tracking technology,
A. S. Jaradat, M. Wedyan, S. Alomari, and M. M. Barhoush, “Using machine learning to diagnose autism based on eye tracking technology,” Diagnostics, vol. 15, no. 1, p. 66, 2024
2024
-
[9]
Utilising eye-tracking data in retailing field research: A practical guide,
J. Nordf ¨alt and C.-P. Ahlbom, “Utilising eye-tracking data in retailing field research: A practical guide,”Journal of Retailing, vol. 100, no. 1, pp. 148–160, 2024
2024
-
[10]
Autism spectrum disorder diagnosis with eeg signals using time series maps of brain functional connectivity and a combined cnn–lstm model,
Y . Xu, Z. Yu, Y . Li, Y . Liu, Y . Li, and Y . Wang, “Autism spectrum disorder diagnosis with eeg signals using time series maps of brain functional connectivity and a combined cnn–lstm model,”Computer Methods and Programs in Biomedicine, vol. 250, p. 108196, 2024
2024
-
[11]
Autism spectrum disorder: definition, epidemiology, causes, and clinical evaluation,
H. Hodges, C. Fealko, and N. Soares, “Autism spectrum disorder: definition, epidemiology, causes, and clinical evaluation,”Translational pediatrics, vol. 9, no. Suppl 1, p. S55, 2020
2020
-
[12]
Predictors of outcomes in autism early intervention: why don’t we know more?
G. Vivanti, M. Prior, K. Williams, and C. Dissanayake, “Predictors of outcomes in autism early intervention: why don’t we know more?” Frontiers in pediatrics, vol. 2, p. 58, 2014
2014
-
[13]
Neuroimaging genetics approaches to identify new biomarkers for the early diagnosis of autism spectrum disorder,
S. Nisar and M. Haris, “Neuroimaging genetics approaches to identify new biomarkers for the early diagnosis of autism spectrum disorder,” Mol Psychiatry, vol. 28, no. 12, pp. 4995–5008, 2023, epub 2023 Apr 17. Erratum in: Mol Psychiatry. 2023 Dec;28(12):5009-5010. doi: 10.1038...
2023 doi
-
[14]
Genetics of structural and func- tional brain changes in autism spectrum disorder,
S. Hashem, S. Nisar, A. Bhat, S. Yadav, M. Azeem, P. Bagga, K. Fakhro, R. Reddy, M. Frenneaux, and M. Haris, “Genetics of structural and func- tional brain changes in autism spectrum disorder,”Transl Psychiatry, vol. 10, no. 1, p. 229, 2020
2020
-
[15]
Emerging biomarkers in autism spectrum disorder: a systematic re- view,
R. Frye, S. Vassall, G. Kaur, C. Lewis, M. Karim, and D. Rossignol, “Emerging biomarkers in autism spectrum disorder: a systematic re- view,”Ann Transl Med, vol. 7, no. 23, p. 792, 2019
2019
-
[16]
Thibault, L
R. Thibault, L. Dahl, and A. Raz,Why Neuroimaging can’t Diagnose Autism. Elsevier, 2019
2019
-
[17]
Artificial intelligence for autism spectrum disorders,
E. Ferrari, “Artificial intelligence for autism spectrum disorders,” in Artificial Intelligence in Medicine, N. Lidstr ¨omer and H. Ashrafian, Eds. Springer, Cham, 2022
2022
-
[18]
The use of artificial intelligence in screening and diagnosis of autism spectrum disorder: A literature review,
D.-Y . Song, S. Y . Kim, G. Bong, J. Kim, and H. Yoo, “The use of artificial intelligence in screening and diagnosis of autism spectrum disorder: A literature review,”Journal of the Korean Academy of Child and Adolescent Psychiatry, vol. 30, pp. 145–152, 2019
2019
-
[19]
Autism detection in children: Integrating machine learning and natural language processing in narrative analysis,
C. Themistocleous, M. Andreou, and E. Peristeri, “Autism detection in children: Integrating machine learning and natural language processing in narrative analysis,”Behav. Sci., vol. 14, p. 459, 2024
2024
-
[20]
Artificial intelligence techniques for early autism detection in toddlers: A comparative analysis,
Q. Shambour, N. Qandeel, Y . Alraba’nah, A. Abumariam, and M. K. Shambour, “Artificial intelligence techniques for early autism detection in toddlers: A comparative analysis,”Journal of Applied Data Sciences, vol. 5, pp. 1754–1764, 2024
2024
-
[21]
Estimating the prevalence of autism spectrum disorder in new south wales, australia: A data linkage study of three routinely collected datasets,
T. C. Nielsen, N. Nassar, K. A. Boulton, A. J. Guastella, and S. J. Lain, “Estimating the prevalence of autism spectrum disorder in new south wales, australia: A data linkage study of three routinely collected datasets,”Journal of Autism and Developmental Disorders, vol. 54, n...
2024
-
[22]
Fewer children with autism spectrum disorder with motor challenges receive physical and recreational therapies compared to standard therapies: A spark data set analysis,
A. N. Bhat, “Fewer children with autism spectrum disorder with motor challenges receive physical and recreational therapies compared to standard therapies: A spark data set analysis,”Autism, vol. 28, no. 5, pp. 1161–1174, 2024
2024
-
[23]
Restoring private autism dataset from sanitized database using an optimized key produced from enhanced combined pso-gwo framework,
M. M. Rahman, R. C. Muniyandi, S. Sahran, O. L. Usman, and M. Moniruzzaman, “Restoring private autism dataset from sanitized database using an optimized key produced from enhanced combined pso-gwo framework,”Scientific Reports, vol. 14, no. 1, p. 15763, 2024
2024
-
[24]
Engagnition: A multi- dimensional dataset for engagement recognition of children with autism spectrum disorder,
W. Kim, M. Seong, K.-J. Kim, and S. Kim, “Engagnition: A multi- dimensional dataset for engagement recognition of children with autism spectrum disorder,”Scientific Data, vol. 11, no. 1, p. 299, 2024
2024
-
[25]
A meta-analysis of gaze differences to social and nonsocial information between individuals with and without autism,
T. Frazier, M. Strauss, E. Klingemier, E. Zetzer, A. Hardan, and C. Eng, “A meta-analysis of gaze differences to social and nonsocial information between individuals with and without autism,”J Am Acad Child Adolesc Psychiatry, vol. 56, pp. 546–555, 2017
2017
-
[26]
Going deeper with convolutions,
C. Szegedy, W. Liu, Y . Jia, P. Sermanet, S. Reed, D. Anguelov, D. Erhan, V . Vanhoucke, and A. Rabinovich, “Going deeper with convolutions,” in2015 IEEE Conference on Computer Vision and Pattern Recognition (CVPR), 2015, pp. 1–9
2015
-
[28]
The fast fourier transform,
U. Oberst, “The fast fourier transform,”SIAM J. Control and Optimiza- tion, vol. 46, pp. 496–540, 2007
2007
-
[29]
Visualization of eye gaze data using heat maps
D. ˇSpakov, Oleg & Miniotas, “Visualization of eye gaze data using heat maps.” vol. 115, 2007
2007
-
[30]
Eye tracking: A comprehensive guide to methods and measures,
K. Holmqvist, M. Nystr ¨om, R. Andersson, R. Dewhurst, H. Jarodzka, and J. Van de Weijer, “Eye tracking: A comprehensive guide to methods and measures,” 2011
2011
-
[31]
Fixation maps: quantifying eye-movement traces,
D. S. Wooding, “Fixation maps: quantifying eye-movement traces,” New York, USA, 2002, pp. 31–36
2002
-
[32]
A study of features and deep neural network architectures and hyper-parameters for domestic audio classification,
A. Copiaco, C. Ritz, N. Abdulaziz, and S. Fasciani, “A study of features and deep neural network architectures and hyper-parameters for domestic audio classification,”Appl. Sci., vol. 11, p. 4880, 2021
2021
-
[33]
Application of cnn for human activity recognition with fft spectrogram of acceleration and gyro sensors,
C. Ito, X. Cao, M. Shuzo, and E. Maeda, “Application of cnn for human activity recognition with fft spectrogram of acceleration and gyro sensors,” 2018, pp. 1503–1510
2018
-
[34]
Imagenet classification with deep convolutional neural networks,
A. Krizhevsky, I. Sutskever, and G. E. Hinton, “Imagenet classification with deep convolutional neural networks,” inAdvances in Neural Information Processing Systems 25, F. Pereira, C. J. C. Burges, L. Bottou, and K. Q. Weinberger, Eds. Curran Associates, Inc., 2012, pp. 1097–...
2012
-
[35]
The salient360! toolbox: Processing, visualising and comparing gaze data in 3d,
E. David, J. Guti ´errez, M. L.-H. V o, A. Coutrot, M. Perreira Da Silva, and P. Le Callet, “The salient360! toolbox: Processing, visualising and comparing gaze data in 3d,” inProceedings of the 2023 Symposium on Eye Tracking Research and Applications (ETRA ’23). New York, NY ...
2023
Reviewed August 7, 2026 · model on record in the stance chip above.
Discussion (0). Sign in to comment.