End-to-End Large Portfolio Optimization for Variance Minimization with Neural Networks through Covariance Cleaning
Pith reviewed 2026-05-19 06:13 UTC · model grok-4.3
The pith
A rotation-invariant neural network learns lag transforms and eigenvalue regularization to produce minimum-variance portfolios that outperform shrinkage estimators out of sample.
A machine-rendered reading of the paper's core claim, the machinery that carries it, and where it could break.
Core claim
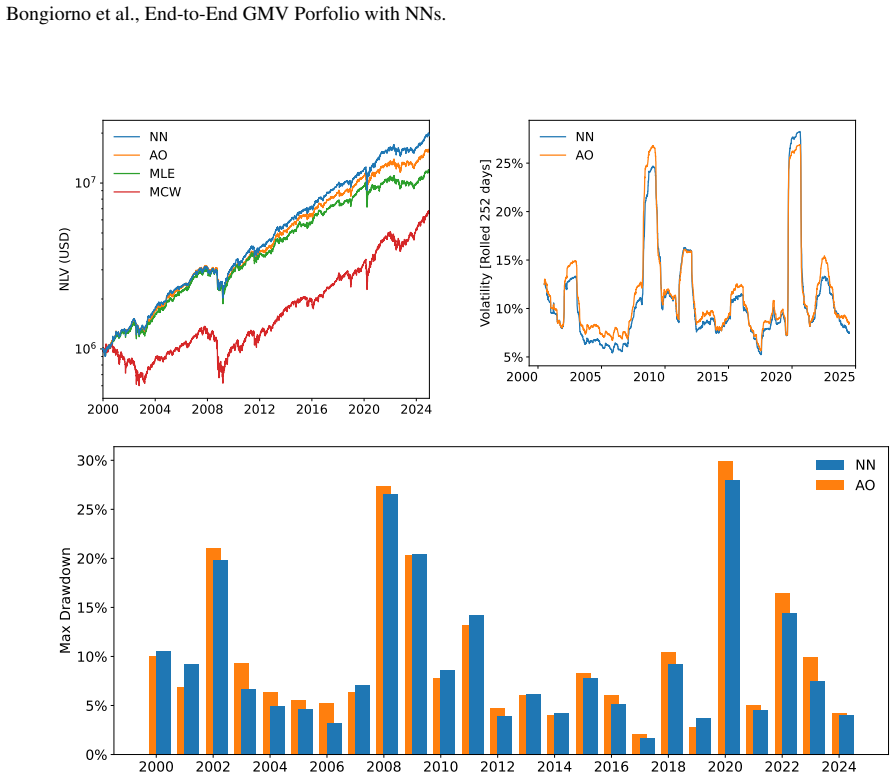
The authors present a rotation-invariant neural network that provides the global minimum-variance portfolio by learning lag-transforms of historical returns and marginal volatilities together with regularization of the eigenvalues of large equity covariance matrices. This explicit mapping supplies interpretability while the architecture stays agnostic to dimension, allowing one model calibrated on a few hundred stocks to be used without retraining on one thousand US equities. The network is optimized end-to-end on the future short-term realized minimum variance using actual returns; in out-of-sample tests spanning January 2000 to December 2024 it delivers lower realized volatility, smaller最大
What carries the argument
A rotation-invariant neural network that mirrors the analytical form of the global minimum-variance solution while jointly learning lag-transforms and eigenvalue regularization.
If this is right
- Lower realized volatility than state-of-the-art non-linear shrinkage in out-of-sample tests from 2000 to 2024
- Smaller maximum drawdowns across both short and long evaluation horizons
- Higher Sharpe ratios that persist when the learned covariance is inserted into long-only optimizers
- Performance advantages remain under realistic execution that includes auction orders, slippage, fees, and leverage financing
- Stability of the edge during episodes of acute market stress
Where Pith is reading between the lines
- The same architecture could be retrained on multi-objective losses that directly penalize turnover or tail risk.
- Because the network is dimension-agnostic, it offers a route to cross-asset or international portfolios without redesigning the model.
- The explicit modules allow post-hoc inspection of the learned regularization rules to derive new analytical cleaning formulas.
- Online updating of the trained weights could adapt the estimator to slow changes in market microstructure.
Load-bearing premise
A single model trained on panels of a few hundred stocks can be applied without retraining to one thousand equities while preserving its performance advantage, relying on rotation invariance and dimension-agnostic architecture.
What would settle it
An out-of-sample test on a fresh panel of one thousand equities in which the model, applied without retraining, shows no reduction in realized volatility or improvement in Sharpe ratio relative to non-linear shrinkage.
Figures


read the original abstract
We develop a rotation-invariant neural network that provides the global minimum-variance portfolio by jointly learning how to lag-transform historical returns and marginal volatilities and how to regularise the eigenvalues of large equity covariance matrices. This explicit mathematical mapping offers clear interpretability of each module's role, so the model cannot be regarded as a pure black box. The architecture mirrors the analytical form of the global minimum-variance solution yet remains agnostic to dimension, so a single model can be calibrated on panels of a few hundred stocks and applied, without retraining, to one thousand US equities, a cross-sectional jump that indicates robust generalization capability. The loss function is the future short-term realized minimum variance and is optimized end-to-end on real returns. In out-of-sample tests from January 2000 to December 2024, the estimator delivers systematically lower realized volatility, smaller maximum drawdowns, and higher Sharpe ratios than the best competitors, including state-of-the-art non-linear shrinkage, and these advantages persist across both short and long evaluation horizons despite the model's training focus is short-term. Furthermore, although the model is trained end-to-end to produce an unconstrained minimum-variance portfolio, we show that its learned covariance representation can be used in general optimizers under long-only constraints with virtually no loss in its performance advantage over competing estimators. These advantages persist when the strategy is executed under a highly realistic implementation framework that models market orders at the auctions, empirical slippage, exchange fees, and financing charges for leverage, and they remain stable during episodes of acute market stress.
Editorial analysis
A structured set of objections, weighed in public.
Referee Report
Summary. The paper introduces a rotation-invariant neural network for large-scale minimum-variance portfolio optimization. It jointly learns lag-transforms of historical returns and marginal volatilities together with eigenvalue regularization of the covariance matrix. The architecture is designed to be dimension-agnostic, allowing a single model trained on panels of a few hundred stocks to be applied without retraining to universes of one thousand equities. The loss is the future short-term realized minimum variance, optimized end-to-end. Out-of-sample results over January 2000–December 2024 are reported to show lower realized volatility, smaller maximum drawdowns, and higher Sharpe ratios than leading competitors including non-linear shrinkage estimators; advantages are claimed to persist under long-only constraints and realistic transaction-cost modeling.
Significance. If the empirical advantages and zero-shot generalization hold after addressing the points below, the work would offer a practically relevant advance in high-dimensional covariance estimation for portfolio construction. The explicit decomposition into interpretable modules (lag-transform, volatility scaling, eigenvalue cleaning) distinguishes it from black-box alternatives and could facilitate adoption in quantitative asset management. The end-to-end training on realized variance supplies a direct, falsifiable objective that aligns with the downstream task.
major comments (3)
- [§4 (Out-of-sample evaluation) and architecture description] The central practical claim—that a model trained on panels of a few hundred stocks can be applied without retraining to one thousand equities while preserving its performance edge—rests on asserted rotation invariance and dimension-agnostic behavior. No ablation that isolates the effect of increasing cross-sectional dimension (holding architecture, training window, and hyperparameters fixed) or direct comparison against an identically architected model retrained on the larger panel is described. This omission is load-bearing for the generalization result highlighted in the abstract and §4.
- [§4 and abstract] The abstract and results section report systematic outperformance in realized volatility, drawdowns, and Sharpe ratios relative to state-of-the-art non-linear shrinkage, yet no statistical significance tests (e.g., Diebold-Mariano, bootstrap confidence intervals on differences, or multiple-testing adjustments) are provided, nor are exact baseline implementations and hyperparameter choices fully detailed. Without these, it is difficult to judge whether the reported advantages are robust or sensitive to implementation specifics.
- [§3 (Loss and training) and §4] The loss is defined on future short-term realized minimum variance, which supplies an external benchmark; however, the learned regularization and transform parameters are optimized end-to-end on the same historical panel used for evaluation. This creates a moderate risk that part of the reported advantage reflects in-sample fitting rather than genuine out-of-sample generalization, particularly given the long 2000–2024 window and absence of explicit look-ahead-bias safeguards.
minor comments (2)
- [§3] Notation for the lag-transform and eigenvalue regularization modules could be clarified with explicit equations showing how each component maps to the analytical minimum-variance solution.
- [Figures and tables in §4] Figure captions and table footnotes should explicitly state the exact number of assets in each training and test cross-section to make the dimension jump transparent.
Simulated Author's Rebuttal
We thank the referee for the constructive and detailed comments. These have helped us identify opportunities to strengthen the empirical support and clarity of the manuscript. We address each major comment below and indicate the revisions we will make.
read point-by-point responses
-
Referee: [§4 (Out-of-sample evaluation) and architecture description] The central practical claim—that a model trained on panels of a few hundred stocks can be applied without retraining to one thousand equities while preserving its performance edge—rests on asserted rotation invariance and dimension-agnostic behavior. No ablation that isolates the effect of increasing cross-sectional dimension (holding architecture, training window, and hyperparameters fixed) or direct comparison against an identically architected model retrained on the larger panel is described. This omission is load-bearing for the generalization result highlighted in the abstract and §4.
Authors: We agree that an explicit ablation isolating the cross-sectional dimension effect would provide stronger support for the claimed zero-shot generalization. In the revised manuscript we will add such an analysis to §4: we will retrain the identical architecture on randomly sampled panels of 200 and 500 stocks drawn from the original training universe and evaluate zero-shot performance on the full 1,000-stock test universe. We will also report results for a model retrained directly on the larger panel (subject to computational feasibility) while holding all other hyperparameters fixed. These additions will quantify whether the performance advantage is preserved by the rotation-invariant design. revision: yes
-
Referee: [§4 and abstract] The abstract and results section report systematic outperformance in realized volatility, drawdowns, and Sharpe ratios relative to state-of-the-art non-linear shrinkage, yet no statistical significance tests (e.g., Diebold-Mariano, bootstrap confidence intervals on differences, or multiple-testing adjustments) are provided, nor are exact baseline implementations and hyperparameter choices fully detailed. Without these, it is difficult to judge whether the reported advantages are robust or sensitive to implementation specifics.
Authors: We concur that formal statistical tests and fuller implementation details are necessary for robust interpretation. In the revision we will add Diebold-Mariano tests comparing realized volatility and Sharpe-ratio series, together with bootstrap confidence intervals on the performance differentials. We will also expand §4 and the appendix to document the precise hyperparameter settings and implementation choices for all non-linear shrinkage baselines, ensuring full reproducibility. revision: yes
-
Referee: [§3 (Loss and training) and §4] The loss is defined on future short-term realized minimum variance, which supplies an external benchmark; however, the learned regularization and transform parameters are optimized end-to-end on the same historical panel used for evaluation. This creates a moderate risk that part of the reported advantage reflects in-sample fitting rather than genuine out-of-sample generalization, particularly given the long 2000–2024 window and absence of explicit look-ahead-bias safeguards.
Authors: We appreciate the concern about potential temporal leakage. The training procedure already employs a strictly causal rolling-window scheme in which parameters are estimated only on data available up to each rebalancing date and the loss is evaluated on subsequent realized variance; the 2000–2024 evaluation itself follows a walk-forward protocol. Nevertheless, to address the referee’s point directly we will add an explicit subsection in §3 describing these safeguards and will include supplementary results that use more conservative hold-out designs (e.g., training exclusively on pre-2010 data for post-2010 evaluation). revision: partial
Circularity Check
No circularity: architecture design and empirical OOS evaluation remain independent of claimed outputs
full rationale
The paper constructs a neural network whose modules explicitly mirror the known analytical GMV formula (inverse covariance weighting) while adding learned lag-transform and eigenvalue regularization; the loss is defined directly on future realized portfolio variance, an external benchmark independent of the fitted parameters. The dimension-agnostic and rotation-invariant properties are architectural choices that permit cross-sectional transfer by design, but the reported performance advantage is measured on a later time window (2000-2024) against external competitors and is not mathematically forced by the training objective or by any self-citation. No equation reduces the out-of-sample volatility or Sharpe improvement to a re-expression of the training inputs; the generalization claim is therefore an empirical assertion rather than a definitional tautology.
Axiom & Free-Parameter Ledger
free parameters (1)
- neural network parameters
axioms (1)
- domain assumption The analytical form of the global minimum-variance portfolio can be mirrored by a neural network architecture that remains agnostic to input dimension.
Lean theorems connected to this paper
-
IndisputableMonolith/Cost/FunctionalEquation.leanwashburn_uniqueness_aczel unclear?
unclearRelation between the paper passage and the cited Recognition theorem.
We develop a rotation-invariant neural network that provides the global minimum-variance portfolio by jointly learning how to lag-transform historical returns and marginal volatilities and how to regularise the eigenvalues of large equity covariance matrices.
-
IndisputableMonolith/Foundation/DimensionForcing.leanalexander_duality_circle_linking unclear?
unclearRelation between the paper passage and the cited Recognition theorem.
The architecture mirrors the analytical form of the global minimum-variance solution yet remains agnostic to dimension, so a single model can be calibrated on panels of a few hundred stocks and applied, without retraining, to one thousand US equities
What do these tags mean?
- matches
- The paper's claim is directly supported by a theorem in the formal canon.
- supports
- The theorem supports part of the paper's argument, but the paper may add assumptions or extra steps.
- extends
- The paper goes beyond the formal theorem; the theorem is a base layer rather than the whole result.
- uses
- The paper appears to rely on the theorem as machinery.
- contradicts
- The paper's claim conflicts with a theorem or certificate in the canon.
- unclear
- Pith found a possible connection, but the passage is too broad, indirect, or ambiguous to say the theorem truly supports the claim.
Reference graph
Works this paper leans on
-
[1]
Harry Markowitz. Portofolio selection. Journal of Finance, 7:77–91, 1952
work page 1952
-
[2]
Eugene F Fama. Efficient capital markets. Journal of Finance, 25(2):383–417, 1970
work page 1970
-
[3]
Estimation of a covariance matrix
Charles Stein. Estimation of a covariance matrix. In 39th Annual Meeting IMS, Atlanta, GA, 1975, 1975
work page 1975
-
[4]
An overview of machine learning for portfolio optimization
Yongjae Lee, Jang Ho Kim, Woo Chang Kim, and Frank J Fabozzi. An overview of machine learning for portfolio optimization. Journal of Portfolio Management, 51(2), 2024
work page 2024
-
[5]
Noise dressing of financial correlation matrices
Laurent Laloux, Pierre Cizeau, Jean-Philippe Bouchaud, and Marc Potters. Noise dressing of financial correlation matrices. Physical Review Letters, 83(7):1467, 1999
work page 1999
-
[6]
Olivier Ledoit and Michael Wolf. A well-conditioned estimator for large-dimensional covariance matrices.Journal of Multivariate Analysis, 88(2):365–411, 2004
work page 2004
-
[7]
Cleaning large correlation matrices: tools from random matrix theory
Joël Bun, Jean-Philippe Bouchaud, and Marc Potters. Cleaning large correlation matrices: tools from random matrix theory. Physics Reports, 666:1–109, 2017
work page 2017
-
[8]
Optimal data splitting for holdout cross-validation in large covariance matrix estimation
Lamia Lamrani, Christian Bongiorno, and Marc Potters. Optimal data splitting for holdout cross-validation in large covariance matrix estimation. arXiv preprint arXiv:2503.15186, 2025
-
[9]
Nonlinear shrinkage estimation of large-dimensional covariance matrices
Olivier Ledoit and Michael Wolf. Nonlinear shrinkage estimation of large-dimensional covariance matrices. The Annals of Statistics, 2012
work page 2012
-
[10]
Eigenvectors of some large sample covariance matrix ensembles
Olivier Ledoit and Sandrine Péché. Eigenvectors of some large sample covariance matrix ensembles. Probability Theory and Related Fields, 151(1):233–264, 2011
work page 2011
-
[11]
Olivier Ledoit and Michael Wolf. Spectrum estimation: A unified framework for covariance matrix estimation and pca in large dimensions. Journal of Multivariate Analysis, 139:360–384, 2015
work page 2015
-
[12]
Direct nonlinear shrinkage estimation of large-dimensional covariance matrices
Olivier Ledoit and Michael Wolf. Direct nonlinear shrinkage estimation of large-dimensional covariance matrices. Technical report, Working Paper, 2017
work page 2017
-
[13]
Quadratic shrinkage for large covariance matrices
Olivier Ledoit and Michael Wolf. Quadratic shrinkage for large covariance matrices. Bernoulli, 28(3):1519–1547, 2022
work page 2022
-
[14]
Advances in high-dimensional covariance matrix estimation
Daniel Bartz. Advances in high-dimensional covariance matrix estimation . Technische Universitaet Berlin (Germany), 2016. 20 Bongiorno et al., End-to-End GMV Porfolio with NNs
work page 2016
-
[15]
Clifford Lam. Nonparametric eigenvalue-regularized precision or covariance matrix estimator.Annals of Statistics, 44(3):928–953, 2016
work page 2016
-
[16]
A nonparametric eigenvalue-regularized integrated covariance matrix estimator for asset return data
Clifford Lam and Phoenix Feng. A nonparametric eigenvalue-regularized integrated covariance matrix estimator for asset return data. Journal of Econometrics, 206(1):226–257, 2018
work page 2018
-
[17]
Pierre-Alain Reigneron, Vincent Nguyen, Stefano Ciliberti, Philip Seager, and Jean-Philippe Bouchaud. Agnostic allocation portfolios: a sweet spot in the risk-based jungle? Journal of Portfolio Management, 46(4):22–38, 2020
work page 2020
-
[18]
Estimation of large financial covariances: A cross-validation approach
Vincent Tan and Stefan Zohren. Estimation of large financial covariances: A cross-validation approach. Journal of Portfolio Management, 51(4), 2025
work page 2025
-
[19]
Correlation, hierarchies, and networks in financial markets
Michele Tumminello, Fabrizio Lillo, and Rosario N Mantegna. Correlation, hierarchies, and networks in financial markets. Journal of Economic Behavior & Organization, 75(1):40–58, 2010
work page 2010
-
[20]
Covariance matrix filtering with bootstrapped hierarchies
Christian Bongiorno and Damien Challet. Covariance matrix filtering with bootstrapped hierarchies. PloS One, 16(1):e0245092, 2021
work page 2021
-
[21]
Reactive global minimum variance portfolios with k-bahc covariance cleaning
Christian Bongiorno and Damien Challet. Reactive global minimum variance portfolios with k-bahc covariance cleaning. The European Journal of Finance, 28(13-15):1344–1360, 2022
work page 2022
- [22]
-
[23]
Cluster analysis for portfolio optimiza- tion
Vincenzo Tola, Fabrizio Lillo, Mauro Gallegati, and Rosario N Mantegna. Cluster analysis for portfolio optimiza- tion. Journal of Economic Dynamics and Control, 32(1):235–258, 2008
work page 2008
-
[24]
Ester Pantaleo, Michele Tumminello, Fabrizio Lillo, and Rosario N Mantegna. When do improved covariance matrix estimators enhance portfolio optimization? an empirical comparative study of nine estimators. Quantitative Finance, 11(7):1067–1080, 2011
work page 2011
-
[25]
Two-step estimators of high-dimensional correlation matrices
Andrés García-Medina, Salvatore Miccichè, and Rosario N Mantegna. Two-step estimators of high-dimensional correlation matrices. Physical Review E, 108(4):044137, 2023
work page 2023
-
[26]
Robert Engle. Dynamic conditional correlation: A simple class of multivariate generalized autoregressive conditional heteroskedasticity models. Journal of Business & Economic Statistics, 20(3):339–350, 2002
work page 2002
-
[27]
Christian Bongiorno and Damien Challet. Covariance matrix filtering and portfolio optimisation: the average oracle vs non-linear shrinkage and all the variants of dcc-nls. Quantitative Finance, pages 1–8, 2024
work page 2024
-
[28]
Filtering time-dependent covariance matrices using time-independent eigenvalues
Christian Bongiorno, Damien Challet, and Grégoire Loeper. Filtering time-dependent covariance matrices using time-independent eigenvalues. Journal of Statistical Mechanics: Theory and Experiment, 2023(2):023402, 2023
work page 2023
-
[29]
Jean-David Fermanian, Benjamin Poignard, and Panos Xidonas. Model-based vs. agnostic methods for the prediction of time-varying covariance matrices. Annals of Operations Research, pages 1–38, 2024
work page 2024
-
[30]
Quantifying the information lost in optimal covariance matrix cleaning
Christian Bongiorno and Lamia Lamrani. Quantifying the information lost in optimal covariance matrix cleaning. Physica A: Statistical Mechanics and its Applications, 657:130225, 2025
work page 2025
-
[31]
Christian Bongiorno and Damien Challet. Non-linear shrinkage of the price return covariance matrix is far from optimal for portfolio optimization. Finance Research Letters, 52:103383, 2023
work page 2023
-
[32]
Log-gases and random matrices (LMS-34)
Peter J Forrester. Log-gases and random matrices (LMS-34). Princeton university press, 1st edition, 2010. pp. 111-115
work page 2010
-
[33]
Dynamic portfolio optimization using a hybrid mlp-har approach
Caio Mário Mesquita, Cristiano Arbex Valle, and Adriano CM Pereira. Dynamic portfolio optimization using a hybrid mlp-har approach. In 2020 IEEE Symposium Series on Computational Intelligence (SSCI) , pages 1075–1082. IEEE, 2020
work page 2020
-
[34]
A deep learning framework for medium-term covariance forecasting in multi-asset portfolios
Pedro Reis, Ana Paula Serra, and João Gama. A deep learning framework for medium-term covariance forecasting in multi-asset portfolios. arXiv preprint arXiv:2503.01581, 2025
-
[35]
Enhancing portfolio optimization: A two-stage approach with deep learning and portfolio optimization
Shiguo Huang, Linyu Cao, Ruili Sun, Tiefeng Ma, and Shuangzhe Liu. Enhancing portfolio optimization: A two-stage approach with deep learning and portfolio optimization. Mathematics, 12(21):3376, 2024
work page 2024
-
[36]
Integrating prediction in mean-variance portfolio optimization
Andrew Butler and Roy H Kwon. Integrating prediction in mean-variance portfolio optimization. Quantitative Finance, 23(3):429–452, 2023
work page 2023
-
[37]
Deep learning for portfolio optimization
Zihao Zhang, Stefan Zohren, and Stephen Roberts. Deep learning for portfolio optimization. The Journal of Financial Data Science, 2(4):8–20, 2020
work page 2020
-
[38]
Distributionally robust end-to-end portfolio construction
Giorgio Costa and Garud N Iyengar. Distributionally robust end-to-end portfolio construction. Quantitative Finance, 23(10):1465–1482, 2023. 21 Bongiorno et al., End-to-End GMV Porfolio with NNs
work page 2023
-
[39]
End-to-end risk budgeting portfolio optimization with neural networks
A Sinem Uysal, Xiaoyue Li, and John M Mulvey. End-to-end risk budgeting portfolio optimization with neural networks. Annals of Operations Research, 339(1):397–426, 2024
work page 2024
-
[40]
Deep deterministic portfolio optimization
Ayman Chaouki, Stephen Hardiman, Christian Schmidt, Emmanuel Sérié, and Joachim De Lataillade. Deep deterministic portfolio optimization. The Journal of Finance and Data Science, 6:16–30, 2020
work page 2020
-
[41]
Junkyu Jang and NohYoon Seong. Deep reinforcement learning for stock portfolio optimization by connecting with modern portfolio theory. Expert Systems with Applications, 218:119556, 2023
work page 2023
-
[42]
Reinforcement learning for deep portfolio optimization
Ruyu Yan, Jiafei Jin, and Kun Han. Reinforcement learning for deep portfolio optimization. Electronic Research Archive, 32(9), 2024
work page 2024
-
[43]
Optimization-based spectral end-to-end deep reinforcement learning for equity portfolio management
Pengrui Yu, Siya Liu, Chengneng Jin, Runsheng Gu, and Xiaomin Gong. Optimization-based spectral end-to-end deep reinforcement learning for equity portfolio management. Pacific-Basin Finance Journal, 91:102746, 2025
work page 2025
-
[44]
Dominating estimators for the global minimum variance portfolio
Gabriel Frahm and Christoph Memmel. Dominating estimators for the global minimum variance portfolio. Technical Report 01/2009, Deutsche Bundesbank, January 2009
work page 2009
- [45]
-
[46]
Victor DeMiguel, Lorenzo Garlappi, and Raman Uppal. Optimal versus naive diversification: How inefficient is the 1/n portfolio strategy? The Review of Financial Studies, 22(5):1915–1953, 2009
work page 1915
-
[47]
Robert F Engle. Autoregressive conditional heteroscedasticity with estimates of the variance of united kingdom inflation. Econometrica: Journal of the Econometric Society, pages 987–1007, 1982
work page 1982
-
[48]
Gilles O. Zumbach. V olatility processes and volatility forecast with long memory.Quantitative Finance, 4(1):70, oct 2003
work page 2003
-
[49]
Michael J Best and Robert R Grauer. On the sensitivity of mean-variance-efficient portfolios to changes in asset means: some analytical and computational results. The Review of Financial Studies, 4(2):315–342, 1991
work page 1991
-
[50]
Empirical evidence on student-t log-returns of diversified world stock indices
Eckhard Platen and Renata Rendek. Empirical evidence on student-t log-returns of diversified world stock indices. Journal of Statistical Theory and Practice, 2(2):233–251, 2008
work page 2008
-
[51]
The likelihood of various stock market return distributions, part 2: Empirical results
Harry M Markowitz and Nilufer Usmen. The likelihood of various stock market return distributions, part 2: Empirical results. Journal of Risk and Uncertainty, 13:221–247, 1996
work page 1996
-
[52]
Optimal covariance cleaning for heavy-tailed distributions: Insights from information theory
Christian Bongiorno and Marco Berritta. Optimal covariance cleaning for heavy-tailed distributions: Insights from information theory. Physical Review E, 108(5):054133, 2023
work page 2023
-
[53]
Risk reduction in large portfolios: Why imposing the wrong constraints helps
Ravi Jagannathan and Tongshu Ma. Risk reduction in large portfolios: Why imposing the wrong constraints helps. The Journal of Finance, 58(4):1651–1683, 2003
work page 2003
-
[54]
Nonlinear shrinkage of the covariance matrix for portfolio selection: Markowitz meets goldilocks
Olivier Ledoit and Michael Wolf. Nonlinear shrinkage of the covariance matrix for portfolio selection: Markowitz meets goldilocks. The Review of Financial Studies, 30(12):4349–4388, 06 2017
work page 2017
-
[55]
Gilles O. Zumbach. The riskmetrics 2006 methodology. Technical Report 185, RiskMetrics Group, Geneva, Switzerland, March 2007
work page 2006
-
[56]
Manzil Zaheer, Satwik Kottur, Siamak Ravanbakhsh, Barnabás Poczos, Ruslan Salakhutdinov, and Alexander J. Smola. Deep sets. In Advances in Neural Information Processing Systems, volume 30, 2017
work page 2017
-
[57]
Gomez, Łukasz Kaiser, and Illia Polosukhin
Ashish Vaswani, Noam Shazeer, Niki Parmar, Jakob Uszkoreit, Llion Jones, Aidan N. Gomez, Łukasz Kaiser, and Illia Polosukhin. Attention is all you need. In Advances in Neural Information Processing Systems, volume 30, 2017
work page 2017
-
[58]
Fuchs, Martin Engelcke, Michael A
Edward Wagstaff, Fabian B. Fuchs, Martin Engelcke, Michael A. Osborne, and Ingmar Posner. Universal approximation of functions on sets. Journal of Machine Learning Research, 23(21-0730), 2021
work page 2021
-
[59]
Understanding the difficulty of training transformers
Liyuan Liu, Xiaodong Liu, Jianfeng Gao, Weizhu Chen, and Jiawei Han. Understanding the difficulty of training transformers. In Proceedings of the 2020 Conference on Empirical Methods in Natural Language Processing (EMNLP), pages 5747–5763, 2020
work page 2020
-
[60]
Attention is not all you need: Pure attention loses rank doubly exponentially with depth
Yihe Dong, Jean-Baptiste Cordonnier, and Andreas Loukas. Attention is not all you need: Pure attention loses rank doubly exponentially with depth. In International Conference on Machine Learning, pages 2793–2803. PMLR, 2021
work page 2021
-
[61]
Gers, Jürgen Schmidhuber, and Fred Cummins
Felix A. Gers, Jürgen Schmidhuber, and Fred Cummins. Learning to forget: Continual prediction with lstm. Neural Computation, 12(10):2451–2471, 2000
work page 2000
-
[62]
Mike Schuster and Kuldip K. Paliwal. Bidirectional recurrent neural networks. IEEE Transactions on Signal Processing, 45(11):2673–2681, November 1997. 22 Bongiorno et al., End-to-End GMV Porfolio with NNs
work page 1997
-
[63]
Securities and Exchange Commission
U.S. Securities and Exchange Commission. 17 CFR §240.12d2-2 – Removal from Listing and Registration. https://www.law.cornell.edu/cfr/text/17/240.12d2-2, 2024
work page 2024
-
[64]
A Modern Introduction to Probability and Statistics: Understanding why and how
Frederik Michel Dekking. A Modern Introduction to Probability and Statistics: Understanding why and how . Springer Science & Business Media, 2005. pg. 231-243
work page 2005
-
[65]
Large dynamic covariance matrices
Robert F Engle, Olivier Ledoit, and Michael Wolf. Large dynamic covariance matrices. Journal of Business & Economic Statistics, 37(2):363–375, 2019
work page 2019
-
[66]
J. P. Morgan Guaranty Trust Company and Reuters Ltd. Riskmetrics™ —technical document. Technical report, J. P. Morgan Guaranty Trust Company and Reuters Ltd., New York, December 1996
work page 1996
-
[67]
Simple multivariate conditional covariance dynamics using hyperbolically weighted moving averages
Hiroyuki Kawakatsu. Simple multivariate conditional covariance dynamics using hyperbolically weighted moving averages. Journal of Econometric Methods, 10(1):33–52, 2021
work page 2021
-
[68]
Mesoscopic community structure of financial markets revealed by price and sign fluctuations
Assaf Almog, Ferry Besamusca, Mel MacMahon, and Diego Garlaschelli. Mesoscopic community structure of financial markets revealed by price and sign fluctuations. PloS one, 10(7):e0133679, 2015
work page 2015
-
[69]
On the methods of measuring association between two attributes
G Udny Yule. On the methods of measuring association between two attributes. Journal of the Royal Statistical Society, 75(6):579–652, 1912
work page 1912
-
[70]
Kendall correlation coefficients for portfolio optimization
Tomas Espana, Victor Le Coz, and Matteo Smerlak. Kendall correlation coefficients for portfolio optimization. arXiv preprint arXiv:2410.17366, 2024
-
[71]
Optnet: Differentiable optimization as a layer in neural networks
Brandon Amos and J Zico Kolter. Optnet: Differentiable optimization as a layer in neural networks. In International Conference on Machine Learning, pages 136–145. PMLR, 2017
work page 2017
-
[72]
Demystifying equity risk-based strategies: A simple alpha plus beta description
Raul Leote, Xiao Lu, and Pierre Moulin. Demystifying equity risk-based strategies: A simple alpha plus beta description. Journal of Portfolio Management, 38(3):56–70, 2012
work page 2012
-
[73]
Cap-weighted portfolios are sub-optimal portfolios
Jason C Hsu. Cap-weighted portfolios are sub-optimal portfolios. Journal of Investment Management, 4(3), 2004
work page 2004
-
[74]
A new method to estimate the noise in financial correlation matrices
Thomas Guhr and Bernd Kälber. A new method to estimate the noise in financial correlation matrices. Journal of Physics A: Mathematical and General, 36(12):3009, 2003
work page 2003
-
[75]
Oliver Kramer and Oliver Kramer. Scikit-learn. Machine Learning for Evolution Strategies, pages 45–53, 2016
work page 2016
-
[76]
covShrinkage: A package for shrinkage estimation of covariance matrices
Patrick Ledoit. covShrinkage: A package for shrinkage estimation of covariance matrices. https://github. com/pald22/covShrinkage, 2022. Accessed: 2025-06-20
work page 2022
-
[77]
Zhangshuang Sun, Xuerui Gao, Kangyang Luo, Yanqin Bai, Jiyuan Tao, and Guoqiang Wang. Enhancing high-dimensional dynamic conditional angular correlation model based on garch family models: Comparative performance analysis for portfolio optimization. Finance Research Letters, 75:106808, 2025
work page 2025
-
[78]
An index of portfolio diversification
Walt Woerheide and Don Persson. An index of portfolio diversification. Financial Services Review, 2(2):73–85, 1992
work page 1992
-
[79]
Interactive Brokers. Commissions & Fees . https://www.interactivebrokers.com/en/pricing/ commissions-home.php, 2025. Accessed: 2025-06-19
work page 2025
-
[80]
Benchmark interest calculation reference rate descriptions.https://www.ibkrguides
Interactive Brokers LLC. Benchmark interest calculation reference rate descriptions.https://www.ibkrguides. com/kb/en-us/benchmark-interest-calculation-reference-rate-descriptions.htm , 2025. Last updated July 8, 2025
work page 2025
discussion (0)
Sign in with ORCID, Apple, or X to comment. Anyone can read and Pith papers without signing in.