REVIEW 4 major objections 5 minor 28 references
Multi-Year Maintenance Planning for Large-Scale Infrastructure Systems: A Novel Network Deep Q-Learning Approach
T0 review · 4 major / 5 minor · reviewed 2026-08-06 · deepseek-v4-flash
Pith's one-line read Deep Q-learning, split per asset and reconciled by a budget layer, beats year-by-year LP and GA baselines in 20-year road maintenance planning.
desk verdict The engineering case study is real, but the learning rule is described two incompatible ways and no code shows which one produced the numbers. read the letter →
The pith
A machine-rendered reading of the paper's core claim, the machinery that carries it, and where it could break.
The reading
What carries the argument
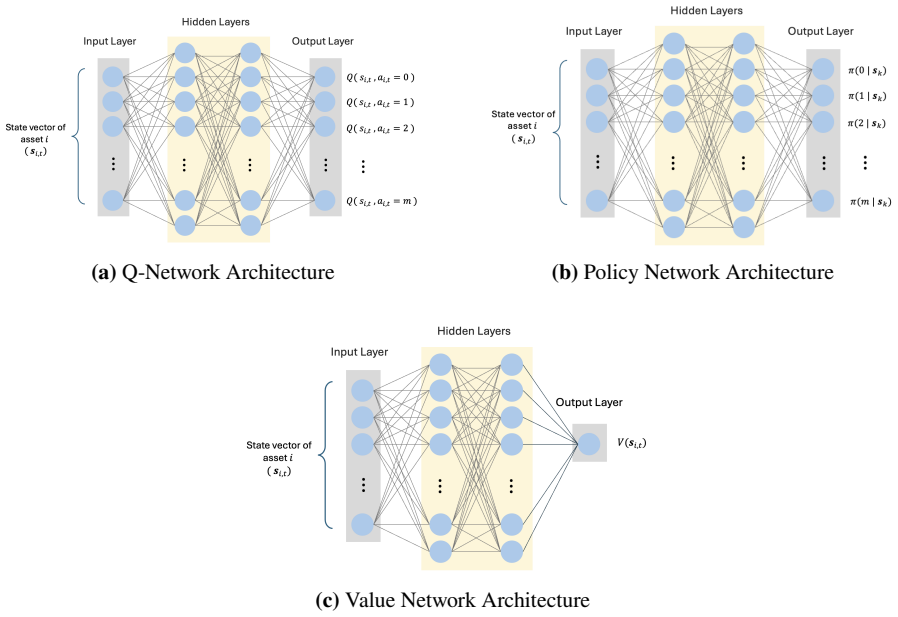
The mechanism is the decomposition of the network MDP into asset-level MDPs plus a budget-allocation layer, all driven by a cost-normalized local reward $R_i = (f_{i,a}(s) - f_{i,0}(s))/c_{i,a}$, which measures condition improvement per dollar. A single shared-parameter neural network estimates local Q-values, an Expected SARSA update replaces the max operator so future actions are weighted by the learned policy's probabilities, and a greedy knapsack-style solver (approximating the binary LP in Eqs. 8–10) chooses which candidate actions are funded. A global value network plus policy network, trained on network-level rewards, shapes exploration toward actions that improve the overall Level of Service. Together these parts keep the per-step computation linear in the number of assets rather than combinatorial, while the budget layer keeps the plan feasible each year.
What would settle it
Solve the annual budget-allocation problem exactly as a 0/1 integer program (or by branch-and-bound) on the same 68,800-segment case study and compare HALoS and EHLoS with the greedy-heuristic version; if exact allocation does not improve or match the reported 5.62/5.86, the learning component is not the source of the advantage, and if it surpasses them, the heuristic is hiding part of the benefit.
Extended reading notes
Core claim
The central discovery is that the coupling introduced by a shared annual budget does not require solving a single high-dimensional constrained MDP; it can be approximated by a three-part decomposition. Each asset learns its own action-value function from a cost-normalized reward—the improvement in condition per unit cost—so Q-values are comparable across assets with different sizes and treatment costs. A budget-allocation layer, formulated as a binary linear program and solved by a greedy knapsack-style ranking (with Gaussian exploration noise), selects which candidate actions actually receive funding each year. A shared policy network and a global value network then steer the local learners toward network-wide Level of Service, rather than purely local myopia. The paper's empirical claim is that this Network DQL framework outperforms all three baselines on the 68,800-segment case study, with the margin coming from a learned strategy that invests early in rehabilitation and only later in reconstruction.
Load-bearing premise
The load-bearing premise is that the greedy knapsack-style allocation of the annual budget gets close enough to the true optimum of the binary LP; if it does not, the reported gains over the baselines could come from the allocation heuristic rather than from the learned Q-values.
Editorial extensions
If this is right
- If the framework works as claimed, a 20-year maintenance plan for a network with tens of thousands of assets can be trained in about 97 minutes on a CPU-only workstation, and the learned plan stays within the annual budget each year.
- The learned early-rehabilitation/late-reconstruction profile implies that myopic planners underspend on preventive maintenance; adopting a long-horizon learned policy can raise the network's average and end-of-horizon LoS under the same budget.
- Tuning the discount factor $\gamma$ gives agencies a practical dial between near-term LoS improvement and end-of-horizon performance, so a manager can choose where on that trade-off to sit.
- The hybrid experiment (one year of Network DQL followed by Progressive LP) shows that even a single year of globally optimized actions leaves a persistent benefit, suggesting the value of strategic early investments even when full DRL cannot be adopted.
- Because the same network translates asset-specific inputs to policies, the approach extends to added segments or even other asset types without changing the model architecture.
Reading between the lines
- A natural testable extension is to replace the greedy knapsack allocation with an exact integer-programming solve on the same case study; if the exact version materially changes the LoS numbers, the reported gains are partly an artifact of the allocation heuristic rather than the learned Q-values.
- The cost-normalized reward format suggests the same architecture could be applied to budget-constrained portfolio problems outside pavements, such as bridge or water networks, since assets enter only through parameter vectors, which would make cross-asset transfer an explicit experiment.
- The paper's model assumes assets deteriorate independently; adding spatially correlated deterioration (for example, roads in the same neighborhood) would test whether the shared-policy approach still captures systemic risks.
- One could also measure the optimality gap directly by comparing the Network DQL plan's final LoS against an LP upper bound over the full horizon, to see how much of the gain comes from foresight versus simply from a better single-step allocation.
Editorial analysis
A structured set of objections, weighed in public.
Referee Report
Summary. The manuscript proposes Network DQL, a deep reinforcement learning framework for multi-year infrastructure maintenance planning. The method decomposes a network-level Markov Decision Process into asset-level MDPs, uses a cost-normalized local reward, trains a shared Q-network together with a policy network and a global value network, and enforces annual budget constraints through a knapsack/LP allocation layer. The approach is evaluated on a synthetic 68,800-segment pavement network over a 20-year horizon, reporting a HALoS of 5.62 and an EHLoS of 5.86, versus 5.50/5.68 for the Hybrid LP-GA baseline. Additional experiments examine sensitivity to the discount factor and the effect of using the proposed method only in the first year.
Significance. If the method is correctly specified and the results are reproducible, the paper would make a useful contribution to scalable infrastructure asset management. The core idea of using asset-level MDPs with a shared network and a cost-normalized reward to handle tens of thousands of assets under budget constraints is appealing, and the case-study size is substantial. The paper also addresses a real gap in the DRL-for-infrastructure literature, namely explicit budget enforcement. However, the manuscript currently contains a load-bearing internal inconsistency between the Expected SARSA update of Eq. (7) and the max-based DQN target of Eq. (14), and an unproved claim about the asymptotic optimality of a greedy knapsack heuristic. These issues must be resolved before the reported performance gains can be attributed to the proposed learning method. The lack of code release and the absence of error bars further limit the strength of the empirical claims.
major comments (4)
- [Section 3.2 and Section 3.4 (Eqs. 7 and 14)] The paper is internally inconsistent about the Q-learning update rule. Section 3.2 states that the method adopts an Expected SARSA update and Eq. (7) defines Q_i(s,a) = r + gamma * sum_{a'} pi_i(a'|s') Q_i(s',a'), while Section 3.4 defines the TD target as y_TD = r + gamma (1-d) max_{a'} Q(s',a'; theta^-_Q) and the corresponding MSE loss in Eq. (14). These updates are not equivalent, and the text never states which one produced the results in Table 1. Since the Q-values feed directly into the budget allocation LP and the policy network, the reader cannot determine what was actually trained. Please specify the exact update rule used, derive its relationship to the stated Expected SARSA formulation, and explain why the max-based target in Eq. (14) is not a typographical error.
- [Section 3.4, Step 2] The claim that the greedy knapsack-like heuristic 'converges asymptotically to the LP solution for large-scale knapsack problems' is unsupported and, in general, false for 0/1 knapsack. The greedy value-to-cost rule is not asymptotically optimal without additional structural assumptions. This is load-bearing because the annual budget allocation is central to the proposed framework, and if the greedy heuristic is suboptimal, the reported LoS gains could reflect the allocation heuristic rather than the Q-learning. Please either provide a rigorous proof with explicit assumptions, use an exact LP/knapsack solver (the text already mentions OR-tools for the LP), or clearly state that the reported results are produced by the heuristic and quantify the resulting suboptimality.
- [Section 5, Table 1 and Figure 6] Table 1 reports a single value for each method, yet Figure 6 is described as averaging over 1,000 simulations. No standard deviations, confidence intervals, or number of runs are given for HALoS and EHLoS. The reported improvements over Hybrid LP-GA are modest (0.12 in HALoS and 0.18 in EHLoS), and without variability measures it is not possible to judge whether the differences are statistically significant. Please provide error bars or per-seed results for all reported metrics.
- [Section 3.4, Step 2 (Eqs. 12-13)] The LP in Eqs. (12)-(13) differs from the earlier formulation in Eqs. (8)-(10): the earlier LP selects one action per asset from the full action set, while the later formulation first fixes a single candidate action per asset and then solves a 0/1 knapsack over those candidates. This distinction matters for the comparison with Progressive LP and Hybrid LP-GA, which may optimize over a richer action set. Please clarify how the candidate-action restriction affects the optimality of the allocation and whether the same restriction is applied to the baseline methods.
minor comments (5)
- [Section 3.4] The text says the Q-network is trained with Expected SARSA, but Eq. (14) is written as a DQN max target. Even if this is a typographical issue, the notation should be corrected throughout, including in Figure 1, which shows the expected-SARSA target.
- [Section 4.5] It is unclear whether the 1,000 training episodes and the 1,000 simulations over which Figure 6 is averaged are separate random seeds. Please state how many independent training runs and evaluation runs were performed.
- [Figure 1] The flowchart is nearly unreadable in the current version. A high-resolution vector figure with larger text would be needed for readers to follow the training and execution loop.
- [Section 5, Delayed Reward] The hybrid experiment in Figure 8 is described only qualitatively. Please specify whether the first-year plan is the policy from the fully trained Network DQL model, how the switch to Progressive LP is implemented, and whether the result is robust across multiple seeds.
- [Section 4.4] The hyperparameters used for training (learning rates, mini-batch size, target-network update frequency, epsilon decay schedule, neural-network layer sizes) are not reported. Without these details the results are not reproducible, and the 97-minute training time cannot be interpreted.
Circularity Check
No circularity: the reported LoS values are the optimization objective itself, and the only self-citations are a comparison baseline and contextual remarks.
full rationale
The paper's derivation chain is an end-to-end optimization pipeline: it defines LoS as the objective (Eq. 1), formulates maintenance planning as an MDP, learns Q-functions with a cost-normalized reward (Eq. 6), enforces budget feasibility via a knapsack-style LP allocation (Eqs. 8-10), and then reports the LoS achieved on the same simulated network. Reporting the optimized objective value is standard for an optimization method, not a circular derivation; no fitted parameter is relabeled as an independent prediction. The only self-citations are to the authors' earlier Hybrid LP-GA method, used as a comparison baseline, and to their claim that heuristic methods struggle with large networks. These are not load-bearing: the benchmark result is an empirical baseline rather than a premise used to force the proposed method, and the critical remark is contextual. The internal inconsistency between the Expected SARSA target (Eq. 7 and Fig. 1) and the max-based DQN target (Eq. 14) is an algorithmic ambiguity affecting reproducibility and correctness, but it is not circularity because neither rule is defined in terms of the reported result. No uniqueness theorem or prior self-authored result is invoked to forbid alternatives. Accordingly, no significant circularity is found; the score reflects only the minor self-referential choice of the Hybrid LP-GA baseline.
Assumptions & free parameters
free parameters (1)
- Rehabilitation improvement factor (Delta_rehab) =
2.5
assumptions (5)
- domain assumption Absent budget constraints, the network MDP decomposes into independent asset-level MDPs (Eq. 5).
- ad hoc to paper The cost-normalized reward in Eq. (6) yields Q-values that can be multiplied by cost and weight to estimate total network improvement in the LP.
- ad hoc to paper The greedy knapsack heuristic converges asymptotically to the LP solution.
- domain assumption Pavement condition deteriorates according to the Weibull model in Eq. (18).
- domain assumption Rehabilitation effectiveness follows Eq. (19) with Delta_rehab=2.5.
Cite this review
Pith. "Pith review of Multi-Year Maintenance Planning for Large-Scale Infrastructure Systems: A Novel Network Deep Q-Learning Approach." pith.science (2026). https://pith.science/paper/LX4DKDQS
@misc{pith2026250718732,
  author       = {Pith},
  title        = {Pith review of: Multi-Year Maintenance Planning for Large-Scale Infrastructure Systems: A Novel Network Deep Q-Learning Approach},
  year         = {2026},
  howpublished = {\url{https://pith.science/paper/LX4DKDQS}},
  note         = {Machine review of arXiv:2507.18732}
}
read the original abstract
Infrastructure asset management is essential for sustaining the performance of public infrastructure such as road networks, bridges, and utility networks. Traditional maintenance and rehabilitation planning methods often face scalability and computational challenges, particularly for large-scale networks with thousands of assets under budget constraints. This paper presents a novel deep reinforcement learning (DRL) framework that optimizes asset management strategies for large infrastructure networks. By decomposing the network-level Markov Decision Process (MDP) into individual asset-level MDPs while using a unified neural network architecture, the proposed framework reduces computational complexity, improves learning efficiency, and enhances scalability. The framework directly incorporates annual budget constraints through a budget allocation mechanism, ensuring maintenance plans are both optimal and cost-effective. Through a case study on a large-scale pavement network of 68,800 segments, the proposed DRL framework demonstrates significant improvements over traditional methods like Progressive Linear Programming and genetic algorithms, both in efficiency and network performance. This advancement contributes to infrastructure asset management and the broader application of reinforcement learning in complex, large-scale environments.
Figures


Figures from the paper (6 more)


Reference graph
Works this paper leans on
-
[1]
write newline
" write newline "" before.all 'output.state := FUNCTION article output.bibitem format.authors "author" output.check author format.key output output.year.check new.block format.title "title" output.check after.quote 'output.state := crossref missing journal emphasize "journal" output.check organization output format.vol.num.pages output format.article.cros...
-
[2]
Alqithami, S. (2025). ``Ch-marl: Constrained hierarchical multiagent reinforcement learning for sustainable maritime logistics.''\ arXiv preprint arXiv:2502.02060
work page Pith review arXiv 2025
-
[3]
Chu, J. C. and Huang, K. H. (2018). ``Mathematical programming framework for modeling and comparing network-level pavement maintenance strategies.''\ Transportation Research Part B: Methodological , 109, 1--25
work page 2018
-
[4]
Du, A. and Ghavidel, A. (2022). ``Parameterized deep reinforcement learning-enabled maintenance decision-support and life-cycle risk assessment for highway bridge portfolios.''\ Structural Safety , 97
work page 2022
-
[5]
Elbeltagi, E., Hegazy, T., and Grierson, D. (2005). ``Comparison among five evolutionary-based optimization algorithms.''\ Advanced Engineering Informatics , 19, 43--53
work page 2005
-
[6]
Fard, A. K. and Yuan, X.-X. (2024). ``Multiyear maintenance and rehabilitation optimization for large-scale infrastructure networks: An enhanced genetic algorithm approach.''\ Journal of Infrastructure Systems , 30
work page 2024
-
[7]
Han, C., Ma, T., and Chen, S. (2021). ``Asphalt pavement maintenance plans intelligent decision model based on reinforcement learning algorithm.''\ Construction and Building Materials , 299
work page 2021
-
[8]
Leppinen, J., Punkka, A., Ekholm, T., and Salo, A. (2025). ``An optimization model for determining cost-efficient maintenance policies for multi-component systems with economic and structural dependencies.''\ Omega (United Kingdom) , 130
work page 2025
Show all 28 references
-
[9]
Liu, C., Geng, N., Aggarwal, V., Lan, T., Yang, Y., and Xu, M. (2021). ``Cmix: Deep multi-agent reinforcement learning with peak and average constraints.''\ Machine Learning and Knowledge Discovery in Databases. Research Track: European Conference, ECML PKDD 2021, Bilbao, Spai...
2021
-
[10]
and Madanat, S
Medury, A. and Madanat, S. (2014). ``Simultaneous network optimization approach for pavement management systems.''\ Journal of Infrastructure Systems , 20
2014
-
[11]
Mnih, V. (2013). ``Playing atari with deep reinforcement learning.''\ arXiv preprint arXiv:1312.5602
2013 arXiv
-
[12]
U., Aggarwal, V., and Ukkusuri, S
Mondal, W. U., Aggarwal, V., and Ukkusuri, S. V. (2024). ``Mean-field approximation of cooperative constrained multi-agent reinforcement learning (cmarl).''\ Journal of Machine Learning Research , 25(260), 1--33
2024
-
[13]
Peng, B., Rashid, T., Schroeder de Witt, C., Kamienny, P.-A., Torr, P., B \"o hmer, W., and Whiteson, S. (2021). ``Facmac: Factored multi-agent centralised policy gradients.''\ Advances in Neural Information Processing Systems , 34, 12208--12221
2021
-
[14]
and Hegazy, T
Rashedi, R. and Hegazy, T. (2016). ``Holistic analysis of infrastructure deterioration and rehabilitation using system dynamics.''\ Journal of Infrastructure Systems , 22
2016
-
[15]
S., Farquhar, G., Foerster, J., and Whiteson, S
Rashid, T., Samvelyan, M., De Witt, C. S., Farquhar, G., Foerster, J., and Whiteson, S. (2020). ``Monotonic value function factorisation for deep multi-agent reinforcement learning.''\ Journal of Machine Learning Research , 21(178), 1--51
2020
-
[16]
Rocchetta, R., Bellani, L., Compare, M., Zio, E., and Patelli, E. (2019). ``A reinforcement learning framework for optimal operation and maintenance of power grids.''\ Applied Energy , 241, 291--301
2019
-
[17]
E., Power, G
Sasai, K., Chouinard, L. E., Power, G. J., Conciatori, D., and Zufferey, N. (2024). ``Decision-making for road infrastructures in a network based on a policy gradient method.''\ Infrastructure Asset Management , 1--11
2024
-
[18]
J., Hostallero, D
Son, K., Kim, D., Kang, W. J., Hostallero, D. E., and Yi, Y. (2019). ``Qtran: Learning to factorize with transformation for cooperative multi-agent reinforcement learning.''\ International conference on machine learning , PMLR, 5887--5896
2019
-
[19]
M., Zambaldi, V., Jaderberg, M., Lanctot, M., Sonnerat, N., Leibo, J
Sunehag, P., Lever, G., Gruslys, A., Czarnecki, W. M., Zambaldi, V., Jaderberg, M., Lanctot, M., Sonnerat, N., Leibo, J. Z., Tuyls, K., et al.\@ (2017). ``Value-decomposition networks for cooperative multi-agent learning.''\ arXiv preprint arXiv:1706.05296
2017 arXiv
-
[20]
Sutton, R. S. and Barto, A. G. (2018). Reinforcement learning: An introduction . MIT press
2018
-
[21]
Xu, J., Liu, B., Zhao, X., and Wang, X. L. (2024). ``Online reinforcement learning for condition-based group maintenance using factored markov decision processes.''\ European Journal of Operational Research , 315, 176--190
2024
-
[22]
S., Cawley, L., Reza, I., and Ksaibati, K
Yamany, M. S., Cawley, L., Reza, I., and Ksaibati, K. (2024). ``Network-level pavement maintenance and rehabilitation planning using genetic algorithm.''\ Innovative Infrastructure Solutions , 9
2024
-
[23]
Yang, D. Y. (2022). ``Adaptive risk-based life-cycle management for large-scale structures using deep reinforcement learning and surrogate modeling.''\ Journal of Engineering Mechanics , 148
2022
-
[24]
Yang, Y., Hao, J., Liao, B., Shao, K., Chen, G., Liu, W., and Tang, H. (2020). ``Qatten: A general framework for cooperative multiagent reinforcement learning.''\ arXiv preprint arXiv:2002.03939
2020 arXiv
-
[25]
and Si, W
Zhang, N. and Si, W. (2020). ``Deep reinforcement learning for condition-based maintenance planning of multi-component systems under dependent competing risks.''\ Reliability Engineering and System Safety , 203
2020
-
[26]
T., Wang, Z., and Zhang, S
Zhang, Y., Zhang, D., Zhang, X., Qiu, L., Chan, F. T., Wang, Z., and Zhang, S. (2023). ``Guided probabilistic reinforcement learning for sampling-efficient maintenance scheduling of multi-component system.''\ Applied Mathematical Modelling , 119, 677--697
2023
-
[27]
G., Stoffels, S., and McNeil, S
Zhou, W., Miller-Hooks, E., Papakonstantinou, K. G., Stoffels, S., and McNeil, S. (2022a). ``A reinforcement learning method for multiasset roadway improvement scheduling considering traffic impacts.''\ Journal of Infrastructure Systems , 28
2022
-
[28]
Zhou, Y., Li, B., and Lin, T. R. (2022b). ``Maintenance optimisation of multicomponent systems using hierarchical coordinated reinforcement learning.''\ Reliability Engineering and System Safety , 217
2022
Reviewed August 6, 2026 · model on record in the stance chip above.
Discussion (0). Continue with ORCID to comment.