REVIEW 4 major objections 5 minor 18 references
A model reading digital breast tomosynthesis scans predicts five-year breast cancer risk with an AUROC of 0.80.
Reviewed by Pith at T0; open to challenge. T0 means a machine referee read the full paper against a public rubric. the ladder, T0–T4 →
A DINOv2-feature-based model predicts five-year breast cancer risk from screening DBT with AUROC 0.80.
T0 review reviewed 2026-08-05 challenge →
load-bearing objection A plausible but not yet trustworthy proof-of-concept for DBT-based 5-year risk prediction; the headline AUROC is only as solid as the unvalidated LLM-extracted diagnosis dates, and the evaluation has a few loosenable seams. the 4 major comments →
Towards Early Detection: AI-Based Five-Year Forecasting of Breast Cancer Risk Using Digital Breast Tomosynthesis Imaging
The pith
A machine-rendered reading of the paper's core claim, the machinery that carries it, and where it could break.
The reading
Core claim
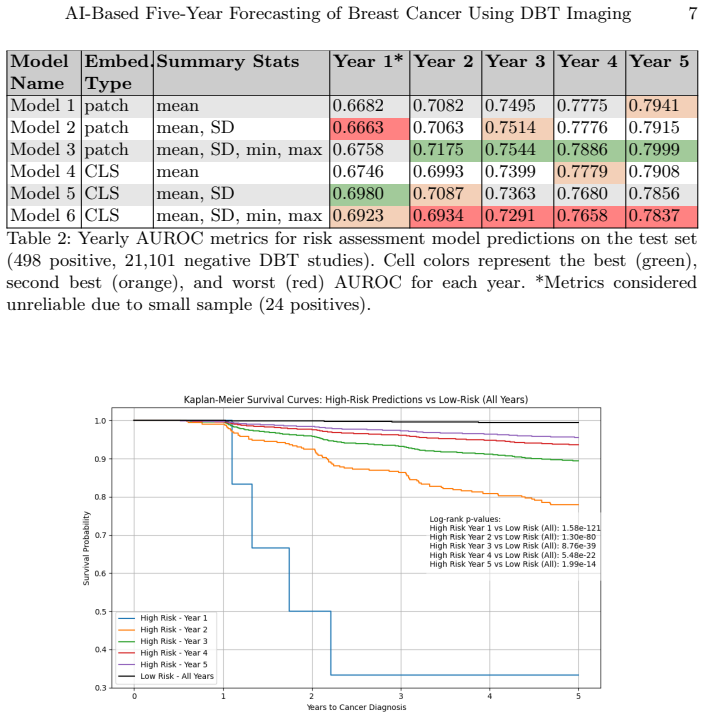
The central claim is that future breast cancer diagnosis is predictable from the images in a current screening DBT study. A positive exam is one performed within five years before a biopsy-confirmed diagnosis; years without follow-up are masked. The best model feeds patch-token statistics from the frozen DINOv2 encoder into a linear cumulative hazard head and reaches an AUROC of 0.80 over the five-year horizon on held-out data (498 positive, 21,101 negative studies). The paper also shows Kaplan-Meier separation between predicted low- and high-risk groups, and reports that performance persists across breast-density subgroups, with the caveat that some density categories have very few positive
What carries the argument
The mechanism is a two-stage pipeline. First, each 2D slice of every DBT series is resized and passed through DINOv2, a self-supervised vision transformer pre-trained on natural images; the model's CLS and patch tokens are aggregated with summary statistics (mean, standard deviation, minimum, maximum) across slices and across the four standard views (RCC, LCC, RMLO, LMLO). Second, the resulting study-level vector goes into a cumulative hazard layer: a fully connected layer whose logits are passed through softplus, cumulatively summed, and normalized, which forces the predicted five-year risks to be monotonically nondecreasing and gives an estimate of the probability of being diagnosed in or
Load-bearing premise
The model's ground-truth cancer labels are built from diagnosis dates extracted by a large language model from pathology reports, and the paper reports no check of those dates' accuracy; a systematic error there would change the labels, the masking, and the reported risk scores.
What would settle it
Manually review a random sample of about 100 pre-cancer pathology reports, compare the LLM-extracted diagnosis date to the date of biopsy specimen collection, then rerun the test-set evaluation with corrected labels; if the AUROC drops materially below 0.80, the reported result depends on unvalidated label extraction.
If this is right
- If confirmed, DBT-only risk scores could help set personalized screening intervals, sending higher-risk women back sooner.
- The performance parity with published 2D mammography models implies that tomosynthesis, already common in screening, can carry the same predictive signal without requiring legacy 2D exams.
- The frozen-encoder design means the model can be adapted to new sites or new scanners at modest computational cost, since only the small hazard head needs retraining.
- The reported AUROCs for years 2–5 improve as the horizon lengthens, suggesting the model is better at identifying women who will eventually develop cancer than at pinpointing the exact year.
- The paper's own labeling note flags year-1 results as unreliable due to only 24 positive test cases, so early-year risk estimates are the least established component.
Where Pith is reading between the lines
- Because the only ground-truth source for diagnosis timing is an unvalidated LLM extraction from pathology reports, the single most informative next experiment is a manual audit of those dates; the paper's headline AUROC cannot be fully interpreted until that audit is done.
- A self-supervised DBT-specific encoder would likely outperform the frozen natural-image DINOv2 features, since DBT volumes are pseudo-3D and DINOv2 was trained on 2D photographs; this is testable by comparing the current hazard head on DINOv2 features against the same head trained on features from a DBT-pretrained encoder.
- The four summary statistics over all patches are a crude spatial compression; attention-based multiple-instance pooling over DBT slices could preserve focal lesion information and is a concrete variant the authors themselves flag for future work.
- If the approach generalizes beyond the predominantly White, single-health-system dataset, it could be combined with clinical risk factors such as age, density, and family history in a multimodal model, which the paper notes as planned but does not test.
Editorial analysis
A structured set of objections, weighed in public.
Referee Report
Summary. The paper proposes a deep-learning pipeline for five-year breast cancer risk prediction from screening digital breast tomosynthesis (DBT) examinations. Using 161,753 DBT studies from 50,590 patients, the authors extract per-frame DINOv2 embeddings, aggregate them with summary statistics across the four standard views, and train a cumulative-hazard linear layer that outputs per-year risk probabilities. The best model is reported to achieve a year-5 AUROC of 0.7999 on a patient-disjoint held-out test set, and Kaplan-Meier curves are used to show separation of predicted risk groups. The paper also provides density-subgroup AUROC values and discusses future work toward task-specific encoders and multimodal clinical risk factors.
Significance. If the reported results hold, this would be a meaningful contribution: it is one of the first DBT-based five-year risk-prediction models and uses an unusually large real-world screening cohort with a patient-level split. Concrete strengths include the use of a held-out test set, the masking strategy to handle variable follow-up, the precomputed DINOv2 embeddings that facilitate reproducibility, and explicit reporting of cohort demographics and limitations. However, the central performance claim depends on unvalidated LLM-extracted diagnosis dates, and the paper does not describe a validation-based model-selection protocol or report confidence intervals. These issues need to be addressed before the 0.80 AUROC claim can be fully trusted.
major comments (4)
- [2.1] The ground-truth labels, the sliding-window masks in Eq. (1), the six-month exclusion window, and the year-to-cancer counts in Table 1 all depend on diagnosis dates extracted by the Qwen 2.5 72B LLM from pathology reports. No validation of these dates is reported: no manual review, no comparison against structured EHR or pathology sign-out dates, and no error analysis. A systematic offset in the extracted dates (e.g., sign-out date versus biopsy date, or parsing errors) would shift studies across the five-year boundary and change the composition of the validation/test sets through the 6-month exclusion. The masked BCE loss in Eq. (3) and the reported AUROCs would then be computed against shifted labels. Please provide a validation of the LLM extraction on a random sample, with error rates by year and by report type, and a sensitivity analysis where dates are perturbed by plausible offset
- [3 / Table 2] The paper compares six embedding variants but does not state how Model 3 was selected. If Model 3 was chosen after inspecting test-set AUROC values in Table 2, the reported 0.7999 is optimistically biased and is not a pure held-out estimate. A clear validation-based selection rule (e.g., best validation loss or validation AUROC, with the chosen model fixed before test evaluation) should be described. If the selection was in fact test-based, the paper should either re-report using a locked validation split or otherwise correct for selection bias.
- [3 / Fig. 2] The Kaplan-Meier analysis uses a binarization threshold of 0.3027 'computed by maximizing Youden’s J-statistic.' If this threshold was optimized on the test predictions, the displayed risk-group separation is in-sample and overstates stratification performance. The threshold should be fixed using validation data only, and the test-set curves should be reported with confidence intervals. The same issue affects any claim in the text that the model 'efficiently stratifies' DBT studies into risk groups.
- [3 / Discussion] The statement that the model's performance is 'comparable to state-of-the-art risk models [16]' is not supported by any head-to-head comparison, confidence intervals, or external validation. Since the introduction motivates the work by the modest accuracy of clinical risk models and the promise of imaging-based models, a comparison to at least one established model (e.g., Tyrer-Cuzick or a mammography-based model) with matched outcome definitions would materially strengthen the central claim. At minimum, the comparison should be tempered or explicitly labeled as indirect.
minor comments (5)
- [Table 2] The year-1 AUROC values are based on only 24 positive test cases. The footnote correctly flags this as unreliable, but the main text still lists these values without further qualification; consider reporting them only in a supplementary table or aggregating year-1 predictions into a broader early-risk metric.
- [Table 3] Several density-subgroup AUROC cells are based on very small positive counts (e.g., density a and d). The 'interpret with caution' note is appropriate, but confidence intervals would help readers judge whether subgroup differences are meaningful.
- [2.2] The dimensionality reduction step computes mean, standard deviation, minimum, and maximum across patches and frames. This is a coarse aggregation that may discard spatial information, as the authors acknowledge in the Discussion. It would be helpful to state the resulting feature vector dimension and to clarify whether the summary statistics are computed jointly over all frames or per series before stacking.
- [2.1] The healthy cohort definition requires 'at least one year of screening follow-up.' This is a reasonable exclusion, but the exact rule for determining follow-up from EHR data (e.g., last screening date versus last clinical contact) should be stated, since it affects the negative label reliability.
- [Global] Minor typographical and formatting issues are present (e.g., 'aDBT study' in Section 2.1, inconsistent spacing around equations). These do not affect the science but should be corrected in revision.
Circularity Check
Central AUROC derivation is self-contained; a secondary Kaplan-Meier stratification uses a threshold fitted to test outcomes, causing partial circularity in that visualization only.
specific steps
-
fitted input called prediction
[Figure 2 caption / Section 3]
"Kaplan-Meier survival curves showing the estimated cancer-free survival probabilities over 5 years for different risk groups based on model 3 predictions on test set data. ... A binarization threshold for all years (0.3027) was computed by maximizing Youden's J-statistic."
The threshold defining 'High Risk' versus 'Low Risk' is optimized on the exact test-set outcomes (Youden's J maximizes sensitivity plus specificity against the true cancer labels), and the same test data are then used to draw the KM curves and to claim 'a clear separation between cancer-free survival in each group' and 'the model's ability to efficiently stratify.' The separation shown is therefore an in-sample consequence of the cutpoint choice, not an independent out-of-sample prediction. This does not affect the headline 5-year AUROC (0.7999), which is computed from continuous risk scores without a test-set threshold.
full rationale
The paper's central derivation is standard supervised learning: DBT studies are labeled by diagnosis date, features are extracted with the pre-trained DINOv2 encoder, a cumulative-hazard linear layer is trained with masked BCE loss, and AUROC is reported on a patient-disjoint held-out test set. I found no self-definitional reduction: the labels, masks, and loss (Eqs. 1-3) do not contain the model's risk scores, and the AUROC is not a fitted parameter. The only substantive circular element I could support with a direct quote is the Kaplan-Meier analysis in Figure 2, where the binarization threshold is computed by maximizing Youden's J on the test data and then used to demonstrate risk-group separation. That is a secondary visualization claim, not the basis of the headline 0.80 AUROC. The unvalidated LLM-derived diagnosis dates are a data-quality and label-reliability concern, but they are not circular in the derivation sense. The lack of a stated validation-based rule for choosing among the six models in Table 2 is a potential selection-over-test concern, but I do not have direct evidence that selection was made on test results, so I do not count it as demonstrated circularity. Overall, the central claim has independent content and is not forced by definition or by a self-citation chain.
Axiom & Free-Parameter Ledger
free parameters (3)
- Patch embedding summary statistics (mean, SD, min, max) =
Model 3
- Exclusion window (6 months before diagnosis; 1 year healthy follow-up) =
6 months / 1 year
- Binarization threshold for risk groups =
0.3027
axioms (4)
- domain assumption Qwen 2.5 72B produces accurate biopsy-confirmed diagnosis dates
- domain assumption Screening DBT images contain predictive signal for cancer in the next five years
- domain assumption The cumulative hazard layer's monotonicity constraint (Eq. 2) correctly models risk
- domain assumption Masking correctly handles censoring (years without follow-up are missing at random)
Cite this review
Pith. "Pith review of Towards Early Detection: AI-Based Five-Year Forecasting of Breast Cancer Risk Using Digital Breast Tomosynthesis Imaging." pith.science (2026). https://pith.science/paper/PVIV6VTS
@misc{pith2026250900900,
  author       = {Pith},
  title        = {Pith review of: Towards Early Detection: AI-Based Five-Year Forecasting of Breast Cancer Risk Using Digital Breast Tomosynthesis Imaging},
  year         = {2026},
  howpublished = {\url{https://pith.science/paper/PVIV6VTS}},
  note         = {Machine review of arXiv:2509.00900}
}
read the original abstract
As early detection of breast cancer strongly favors successful therapeutic outcomes, there is major commercial interest in optimizing breast cancer screening. However, current risk prediction models achieve modest performance and do not incorporate digital breast tomosynthesis (DBT) imaging, which was FDA-approved for breast cancer screening in 2011. To address this unmet need, we present a deep learning (DL)-based framework capable of forecasting an individual patient's 5-year breast cancer risk directly from screening DBT. Using an unparalleled dataset of 161,753 DBT examinations from 50,590 patients, we trained a risk predictor based on features extracted using the Meta AI DINOv2 image encoder, combined with a cumulative hazard layer, to assess a patient's likelihood of developing breast cancer over five years. On a held-out test set, our best-performing model achieved an AUROC of 0.80 on predictions within 5 years. These findings reveal the high potential of DBT-based DL approaches to complement traditional risk assessment tools, and serve as a promising basis for additional investigation to validate and enhance our work.
Figures

Reference graph
Works this paper leans on
-
[1]
Bevers, T.B., et al.: Breast cancer risk reduction, version 2.2015. J Natl Compr Canc Netw (2015)
work page 2015
-
[2]
Brown, A.L., Vijapura, C., Patel, M., Cruz, A.D.L., Wahab, R.: Breast cancer in dense breasts: Detection challenges and supplemental screening opportunities. RSNA (2023). https://doi.org/10.1148/rg.230024
-
[3]
Computer Vision and Pattern Recognition (2021)
Caron, M., et al.: Emerging properties in self-supervised vision transformers. Computer Vision and Pattern Recognition (2021). https://doi.org/10.1109/ ICCV48922.2021.00951
arXiv 2021
-
[4]
Dadsetan, S., Arefan, D., Berg, W.A., Zuley, M.L., Sumkin, J.H., Wu, S.: Deep learning of longitudinal mammogram examinations for breast cancer risk predic- tion. Pattern Recognition (2022)
work page 2022
-
[5]
Science Translational Medicine (2022)
Eriksson, M., et al.: A risk model for digital breast tomosynthesis to predict breast cancer and guide clinical care. Science Translational Medicine (2022)
work page 2022
-
[6]
In: Proceedings of the 35th International Conference on Machine Learning
Ilse, M., Tomczak, J.M., Welling, M.: Attention-based deep multiple instance learn- ing. In: Proceedings of the 35th International Conference on Machine Learning. vol. 80. PMLR, Stockholm, Sweden (2018)
work page 2018
-
[7]
Karaman, B.K., Dodelzon, K., Akar, G.B., Sabuncu, M.R.: Longitudinal mammo- gram risk prediction. MICCAI (2024)
work page 2024
-
[8]
Lee, H., et al.: Enhancing breast cancer risk prediction by incorporating prior images. MICCAI (2023)
work page 2023
-
[9]
JAMA Oncology (2016).https://doi.org/10.1001/jamaoncol.2015.5536
McDonald, E.S., et al.: Effectiveness of digital breast tomosynthesis compared with digital mammography - outcomes analysis from 3 years of breast cancer screening. JAMA Oncology (2016).https://doi.org/10.1001/jamaoncol.2015.5536
arXiv 2016
-
[10]
Transactions on Machine Learning Research (2024).https://doi.org/10.48550/ arXiv.2304.07193
Oquab, M., et al.: Dinov2: Learning robust visual features without supervision. Transactions on Machine Learning Research (2024).https://doi.org/10.48550/ arXiv.2304.07193
-
[11]
Organization, W.H.: Global cancer burden growing, amidst mounting need for services, https://www.who.int/news/item/ 01-02-2024-global-cancer-burden-growing--amidst-mounting-need-for-services , accessed: 2025-03-12 10 Manon A. Dorster
work page 2024
-
[12]
Reference article, Radiopaedia.org
T, R., A, M., B, D.M., et al.: Breast density (classification). Reference article, Radiopaedia.org. https://doi.org/10.53347/rID-12808, accessed: 2025-06-23
-
[13]
Statistics in Medicine (2004).https://doi.org/ 10.1002/sim.1668
Tyrer, J., Duffy, S.D., Cuzick, J.: A breast cancer prediction model incorporating familial and personal risk factors. Statistics in Medicine (2004).https://doi.org/ 10.1002/sim.1668
-
[14]
Wang, X., Tan, T., Gao, Y., Marcus, E., Han, L., Portaluri, A., Zhang, T., Lu, C., Liang, X., Beets-Tan, R., Teuwen, J., Mann, R.: Ordinal learning: Longitudinal attention alignment model for predicting time to future breast cancer events from mammograms. MICCAI (2024)
work page 2024
-
[15]
Wang, X., Tan, T., Gao, Y., Su, R., Zhang, T., Han, L., Teuwen, J., D’Angelo, A., Drukker, C.A., Schmidt, M.K., Beets-Tan, R., Karssemeijer, N., Mann, R.: Predict- ing up to 10 year breast cancer risk using longitudinal mammographic screening history. medRxiv (2023)
work page 2023
-
[16]
Science Translational Medicine (2021).https://doi.org/ 10.1126/scitranslmed.aba4373
Yala, A., Mikhael, P.G., Strand, F., Lin, G., Smith, K., Wan, Y.L., Lamb, L., Hughes, K., Lehman, C., Barzilay, R.: Toward robust mammography-based models for breast cancer risk. Science Translational Medicine (2021).https://doi.org/ 10.1126/scitranslmed.aba4373
-
[17]
Yang, et al.: Qwen 2.5.https://github.com/QwenLM/Qwen2.5, accessed: 2025-06- 24
work page 2025
-
[18]
Zonderland, H., Smithuis, R.: Bi-rads for mammography and ultrasound 2013 - updated version. https://radiologyassistant.nl/breast/bi-rads/ bi-rads-for-mammography-and-ultrasound-2013 , accessed: 2025-06-24
work page 2013
This paper was first reviewed by deepseek-v4-flash on August 5, 2026.
discussion (0)
Sign in with ORCID, Apple, or X to comment. Anyone can read and Pith papers without signing in.