REVIEW 4 major objections 5 minor 1 cited by
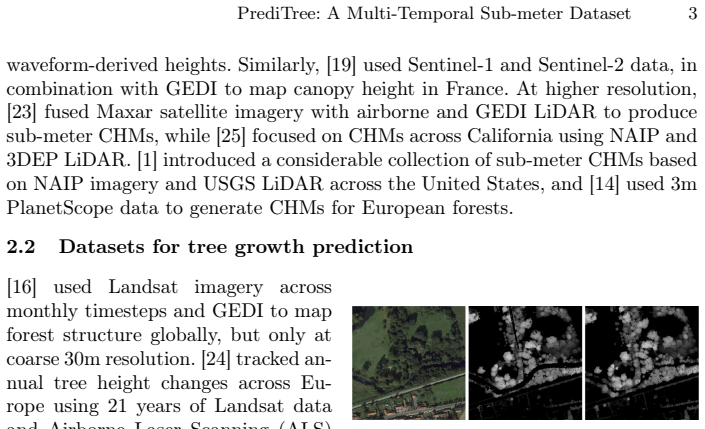
PrediTree is presented as the first openly available dataset pairing sub-meter multi-temporal RGB-NIR imagery with later LiDAR-derived canopy height maps, letting models predict tree height from past observations.
Reviewed by Pith at T0; open to challenge. T0 means a machine referee read the full paper against a public rubric. the ladder, T0–T4 →
A sub-meter, multi-temporal, multi-spectral canopy height dataset for training tree height prediction models, released openly with benchmark results.
T0 review reviewed 2026-08-05 challenge →
load-bearing objection PrediTree's dataset claim (first open sub-meter multi-temporal multi-spectral CHM dataset) holds up on inspection, but the paper's experimental reporting is sloppy and the target CHM year is an unanalyzed tile-level mean that could bias the growth labels. the 4 major comments →
PrediTree: A Multi-Temporal Sub-meter Dataset of Multi-Spectral Imagery Aligned With Canopy Height Maps
The pith
A machine-rendered reading of the paper's core claim, the machinery that carries it, and where it could break.
The reading
Core claim
The central claim is that the task of tree growth prediction—forecasting future canopy height from past observations—can be supported by a public dataset in which multi-spectral aerial imagery at three past times is spatially aligned with a later 0.5 m LiDAR canopy height map. The paper constructs this dataset from French national LiDAR and orthophoto data, derives canopy height by subtracting a smoothed terrain model from the surface model, merges overlapping tiles, and keeps three random timestamps for departments with more than three. The companion model encodes each timestamp's RGB-NIR-NDVI stem features, fuses them across time, injects the relative year gaps between each image and the t
What carries the argument
The load-bearing object is the temporal pairing itself: each sample consists of three 256 by 256, 0.5 m images with five bands (RGB, NIR, NDVI) acquired at times t1, t2, and t3, plus a spatially aligned canopy height map at a later time ty, together with the relative time differences Δti = ty − ti. The model is an encoder-decoder: per-timestamp stem encoders produce spatial features, a spatio-temporal fusion block combines them, and embeddings of the Δt values are fused in to condition the prediction on how much growth time has elapsed; a weighted masked MSE loss concentrates learning on vegetation pixels. The Δt conditioning is what turns static height estimation into growth prediction.
Load-bearing premise
The model's notion of growth time is only as accurate as the year attached to the target canopy height map, which is computed as the mean acquisition year of merged LiDAR tiles; if those tiles were captured in different years, the time gaps Δt are wrong and the learned 'growth' signal is corrupted.
What would settle it
For any PrediTree tile, look up the original LiDAR tile acquisition years instead of the merged mean; recompute the model's Δt inputs with the true dates and compare predictions. If replacing the mean-year label with exact acquisition years produces materially different height predictions, the dataset's temporal reference does not support the claimed growth modeling; if results are unchanged, the approximation is harmless.
If this is right
- Tree height at a future time can be predicted without future LiDAR, using only historical multi-spectral imagery and elapsed time, if the dataset's pairing is learned.
- The relative-time conditioning makes the same trained model applicable to sites whose snapshots are separated by 1–3 years, not just the exact dates in the dataset.
- The public processing pipeline lets users regenerate the dataset at 0.15–0.5 m resolutions and extend it to other French departments, so the benchmark can grow beyond its current 33 departments.
- The ablation results imply that adding spectral bands (RGB, NIR, NDVI) and more timestamps improves prediction, giving a concrete recipe for future growth models.
- If it is truly the first open sub-meter multi-temporal LiDAR-CHM dataset, PrediTree becomes the natural training and evaluation ground for crown-level growth forecasting.
Where Pith is reading between the lines
- Because the target year is the mean acquisition year of merged LiDAR tiles, the effective Δt values are uncertain to about half the spread of the merged tiles; growth measured over 1–3 years may be confounded unless the actual per-tile years are used or validated.
- The reported model results come from 30k training samples of 785k; the architecture ranking could shift on the full dataset, and the dataset's quality as a benchmark will depend on standardized train/test splits that use exact tile metadata.
- One testable extension is to feed the model a future image and ask it to output the height change between two historical dates, using the same Δt encoding; the dataset could then be evaluated for change detection as well as forward prediction.
- Linking PrediTree-style imagery to process-based growth models like the 3-PG lineage mentioned in the paper may let machine-learned growth predictions be constrained by physiological plausibility, reducing the need for massive paired LiDAR coverage.
Editorial analysis
A structured set of objections, weighed in public.
Referee Report
Summary. PrediTree introduces a new open dataset pairing sub-meter (0.5 m) LiDAR-derived canopy height maps with multi-temporal, multi-spectral (RGB, NIR, NDVI) aerial imagery from 33 French departments, totaling over 3.1M aligned 256x256 tiles. The paper also proposes an encoder-decoder framework that ingests three past image timestamps plus relative year differences Δt_i = t_y − t_i and predicts a canopy height map at a later target time t_y. Experiments compare U-Net and several DeepLabv3-based encoders on a 30K-sample training subset and 393-sample test set, and ablations study spectral-band and temporal-input contributions. The central claim is that PrediTree is the first openly available dataset enabling sub-meter, multi-temporal tree-height prediction from historical imagery.
Significance. If the dataset construction is reliable, PrediTree would fill a real gap: existing high-resolution CHM datasets are mostly single-timestamp, while multi-temporal products are typically at 10–30 m resolution. The dataset is large, openly released, and accompanied by processing and training code, which are concrete strengths for reproducibility. The proposed temporal-conditioning formulation is natural and the ablation design is informative. However, the paper's central value depends on the accuracy of the target CHM timestamp t_y: the model's temporal supervision signal is the relative time difference between each image and the CHM, so any error in t_y directly propagates into the growth labels. The manuscript does not currently quantify or mitigate this error, and the experimental reporting contains errors that undermine confidence in the quantitative claims.
major comments (4)
- The target timestamp t_y is defined as the mean acquisition year across all merged CHM tiles, while overlapping tiles are merged by 'taking the most recent data at the overlap location.' This means different pixels within one CHM tile can originate from LiDAR flights in different years, and the scalar t_y cannot represent all of them. Since the model uses Δt_i = t_y − t_i as temporal conditioning, per-pixel errors in t_y directly corrupt the growth signal the dataset is designed to provide. The paper gives no distribution of LiDAR acquisition years within merged tiles, no statistics on within-tile timestamp spread, and no sensitivity analysis. Please either provide per-pixel acquisition timestamps or metadata that allows users to construct them, restrict the dataset to tiles with sufficiently homogeneous acquisition years, or otherwise demonstrate that the mean-year approximation does no
- The abstract states that U-Net 'provides the highest masked mean squared error of 11.78%,' but Table 2 reports U-Net's MSE as 6.47% and MAE as 11.78%. The number 11.78 is the MAE, not the MSE, and 'highest' should be 'lowest' since lower errors are better. This is not a typo in isolation: the conclusion section repeats the framing, and readers cannot tell which metric is being claimed. The abstract must be corrected to report MSE and MAE separately with the correct direction of comparison.
- All model comparisons and ablations are based on a single training run on a 393-sample test set, with no repeated seeds, confidence intervals, or statistical tests. Differences such as U-Net MSE 6.47 vs. ResNet-50 MSE 7.37 may be real, but with a small test set and no variance estimate the ranking is not established. Please add at least three seeds with mean±std, or a statistical test, and report test-set size and selection procedure. This is load-bearing for the claim that U-Net 'outperforms' the alternatives.
- Training uses a weighted masked MSE with constants k=10 and θ=0.5 m, while inference reports unweighted masked MSE and MAE restricted to pixels with y > θ. The relationship between the training objective and the reported metrics is clear, but the paper does not state whether θ is applied consistently in all reported metrics or how much of the 393 test tiles consists of tree pixels. Without the valid-pixel fraction, the absolute error values are hard to interpret. Please report the effective number of evaluated pixels per test sample and the fraction of masked pixels.
minor comments (5)
- The phrase 'cutting the error of the same experiments but on fewer bands (red, green, blue only), by around 30%' is ambiguous. Table 3 shows MAE reduction from 13.47 to 11.78 (about 12.5%) and MSE reduction from 9.23 to 6.47 (about 30%). Specify which metric the 30% refers to.
- Typo: 'encode the the relative time difference' should read 'encode the relative time difference.' Also 'passed to a header' should likely be 'passed to a head.'
- The captions describe only 'the first row' of each figure, but the figures contain multiple rows or panels. Please clarify what each row/panel shows, especially the color-coded detection row in Figure 6.
- The ablation table denotes timestamp sets with subscripts but the text sometimes says 't 1, t2, t3' without subscript formatting. Use consistent notation, and define whether 'Timestamps' refers to the number of input images or which specific acquisition years are used.
- The reference for the IGN LiDAR HD data is cited as a URL accessed March 2025. Consider adding a formal data citation with version or DOI if available.
Circularity Check
No circularity: the dataset is constructed from external IGN data and the model is evaluated on held-out tiles.
full rationale
This paper is a dataset-and-benchmark contribution, not a derivation whose conclusion is equivalent to its inputs. The multi-spectral imagery and LiDAR CHMs are sourced from external IGN data; the CHM is produced by subtracting a smoothed DTM from a DSM, independent of the imagery used as model inputs. The prediction target is the CHM at t_y, and inputs are past images plus relative time offsets; there is no equation in which the target is defined in terms of the inputs. The models are trained on a 30K subset and tested on 393 held-out samples, so the reported MSE/MAE are genuine out-of-sample numbers. No fitted parameter is renamed as a prediction, no self-citation carries an argument, and no uniqueness or ansatz is imported from prior work by the authors. The skeptical concern about using a mean LiDAR acquisition year as the CHM timestamp affects the accuracy of the Δt conditioning and is a data-quality limitation, not circularity: even if the timestamp approximation is crude, the evaluation remains a comparison against held-out CHM values. Therefore the paper has no significant circularity.
Axiom & Free-Parameter Ledger
free parameters (3)
- loss weighting constants k and theta =
k=10, theta=0.5m
- DTM smoothing filter side length =
10m
- target resolution =
0.5m
axioms (4)
- domain assumption IGN LiDAR point cloud classification into ground and vegetation points is accurate.
- domain assumption The orthophoto and LiDAR tiles are precisely georeferenced and sub-meter alignment is achieved by resampling.
- domain assumption CHM derived as DSM minus smoothed DTM represents true canopy height.
- ad hoc to paper The mean acquisition year across merged CHM tiles is a valid target timestamp ty.
Cite this review
Pith. "Pith review of PrediTree: A Multi-Temporal Sub-meter Dataset of Multi-Spectral Imagery Aligned With Canopy Height Maps." pith.science (2026). https://pith.science/paper/ZZR73HSO
@misc{pith2026250901202,
  author       = {Pith},
  title        = {Pith review of: PrediTree: A Multi-Temporal Sub-meter Dataset of Multi-Spectral Imagery Aligned With Canopy Height Maps},
  year         = {2026},
  howpublished = {\url{https://pith.science/paper/ZZR73HSO}},
  note         = {Machine review of arXiv:2509.01202}
}
abstract
We present PrediTree, the first comprehensive open-source dataset designed for training and evaluating tree height prediction models at sub-meter resolution. This dataset combines very high-resolution (0.5m) LiDAR-derived canopy height maps, spatially aligned with multi-temporal and multi-spectral imagery, across diverse forest ecosystems in France, totaling 3,141,568 images. PrediTree addresses a critical gap in forest monitoring capabilities by enabling the training of deep learning methods that can predict tree growth based on multiple past observations. To make use of this PrediTree dataset, we propose an encoder-decoder framework that requires the multi-temporal multi-spectral imagery and the relative time differences in years between the canopy height map timestamp (target) and each image acquisition date for which this framework predicts the canopy height. The conducted experiments demonstrate that a U-Net architecture trained on the PrediTree dataset provides the highest masked mean squared error of $11.78\%$, outperforming the next-best architecture, ResNet-50, by around $12\%$, and cutting the error of the same experiments but on fewer bands (red, green, blue only), by around $30\%$. This dataset is publicly available on https://huggingface.co/datasets/hiyam-d/PrediTree, and both processing and training codebases are available on {GitHub}.
Figures


Forward citations
Cited by 1 Pith paper
-
Biomazon: A Multimodal Dataset for 3D Forest Structure and Biomass Modeling in the Amazon Basin
Biomazon is a multimodal benchmark dataset pairing GEDI RH profiles and AGBD targets with Sentinel, ALOS, DEM, and other predictors for joint 3D forest structure and biomass modeling in the Amazon.
Reference graph
Works this paper leans on
-
[1]
Scientific Data12(1), 322 (2025)
Allred, B.W., McCord, S.E., Morford, S.L.: Canopy height model and naip imagery pairs across conus. Scientific Data12(1), 322 (2025)
work page 2025
-
[2]
Global change biology20(10), 3177–3190 (2014)
Chave, J., et al.: Improved allometric models to estimate the aboveground biomass of tropical trees. Global change biology20(10), 3177–3190 (2014)
work page 2014
-
[3]
arXiv preprint arXiv:1706.05587 (2017)
Chen, L.C., Papandreou, G., Schroff, F., Adam, H.: Rethinking atrous convolution for semantic image segmentation. arXiv preprint arXiv:1706.05587 (2017)
Pith/arXiv arXiv 2017
-
[4]
In: Proceedings of the IEEE CVPR
Chollet, F.: Xception: Deep learning with depthwise separable convolutions. In: Proceedings of the IEEE CVPR. pp. 1251–1258 (2017)
work page 2017
-
[5]
Remote Sensing of Environment270, 112845 (2022)
Duncanson,L.,Kellner,J.R.,etal.:Abovegroundbiomassdensitymodelsfornasa’s global ecosystem dynamics investigation (gedi) lidar mission. Remote Sensing of Environment270, 112845 (2022)
work page 2022
-
[6]
Open-Canopy: Towards Very High Resolution Forest Monitoring
Fogel, F., et al.: Open-canopy: A country-scale benchmark for canopy height esti- mation at very high resolution. arXiv preprint arXiv:2407.09392 (2024)
work page internal anchor Pith review Pith/arXiv arXiv 2024
-
[7]
In: Proceedings of the IEEE CVPR
He, K., Zhang, X., Ren, S., Sun, J.: Deep residual learning for image recognition. In: Proceedings of the IEEE CVPR. pp. 770–778 (2016)
work page 2016
-
[8]
IGN: Diffusion Lidar HD IGN.https://diffusion-lidarhd.ign.fr/(2025), [On- line; accessed 3-March-2025]
work page 2025
-
[9]
Environmental Research: Ecology 3(4), 045002 (2024)
Kwon, T., Shibata, H., Takemi, T., Takagi, K.: Canopy height damage by typhoon songda in northern hokkaido, japan, in 2004. Environmental Research: Ecology 3(4), 045002 (2024)
work page 2004
-
[10]
Forest ecology and management95(3), 209–228 (1997)
Landsberg, J., Waring, R.: A generalised model of forest productivity using sim- plified concepts of radiation-use efficiency, carbon balance and partitioning. Forest ecology and management95(3), 209–228 (1997)
work page 1997
-
[11]
Nature Ecology & Evolution7(11), 1778–1789 (2023) PrediTree: A Multi-Temporal Sub-meter Dataset 11
Lang, N., Jetz, W., Schindler, K., Wegner, J.D.: A high-resolution canopy height model of the earth. Nature Ecology & Evolution7(11), 1778–1789 (2023) PrediTree: A Multi-Temporal Sub-meter Dataset 11
work page 2023
-
[12]
Geophysical research letters32(22) (2005)
Lefsky, M.A., Harding, D.J., Keller, M., Cohen, W.B., Carabajal, C.C., Others: Es- timates of forest canopy height and aboveground biomass using icesat. Geophysical research letters32(22) (2005)
work page 2005
-
[13]
International Journal of Applied Earth Observation and Geoinformation92, 102163 (2020)
Li, W., Niu, Z., Shang, R., Qin, Y., Wang, L., Chen, H.: High-resolution mapping of forest canopy height using machine learning by coupling icesat-2 lidar with sentinel-1, sentinel-2 and landsat-8 data. International Journal of Applied Earth Observation and Geoinformation92, 102163 (2020)
work page 2020
-
[14]
Science Advances9(37), eadh4097 (2023)
Liu, S., Brandt, M., et al.: The overlooked contribution of trees outside forests to tree cover and woody biomass across europe. Science Advances9(37), eadh4097 (2023)
work page 2023
-
[15]
Global Bio- geochemical Cycles30(11), 1639–1660 (2016)
Longo, M., Keller, M., dos Santos, M.N., Leitold, V., Pinagé, E.R., Baccini, A., Saatchi, S., Nogueira, E.M., Batistella, M., Morton, D.C.: Aboveground biomass variability across intact and degraded forests in the brazilian amazon. Global Bio- geochemical Cycles30(11), 1639–1660 (2016)
work page 2016
-
[16]
Remote Sensing of Environ- ment253, 112165 (2021)
Potapov, P., Li, X., Hernandez-Serna, A., et al.: Mapping global forest canopy height through integration of gedi and landsat data. Remote Sensing of Environ- ment253, 112165 (2021)
work page 2021
-
[17]
European Journal of Forest Research 137, 29–44 (2018)
Rohner, B., Waldner, P., Lischke, H., Ferretti, M., Thürig, E.: Predicting individual-tree growth of central european tree species as a function of site, stand, management, nutrient, and climate effects. European Journal of Forest Research 137, 29–44 (2018)
work page 2018
-
[18]
Ronneberger, O., Fischer, P., Brox, T.: U-net: Convolutional networks for biomed- ical image segmentation. In: MICCAI 2015: 18th international conference, Munich, Germany, October 5-9, 2015, proceedings, part III 18. pp. 234–241. Springer (2015)
work page 2015
-
[19]
Schwartz,M.,etal.:High-resolutioncanopyheightmapinthelandesforest(france) based on gedi, sentinel-1, and sentinel-2 data with a deep learning approach. arXiv preprint arXiv:2212.10265 (2022)
work page internal anchor Pith review Pith/arXiv arXiv 2022
-
[20]
Journal of Geophysical Research: Biogeosciences 116(G4) (2011)
Simard, M., Pinto, N., Fisher, J.B., Baccini, A.: Mapping forest canopy height globally with spaceborne lidar. Journal of Geophysical Research: Biogeosciences 116(G4) (2011)
work page 2011
-
[21]
Sinha, D., El-Sharkawy, M.: Thin mobilenet: An enhanced mobilenet architecture. In: 2019 IEEE 10th annual ubiquitous computing, electronics & mobile communi- cation conference (UEMCON). pp. 0280–0285. IEEE (2019)
work page 2019
-
[22]
In: International conference on machine learning
Tan, M., Le, Q.: Efficientnet: Rethinking model scaling for convolutional neural networks. In: International conference on machine learning. pp. 6105–6114. PMLR (2019)
2019
-
[23]
Remote Sensing of Environment300, 113888 (2024)
Tolan, J., et al.: Very high resolution canopy height maps from rgb imagery using self-supervised vision transformer and convolutional decoder trained on aerial lidar. Remote Sensing of Environment300, 113888 (2024)
work page 2024
-
[24]
Remote Sensing of Environment298, 113797 (2023)
Turubanova, S., Potapov, P., Hansen, M.C., Li, X., Tyukavina, A., Pickens, A.H., Hernandez-Serna, A., Arranz, A.P., Guerra-Hernandez, J., Senf, C., et al.: Tree canopy extent and height change in europe, 2001–2021, quantified using landsat data archive. Remote Sensing of Environment298, 113797 (2023)
work page 2001
-
[25]
Remote Sensing of Environment305, 114099 (2024)
Wagner, F.H., Roberts, S., Ritz, A.L., Carter, G., Dalagnol, R., Favrichon, S., Hirye, M.C., Brandt, M., Ciais, P., Saatchi, S.: Sub-meter tree height mapping of california using aerial images and lidar-informed u-net model. Remote Sensing of Environment305, 114099 (2024)
work page 2024
-
[26]
Webb, N.P., McCord, S.E., Edwards, B.L., Herrick, J.E., Kachergis, E., Okin, G.S., Van Zee, J.W.: Vegetation canopy gap size and height: Critical indicators for wind erosionmonitoringandmanagement.RangelandEcology&Management76,78–83 (2021)
work page 2021
This paper was first reviewed by deepseek-v4-flash on August 5, 2026.
discussion (0)
Sign in with ORCID, Apple, or X to comment. Anyone can read and Pith papers without signing in.