REVIEW 3 major objections 4 minor 108 references
This paper proves that four low-cost tests—ridge/group-LASSO regression and two canonical-correlation variants—reliably detect whether node-level covariates are associated with the latent structure of a low-rank network, even when the covar
Reviewed by Pith at T0; open to challenge. T0 means a machine referee read the full paper against a public rubric. the ladder, T0–T4 →
Four permutation tests (ridge, group LASSO, and two CCA variants) detect association between node covariates and random-dot-product-graph latent structure, with consistency theorems and cheaper computation than prior dependency tests.
T0 review reviewed 2026-08-05 challenge →
load-bearing objection Solid, useful network dependency testing toolkit with honest proofs; the abstract overclaims high-dimensional coverage for the CCA-based methods, which are fixed-p only. the 3 major comments →
Testing for correlation between network structure and high-dimensional node covariates
The pith
A machine-rendered reading of the paper's core claim, the machinery that carries it, and where it could break.
The reading
Core claim
The central discovery is that network dependency testing can be carried out consistently on estimated latent positions rather than true ones. The paper proves (Theorem 3.12) that |rho(hat X, Z) - rho(X,Z)| = oP(1) when spectral embeddings recover the latent positions with (2,infinity)-norm error xi_n = o(1); the unknown orthogonal rotation that makes hat X an estimate of X cancels because the CCA coefficient is a subspace-alignment quantity. It proves further (Theorem 3.13) that canonical correlation between the adjacency matrix itself and Z, with a ridge-style regularization gamma I on the network sample covariance, also tracks the oracle coefficient at rate OP(eta_n/sqrt(gamma n) + |gamma|
What carries the argument
The central object is the CCA alignment score rho(X,Z), the leading singular value of the normalized cross-covariance matrix Sigma_X^{-1/2} Sigma_{XZ} Sigma_Z^{-1/2}, and its plug-in analogues CCA(hat X, Z) and CCA_gamma(A,Z). The workhorse is the two-to-infinity norm spectral embedding guarantee (Assumption 2): hat X recovers X up to an orthogonal rotation with row-wise error xi_n = o(1). Because the CCA coefficient is invariant to orthogonal rotation of either data block, the unknown rotation cancels; sin-theta subspace perturbation bounds then transfer row-wise embedding error into singular-value error. For the adjacency CCA, the paper proves a pseudo-inverse lemma showing that the nonzer
Load-bearing premise
All guarantees hang on the assumption that the observed network is truly a low-rank latent-position network whose edges are independent conditional on the latent positions and concentrate as required, with the latent dimension d known: if edges are dependent or heavy-tailed, or d is misspecified, the plug-in statistics need not converge to the oracle correlation.
What would settle it
Fix a stochastic blockmodel with d=2 true latent dimensions and Bernoulli edges, set the covariates independent of X, and run the spectral-embedding CCA permutation test with d incorrectly chosen as 3; if rejection rates at nominal 5% exceed binomial sampling error substantially as n grows, Assumption 2's correct-dimension premise fails and Theorem 3.12 no longer applies. Similarly, generate weighted RDPG edges with heavy-tailed noise and check whether the deviation of the regularized adjacency-CCA statistic from the oracle stays within the eta_n, zeta_n rates claimed in Theorem 3.13.
If this is right
- Network scientists can test whether node attributes track latent structure without strong parametric assumptions, using spectral embedding plus CCA and permutation p-values.
- Ridge and group-LASSO methods remain consistent when p grows with n, with rates slowed only by the spectral embedding error xi_n, so covariate selection on network-linked data is feasible.
- The regularized adjacency CCA avoids choosing the latent dimension d, replacing a model-selection problem with a regularization parameter gamma that has a wide safe range.
- The methods are computationally cheaper than diffusion-map distance-correlation baselines, relying only on matrix-vector products and leading singular values.
- The theorems give formal level control for the permutation tests under the null in the low-rank model, and power follows against linear association (and empirically under nonlinear misspecification).
Where Pith is reading between the lines
- A testable extension the paper leaves open is replacing the sample covariance of Z in CCA(hat X, Z) with sparse or regularized CCA when p >> n; simulations suggest power would then survive high-dimensional regimes where dense CCA currently loses to LASSO.
- The proof of Theorem 3.13 relies only on concentration and subspace perturbation, not on Bernoulli edges, so the same consistency should transfer to generalized random dot product graphs and graph-root models, as the paper anticipates.
- The group-LASSO covariance test derived in Appendix F is a standalone contribution to multivariate sparse regression: it yields a closed-form first-entry alpha and test statistic without cross-validation, independent of the network setting.
- Since the plug-in CCA error is driven by xi_n, the practical bottleneck is spectral dimension selection (Remark 2.3); improving automated rank selection would strengthen all four tests more than improving covariate regularization.
Editorial analysis
A structured set of objections, weighed in public.
Referee Report
Summary. The paper introduces four (or, counting group LASSO, five) methods for testing association between observed node-level covariates and latent network structure under a low-rank latent-space model: ridge regression, (group) LASSO, CCA applied to estimated latent positions, and a regularized CCA applied directly to the adjacency matrix. The main theoretical results are Theorem 3.4 (ridge error bound), Theorem 3.8 (group-LASSO convergence rate with p allowed to grow), Theorem 3.12 (consistency of the plug-in CCA coefficient for fixed p), and Theorem 3.13 (consistency of the regularized adjacency-CCA coefficient for fixed p). The paper also contains simulations and real-data analyses using permutation tests based on these statistics.
Significance. The paper addresses a practically important problem and proposes computationally attractive methods. The proofs are based on standard and appropriate tools: the ridge and group-LASSO arguments follow the Buhlmann--van de Geer framework with an extra term for the estimated latent positions, and the CCA theorems reduce to singular-subspace perturbation bounds. The group-LASSO theorem, in particular, gives a concrete high-dimensional rate in terms of the embedding error xi_n and the compatibility constant. If the scope were stated accurately, the fixed-p CCA consistency results and the high-dimensional regression results would be a solid contribution. However, the advertised high-dimensional guarantee for the two CCA-based methods is not delivered, and the paper does not provide test-level guarantees for the permutation procedures that form the actual inferential proposal.
major comments (3)
- [Abstract and Section 2.2, Eq. (12)-(14); Remark 3.11] The abstract claims theoretical guarantees for all four methods when node covariates are high-dimensional. This is unsupported for the CCA-based methods. Section 2.2 explicitly assumes p is fixed, Remark 3.11 states that high-dimensional CCA is deferred to future work, and Theorems 3.12 and 3.13 both use eSigma_Z^{-1/2} under Assumption 4 requiring Sigma_Z invertible. When p_n > n, eSigma_Z is singular and the proofs' spectral-norm perturbation arguments cannot be controlled. The only p -> infinity theory in the paper is for ridge (Theorem 3.4/Corollary 3.5) and group LASSO (Theorem 3.8). The abstract and Section 5 should be revised to distinguish the high-dimensional guarantees for regression methods from the fixed-p consistency results for CCA methods, or new high-dimensional CCA theory must be supplied.
- [Section 4.1; Theorems 3.12 and 3.13] The paper's stated goal is testing, but Theorems 3.12 and 3.13 only establish that the test statistic converges in probability to the oracle population CCA coefficient. They do not establish that the permutation test controls level under H0 or has power. For the CCA-based methods, H0 is defined in Section 4.1 as zero population covariance, which is weaker than the row-exchangeability of Z given X needed for exact permutation inference. Unless the null model is taken to include independence of X and Z, or an asymptotic analysis of the permutation null distribution is supplied, the central testing claim is not proven. This is a load-bearing gap, not a presentation issue.
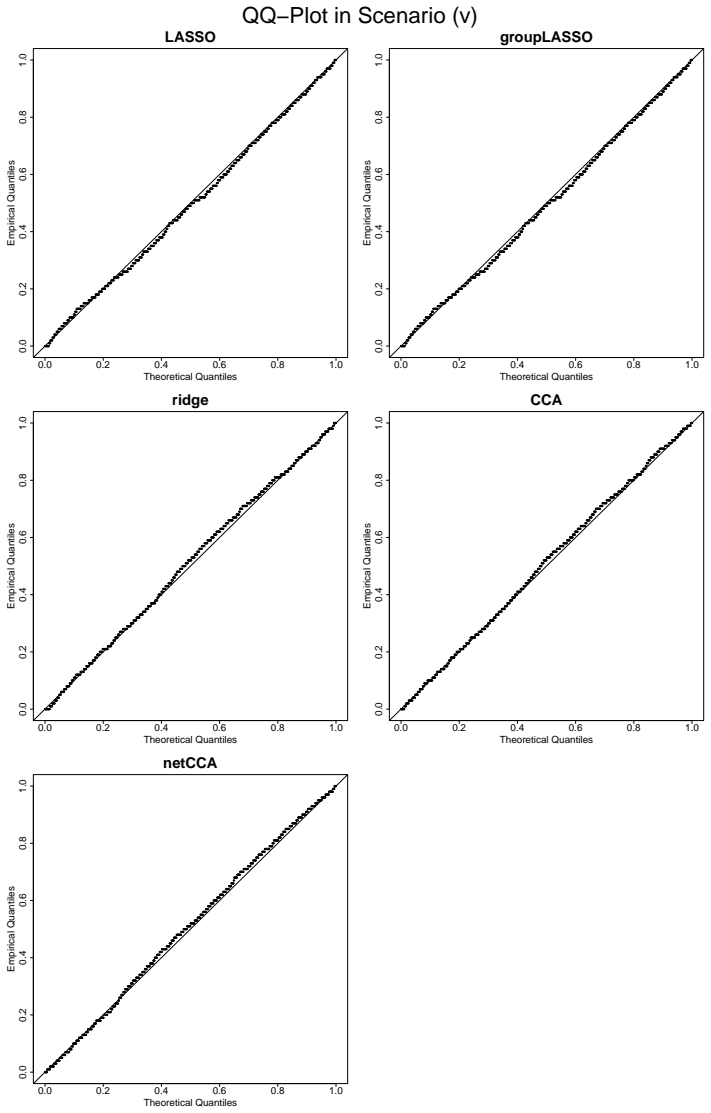
- [Section 4.2, Tables and Figures; Remark 3.11] The simulations apply CCA and netCCA with n=100, p=200 using the Fisher-Sun shrinkage estimator, a setting not covered by Theorem 3.12 or 3.13. The paper acknowledges this in Remark 3.11, but the abstract's high-dimensional promise and the simulation section should clearly separate these heuristic demonstrations from the proved guarantees. Otherwise the reader cannot tell which simulation results are covered by theory.
minor comments (4)
- [Abstract and Section 5] The paper alternates between four and five methods. The abstract says four novel methods, but Section 5 summarizes five methods (ridge, LASSO, group LASSO, CCA, netCCA). This should be reconciled, e.g., by treating group LASSO as a variant of the LASSO-based approach.
- [Section 1, paragraph 2] There is a typo: 'constitistutes' should be 'constitutes'.
- [Figure 3 caption] The bottom-left and bottom-right panels are described in the caption as 'sSNR' but appear to refer to rSNR; please check and standardize the notation.
- [Remark 3.11 and Section 4.2] It would be helpful to add a short table or remark listing which of the six simulated scenarios are covered by which theorem, and which are outside the theorem assumptions. This would prevent the reader from thinking the high-dimensional CCA simulations are theoretically guaranteed.
Circularity Check
No significant circularity; the core derivations are self-contained under the stated assumptions.
full rationale
The paper's central theorems (3.4, 3.8, 3.12, 3.13) are consistency and oracle-type bounds derived from explicit concentration and spectral-embedding assumptions (Assumptions 1-3) via external perturbation theory (Cai & Zhang 2018; Yu et al. 2014; Cape et al. 2019). The target quantities (B, rho_{X,Z}) are defined on latent quantities X and Z, not on the observed adjacency matrix, so replacing X by Xhat or A is not a self-definitional reduction: the theorems prove convergence to those oracle quantities rather than assuming it. The regularization parameters (ridge alpha, LASSO alpha, netCCA gamma) are not fitted to force the theorems; Theorem 3.13 and Corollary 3.14 hold for ranges of gamma, and Theorem 3.8 for alpha satisfying stated lower bounds. Self-citations such as Levin et al. (2022) provide concrete rates for weighted RDPGs, but they are not load-bearing because the main results are stated under generic Assumptions 1-3 and remain conditional on those assumptions. No fitted input is renamed as a prediction, and no cited uniqueness theorem is used to declare a choice forced. The abstract's claim of high-dimensional guarantees for all four methods is broader than the body's fixed-p CCA theorems (Section 2.2 explicitly says 'we assume that the dimension p of the features Z is fixed with respect to n'; Remark 3.11 defers high-dimensional CCA), but this is a scope/overclaim, not circularity. Overall, the derivation chain does not reduce to its own inputs.
Axiom & Free-Parameter Ledger
free parameters (4)
- Latent dimension d =
heuristic: 14 (PPI), 55 (Wikipedia) via Li et al. (2020); unnamed in simulations, capped at 20 in Scenario (iv)
- Ridge/LASSO tuning alpha =
cross-validated in experiments; theory allows any alpha >= 2 alpha_0,n (LASSO) or alpha_k > 0 (ridge)
- netCCA shrinkage gamma =
gamma = sqrt(n) in experiments
- Covariance test variance sigma_hat^2 =
empirical variance of embedded observations under H0 (Remark F.4)
axioms (9)
- domain assumption The observed network is a generalized RDPG: edges are conditionally independent given latent positions X, with E[A | X] = XX^T
- domain assumption Assumption 1: ||A - XX^T|| = O_P(eta_n)
- domain assumption Assumption 2: an estimator Xhat exists with ||Xhat - XQ||_{2,infinity} = O_P(xi_n) for some orthogonal Q
- domain assumption Assumption 3: W^T(A - XX^T)V = O_P(zeta_n) for arbitrary bounded-norm test matrices W, V
- domain assumption Assumption 4: (Xi, Zi) i.i.d. with invertible Sigma_X and Sigma_Z; p fixed for the CCA theorems
- domain assumption Exact linear model X = ZB + E with independent rows (Equation 2)
- domain assumption Subgamma tail conditions on the entries of Z and E
- domain assumption Random multitask compatibility condition 1/phi_S = O_P(1)
- ad hoc to paper Correct selection of the latent dimension d
Cite this review
Pith. "Pith review of Testing for correlation between network structure and high-dimensional node covariates." pith.science (2026). https://pith.science/paper/TUOKXXO7
@misc{pith2026250903772,
  author       = {Pith},
  title        = {Pith review of: Testing for correlation between network structure and high-dimensional node covariates},
  year         = {2026},
  howpublished = {\url{https://pith.science/paper/TUOKXXO7}},
  note         = {Machine review of arXiv:2509.03772}
}
read the original abstract
In many application domains, networks are observed with node-level features. In such settings, a common problem is to assess whether or not nodal covariates are correlated with the network structure itself. Here, we present four novel methods for addressing this problem. Two of these are based on a linear model relating node-level covariates to latent node-level variables that drive network structure. The other two are based on applying canonical correlation analysis to the node features and network structure, avoiding the linear modeling assumptions. We provide theoretical guarantees for all four methods when the observed network is generated according to a low-rank latent space model endowed with node-level covariates, which we allow to be high-dimensional. Our methods are computationally cheaper and require fewer modeling assumptions than previous approaches to network dependency testing. We demonstrate and compare the performance of our novel methods on both simulated and real-world data.
Figures




Reference graph
Works this paper leans on
-
[1]
Acemoglu
D. Acemoglu. Systemic risk and stability in financial networks. American Economic Review, 105 0 (2): 0 564--608, 2015
2015
-
[2]
Acharyya, J
A. Acharyya, J. Agterberg, M. W. Trosset, Y. Park, and C. E. Priebe. Semisupervised regression in latent structure networks on unknown manifolds. Applied Network Science, 8 0 (75), 2023
2023
-
[3]
E. M. Airoldi, D. M. Blei, S. E. Fienberg, and E. P. Xing. Mixed Membership Stochastic Blockmodels . Journal of Machine Learning Research, 9: 0 1981--2014, 2008
1981
-
[4]
D. J. Aldous. Representations for partially exchangeable arrays of random variables. Journal of Multivariate Analysis, 11 0 (4): 0 581--598, 1981
1981
-
[5]
U. Alon. Biological networks: The tinkerer as an engineer. Science, 301 0 (5641): 0 1866--1867, 2003
2003
-
[6]
Athreya, D
A. Athreya, D. E. Fishkind, K. Levin, V. Lyzinski, Y. Park, Y. Qin, D. L. Sussman, M. Tang, J. T. Vogelstein, and C. E. Priebe. Statistical inference on random dot product graphs: a survey. Journal of Machine Learning Research, 18 0 (226): 0 1--92, 2018
2018
-
[7]
Barab \'a si, N
A.-L. Barab \'a si, N. Gulbahce, and J. Loscalzo. Network medicine: a network-based approach to human disease. Nature reviews genetics, 12 0 (1): 0 56--68, 2011
2011
-
[8]
R. Bhatia. Matrix Analysis. Springer, 1997
1997
-
[9]
P. J. Bickel and E. Levina. Regularized estimation of large covariance matrices. The Annals of Statistics, 36: 0 199--227, 2008
2008
-
[10]
Binkiewicz, J
N. Binkiewicz, J. T. Vogelstein, and K. Rohe. Covariate-assisted spectral clustering. Biometrika, 104 0 (2): 0 361--377, 2017
2017
-
[11]
Boucheron, G
S. Boucheron, G. Lugosi, and P. Massart. Concentration Inequalities. Oxford University Press, 2013
2013
-
[12]
B\" u hlmann and S
P. B\" u hlmann and S. van de Geer. Statistics for High-Dimensional Data. Springer, 2011
2011
-
[13]
T. T. Cai and A. Zhang. Rate-optimal perturbation bounds for singular subspaces with applications to high-dimensional statistics,. The Annals of Statistics, 46 0 (1): 0 60--89, 2018
2018
-
[14]
J. Cape, M. Tang, and C. E. Priebe. The two-to-infinity norm and singular subspace geometry with applications to high-dimensional statistics. The Annals of Statistics, 47 0 (5): 0 2405--2439, 2019
2019
-
[15]
Chandna, S
S. Chandna, S. C. Olhede, and P. J. Wolfe. Local linear graphon estimation using covariates. Biometrika, 109 0 (3): 0 721--734, 2022
2022
-
[16]
Profile least squares estimation in networks with covariates
S. Chandna, B. Bagozzi, and S. Chatterjee. Profile least squares estimation in networks with covariates. arXiv:2412.16298, 2024
work page internal anchor Pith review Pith/arXiv arXiv 2024
-
[17]
T. Chaney. The network structure of international trade. American Economic Review, 104 0 (11): 0 3600--3634, 2014
2014
-
[18]
J. H. Chang and S. Paul. Embedding network autoregression for time series analysis and causal peer effect inference. arXiv:2406.05944, 2024
work page internal anchor Pith review Pith/arXiv arXiv 2024
-
[19]
F. Chen, S. Roch, K. Rohe, and S. Yu. Estimating graph dimension with cross-validated eigenvalues. arXiv:2108.03336, 2021
arXiv 2021
-
[20]
Coppersmith
G. Coppersmith. Vertex nomination. WIRE s Computational Statistics , 6 0 (2): 0 144--153, 2014
2014
-
[21]
Elliott, B
M. Elliott, B. Golub, and M. O. Jackson. Financial networks and contagion. American Economic Review, 104 0 (10): 0 3115--3153, 2014
2014
-
[22]
T. J. Fisher and X. Sun. Improved S tein-type shrinkage estimators for the high-dimensional multivariate normal covariance matrix. Computational Statistics & Data Analysis, 55 0 (5): 0 1909--1918, 2011
1909
-
[23]
D. E. Fishkind, V. Lyzinski, H. Pao, L. Chen, and C. E. Priebe. Vertex nomination schemes for membership prediction. The Annals of Applied Statistics, 9 0 (3): 0 1510--1532, 2015
2015
-
[24]
B. K. Fosdick and P. D. Hoff. Testing and modeling dependencies between a network and nodal attributes. Journal of the American Statistical Association, 110 0 (511): 0 1047--1056, 2015
2015
-
[25]
C. Gao, Z. Ma, and H. H. Zhou. Sparse CCA : Adaptive estimation and computational barriers. The Annals of Statistics, 45 0 (5): 0 2074--2101, 2017
2074
-
[26]
C. Gao, Z. Ma, A. Y. Zhang, and H. H. Zhou. Community detection in degree-corrected block models. The Annals of Statistics, 46 0 (5): 0 2153--2185, 2018
2018
-
[27]
J. Golbeck. Analyzing the Social Web. Morgan Kaufmann, 2013
2013
-
[28]
Hakes, J
L. Hakes, J. W. Pinney, D. L. Robertson, and S. C. Lovell. Protein-protein interaction networks and biology---what's the connection? Nature Biotechnology, 26: 0 69--72, 2008
2008
-
[29]
F. Han, Y. Gu, G. L. Brown, X. Zhang, and X. Liu. Neuroimaging contrast across the cortical hierarchy is the feature maximally linked to behavior and demographics. Neuroimage, 215, 2020
2020
-
[30]
X. Han, Q. Yang, and Y. Fan. Universal rank inference via residual subsampling with application to large networks. The Annals of Statistics, 51 0 (3): 0 1109--1133, 2023
2023
-
[31]
Hastie, R
T. Hastie, R. Tibshirani, and M. Wainwright. Statistical Learning with Sparsity. CRC Press, 2015
2015
-
[32]
M. J. Hawrylycz, E. S. Lein, A. L. Guillozet-Bongaarts, E. H. Shen, L. Ng, et al. An anatomically comprehensive atlas of the adult human brain transcriptome. Nature, 489: 0 391--399, 2012
work page 2012
-
[33]
A. Hayes and K. Levin. Peer effects in the linear-in-means model may be inestimable even when identified. arXiv:2410.10772, 2024
- [34]
-
[35]
P. D. Hoff. Bilinear mixed-effects models for dyadic data. Journal of the American Statistical Association, 100 0 (469): 0 286--295, 2005
work page 2005
-
[36]
P. D. Hoff, A. E. Raftery, and M. S. Handcock. Latent space approaches to social network analysis. Journal of the American Statistical Association, 97 0 (460): 0 1090--1098, 2002
work page 2002
-
[37]
P. W. Holland, K. B. Laskey, and S. Leinhardt. Stochastic blockmodels: First steps. Social Networks, 5 0 (2): 0 109--137, 1983
work page 1983
- [38]
-
[39]
C. James, D. Yuan, I. Gaynanova, and J. Arroyo. Learning joint and individual structure in network data with covariates. arXiv:2406.08776, 2024
Pith/arXiv arXiv 2024
-
[40]
P. Ji, J. Jin, Z. T. Ke, and W. Li. Co-citation and co-authorship networks of statisticians. Journal of Business & Economic Statistics, 40 0 (2): 0 469--485, 2022
2022
-
[41]
J. Jin, Z. T. Ke, and S. Luo. Mixed membership estimation for social networks. Journal of Econometrics, 239 0 (2): 0 105369, 2024
work page 2024
-
[42]
B. Karrer and M. E. J. Newman. Stochastic blockmodels and community structure in networks. Physical Review E, 83 0 (1): 0 016107, 2011
work page 2011
-
[43]
Computational Inference for Directions in Canonical Correlation Analysis
D. Kessler and E. Levina. Computational inference for directions in canonical correlation analysis. arXiv:2308.11218, 2023
work page internal anchor Pith review Pith/arXiv arXiv 2023
-
[44]
A. Kreiss, E. Mammen, and W. Polonik. Common drivers in sparsely interacting hawkes processes, 2025. URL https://arxiv.org/abs/2504.03916
Pith/arXiv arXiv 2025
-
[45]
P. Latouche, S. Robin, and S. Ouadah. Goodness of fit of logistic regression models for random graphs. Journal of Computational and Graphical Statistics, 27 0 (1): 0 98--109, 2018
work page 2018
-
[46]
C. M. Le, K. Levin, P. J. Bickel, and E. Levina. Comment: Ridge regression and regularization of large matrices. Technometrics, 62 0 (4): 0 443--446, 2020
work page 2020
-
[47]
O. Ledoit and M. Wolf. Nonlinear shrinkage estimation of large-dimensional covariance matrices. The Annals of Statistics, 40: 0 1024--1060, 2012
work page 2012
-
[48]
O. Ledoit and M. Wolf. Optimal estimation of a large-dimensional covariance matrix under S tein’s loss. Bernoulli, 24 0 (4B): 0 3791--3832, 2018
work page 2018
-
[49]
Y. Lee, C. Shen, C. E. Priebe, and J. T. Vogelstein. Network dependence testing via diffusion maps and distance-based correlations. Biometrika, 106 0 (4): 0 857--873, 2019
work page 2019
-
[50]
J. Lei. Network representation using graph root distributions. The Annals of Statistics, 49 0 (2): 0 745--768, 2021
work page 2021
- [51]
-
[52]
K. Levin and V. Lyzinski. Laplacian eigenmaps from sparse, noisy similarity measurements. IEEE Transactions on Signal Processing , 65 0 (8): 0 1988--2003, 2017
work page 1988
-
[53]
K. Levin, A. Athreya, M. Tang, V. Lyzinski, Y. Park, and C. E. Priebe. A central limit theorem for an omnibus embedding of random dot product graphs. arXiv:1705.09355v5, 2017
Pith/arXiv arXiv 2017
-
[54]
Vertex Nomination in Richly Attributed Networks
K. Levin, C. E. Priebe, and V. Lyzinski. Vertex nomination in richly attributed networks. arXiv:2005.02151, 2020
work page internal anchor Pith review Pith/arXiv arXiv 2005
- [55]
-
[56]
J. Li, G. Xu, and J. Zhu. High-dimensional factor analysis for network-linked data. arXiv:2403.17121, 2024 a
work page internal anchor Pith review Pith/arXiv arXiv 2024
-
[57]
T. Li, E. Levina, and J. Zhu. Prediction models for network-linked data. The Annals of Applied Statistics, 13 0 (1): 0 132--164, 2019
work page 2019
-
[58]
T. Li, E. Levina, and J. Zhu. Network cross-validation by edge sampling. Biometrika, 107 0 (2): 0 257--276, 2020
2020
-
[59]
Z. Li, B. K. Johnson, D. L. Sussman, C. E. Priebe, and V. Lyzinski. Gotta match 'em all: Solution diversification in graph matching matched filters. IEEE Transactions on Signal and Information Processing over Networks , 10: 0 752--764, 2024 b
work page 2024
-
[60]
R. Lockhart, J. Taylor, R. J. Tibshirani, and R. Tibshirani. A significance test for the lasso . The Annals of Statistics, 42 0 (2): 0 413 -- 468, 2014. doi:https://doi.org/10.1214/13-AOS1175
- [61]
-
[62]
L. Lov\' a sz. Large Networks and Graph Limits. American Mathematical Society, 2012
work page 2012
-
[63]
V. Lyzinski, M. Tang, A. Athreya, Y. Park, and C. E. Priebe. Community detection and classification in hierarchical stochastic blockmodels. IEEE Transactions on Network Science and Engineering , 4 0 (1): 0 13--26, 2017
work page 2017
-
[64]
D. Marchette, C. E. Priebe, and G. Coppersmith. Vertex nomination via attributed random dot product graphs. In Proceedings of the 58th World Statistical Congress. International Statistical Institute, 2011
work page 2011
-
[65]
I. McCulloh, H. Armstrong, and A. Johnson. Social Network Analysis with Applications. Wiley, 1st edition, 2013
work page 2013
-
[66]
E. McFowland III and C. R. Shalizi. Estimating causal peer influence in homophilous social networks by inferring latent locations. Journal of the American Statistical Association, 118 0 (541): 0 707--718, 2023
work page 2023
- [67]
-
[68]
R. J. Muirhead. Aspects of Multivariate Statistical Theory. Wiley Series in Probability and Statistics. John Wiley & Sons, 1982
work page 1982
-
[69]
S. Nath, K. Warren, and S. Paul. Identifying peer influence in therapeutic communities adjusting for latent homophily. The Annals of Applied Statistics, 19 0 (1): 0 529--565, 2025
work page 2025
-
[70]
M. E. J. Newman. Networks: an introduction. Oxford University Press, 2nd edition, 2018
work page 2018
-
[71]
P. Orbanz and D. M. Roy. Bayesian models of graphs, arrays and other exchangeable random structures. IEEE Transactions on Pattern Analysis and Machine Intelligent , 37 0 (2): 0 437--461, 2015
work page 2015
-
[72]
P. O. Perry and P. J. Wolfe. Point process modelling for directed interaction networks. Journal of the Royal Statistical Society Series B: Statistical Methodology, 75 0 (5): 0 821--849, 2013
work page 2013
-
[73]
K. Rohe, S. Chatterjee, and B. Yu. Spectral clustering and the high-dimensional stochastic blockmodel. The Annals of Statistics, 39 0 (4): 0 1878--1915, 2011
work page 1915
-
[74]
B. Rozemberczki, C. Allen, and R. Sarkar. Multi-scale attributed node embedding. Journal of Complex Networks, 9 0 (2): 0 cnab014, 2021. doi:https://doi.org/10.1093/comnet/cnab014
-
[75]
P. Rubin-Delanchy, J. Cape, M. Tang, and C. E. Priebe. A statistical interpretation of spectral embedding: the generalised random dot product graph. Journal of the Royal Statistical Society: Series B (Statistical Methodology) , 84 0 (4): 0 1446--1473, 2022
work page 2022
-
[76]
L. L. Scharf and C. T. Mullis. Canonical coordinates and the geometry of inference, rate, and capacity. IEEE Transactions on Signal Processing , 48 0 (3): 0 824--831, 2000
work page 2000
-
[77]
A. Setayesh, Z. S. H. Zadeh, and B. Bahrak. Analysis of the global trade network using exponential random graph models. Applied Network Science, 7 0 (38), 2022
work page 2022
-
[78]
C. R. Shalizi and A. C. Thomas. Homophily and contagion are generically confounded in observational social network studies. Sociological Methods Research, 40 0 (2): 0 211--239, 2011
work page 2011
-
[79]
Y. Song, P. J. Schreier, D. Ram\' i rez, and T. Hasija. Canonical correlation analysis of high-dimensional data with very small sample support. Signal Processing, 128: 0 449--458, 2016
work page 2016
-
[80]
J. Sosa and B. Betancourt. Bayesian inference of financial networks. Model Assisted Statistics and Applications, 18: 0 295--310, 2023
work page 2023
This paper was first reviewed by deepseek-v4-flash on August 5, 2026.
discussion (0)
Sign in with ORCID, Apple, or X to comment. Anyone can read and Pith papers without signing in.