REVIEW 3 major objections 6 minor 34 references
VILOD: A Visual Interactive Labeling Tool for Object Detection
T0 review · 3 major / 6 minor · reviewed 2026-08-05 · deepseek-v4-flash
Pith's one-line read This thesis claims that a balanced, visually guided human labeling strategy in VILOD achieves higher final object detection performance than automated uncertainty sampling, and that visual analytics can make active learning more transparent
desk verdict A transparent master's thesis that builds a plausible visual active-learning tool for object detection; the central performance claim is a proof-of-concept, not a demonstrated edge. read the letter →
The pith
A machine-rendered reading of the paper's core claim, the machinery that carries it, and where it could break.
The reading
What carries the argument
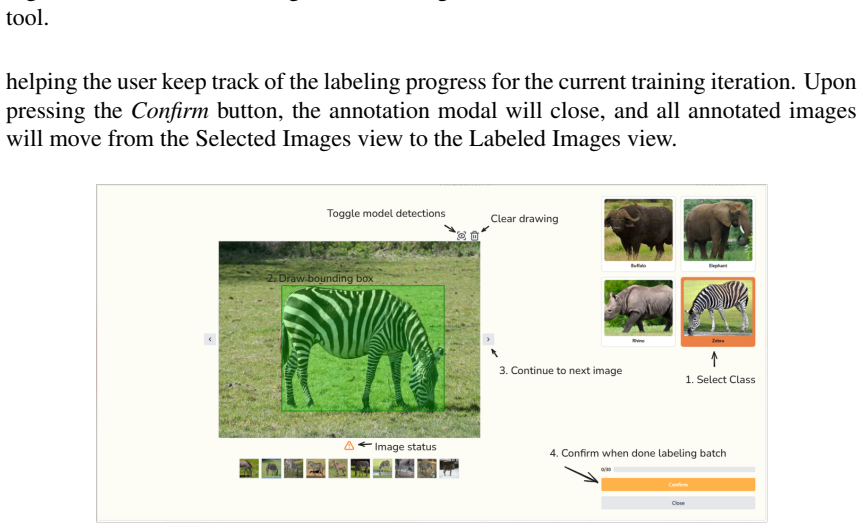
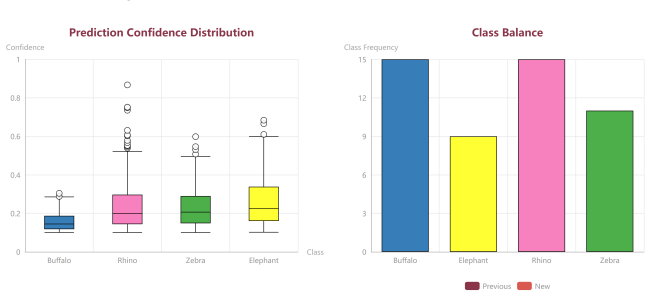
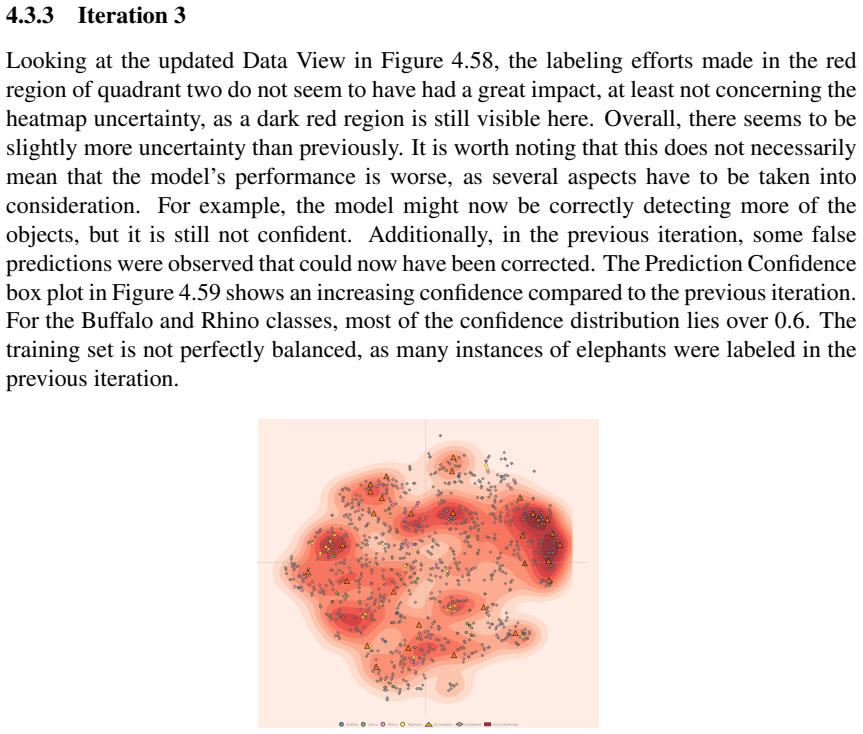
The central mechanism is the VILOD interface: a t-SNE scatterplot of image features forms the Data View, with an uncertainty heatmap (a kernel density estimate weighted by squared uncertainty) overlaid to highlight regions of high model uncertainty, and active-learning-suggested samples marked distinctly. A linked Model View shows per-class prediction-confidence distributions and the class balance of the labeled set. Together with a lasso selection tool and an integrated bounding-box annotation modal, these views let the user choose samples according to different strategies and immediately retrain the detector, closing a human-in-the-loop active learning cycle.
What would settle it
Run the same three strategies and the uncertainty baseline with several independent annotators (not the author) and multiple random seeds on the same dataset; if the balanced strategy does not reliably reach the highest final mAP, or if the differences fall within seed-to-seed variance, the claim of a human-guidance advantage fails.
Extended reading notes
Core claim
The paper's core discovery claim is that an expert user, supported by an interactive visual analytics interface, can implement distinct labeling strategies for object detection annotation, and that one strategy in particular—Balanced Guidance Integration, which synthesizes uncertainty heatmaps, active-learning suggestions, t-SNE data structure, and model-state feedback—yields the highest final model performance. In the reported comparison, this balanced human-guided strategy reached the best mAP50-95, slightly outperforming the automated uncertainty-sampling active learning baseline, while the two more narrow strategies (exploration-only and uncertainty-only) did not surpass the baseline on
Load-bearing premise
The comparison rests on one person—the author—performing the three strategies, so the measured edge of the balanced strategy could reflect that person's skill, expectations, or fatigue rather than the strategy itself; a single training seed adds to this fragility.
Editorial extensions
If this is right
- If the central claim holds, human-in-the-loop visual analytics can be a viable alternative to fully automated active learning for object detection, offering comparable or better performance with added transparency.
- Experts can pursue diverse labeling goals—broad data coverage, uncertainty reduction, class balancing, or correcting specific model errors—within one integrated tool, rather than being locked into a single query strategy.
- Human quality control can filter out noisy, low-resolution, or misleading samples that a purely automated uncertainty sampler might add, potentially avoiding performance dips during iterative training.
- The tool makes the model's state interpretable, so practitioners can see why samples are suggested and decide whether to trust or override algorithmic recommendations.
- The comparison of strategies provides empirical grounding for designing adaptive or hybrid active learning interfaces that encourage balanced use of data structure and model uncertainty.
Reading between the lines
- If replicated with multiple independent annotators and multiple random seeds, the balanced-strategy advantage may become more consistent; a multi-user study could separate strategy effects from the single author's familiarity with the tool.
- The t-SNE structure comes from a fixed pretrained feature extractor; updating the projection from each newly trained model's embeddings could make the Data View model-aware and potentially improve later iterations, an extension the paper notes as future work.
- The balanced strategy could be partially automated by combining uncertainty scores with a diversity/representativeness term, turning the expert's balancing act into a hybrid query strategy while keeping the human as final filter.
- The quality-control benefit observed in the uncertainty-driven case suggests that even users who largely follow active learning suggestions add value mainly by discarding noisy samples, a finding that could be tested by comparing an AL baseline with and without a simple automated noise filter.
Editorial analysis
A structured set of objections, weighed in public.
Referee Report
Summary. The paper presents VILOD, a web-based visual interactive labeling tool for object detection that combines a t-SNE scatterplot, uncertainty heatmap overlay, active-learning (AL) suggestions, model-state views, and an integrated bounding-box annotation interface. It reports a comparative study in which the author, acting as an expert user, executed three labeling strategies (Exploration & Structure Focus, Uncertainty-Driven Focus, Balanced Guidance Integration) over five iterative HITL-AL rounds on the African Wildlife dataset with YOLOv11n, and compared their mAP50-95 trajectories against an automated uncertainty-sampling baseline. The central claim is that the Balanced Guidance Integration strategy achieved the highest final mAP50-95 and that human guidance supported by interactive visual analytics can offer an edge over automated AL.
Significance. If the empirical claim were supported, the paper would make a useful contribution to HITL active learning for object detection by demonstrating a concrete system and showing that different visually guided strategies yield measurable differences in learning trajectories. The tool itself is thoughtfully designed and described in detail, and the qualitative walkthroughs (Sections 4.1–4.3) are valuable for the visual-analytics community as proof-of-concept evidence. The paper is also unusually transparent about its limitations, explicitly acknowledging the single-user design, single dataset, single model, and lack of statistical testing in Sections 1.6, 3.5, and 6.2. However, the central claim of a performance edge over automated AL rests on a single replication with point estimates only, and the paper does not provide the variance estimates or repeated runs needed to support that causal reading.
major comments (3)
- [§4.4.1, Table 4.2] The headline result — Balanced Guidance Integration (0.7477) outperforming the automated AL baseline (0.7348) — is based on one seed (seed=42, §3.3.2), one dataset, one user, and no confidence intervals or significance tests. The 0.0129 mAP difference is smaller than the iteration-to-iteration variation in the same table (e.g., AL baseline drops from 0.6940 to 0.6824 between iterations 2 and 3). Without repeated training runs with different seeds or multiple users, the difference cannot be distinguished from stochasticity or selection variance. The abstract and §6.1 present the edge claim without this qualification; this is load-bearing for RQ2.
- [§3.3.7, §3.5] The three use cases were executed by the author only, as the paper states in §3.5. The qualitative narratives in Sections 4.1–4.3 describe strategic decisions in a way that supports the intended strategy, but there is no independent protocol check, no rater agreement, and no log-based measure of how faithfully the stated strategy was followed. The causal inference that observed mAP differences reflect the strategies rather than the user's expectations or fatigue is therefore weak. The paper acknowledges this limitation but still concludes in §6.1 that the system 'successfully demonstrated' benefits; the conclusion should be explicitly framed as a proof-of-concept result.
- [§4.4.1, iteration-3 AL baseline] The sudden drop in the AL baseline trajectory at iteration 3 is attributed to 'noisy samples' that a human might filter. This is a plausible post-hoc interpretation, but it is not supported by any measurement: the paper does not analyze which images were selected at that iteration, does not quantify their noise content, and does not compare them with images selected in other iterations. Since this interpretation is used to motivate the value of human quality control, it should be either substantiated with evidence or presented as speculation.
minor comments (6)
- [§3.3.2] The checkpoint is referred to as 'yolov11n.pt' and elsewhere as 'YOLOv11n'; please standardize the naming.
- [§3.3.4, Figure 3.6] The caption labels two components as '(c)' — the Selected Images View and the Labeled View. Renumber.
- [§4.4.1, Table 4.3] Precision and Recall are reported without defining the confidence threshold or IoU setting; please specify these evaluation details.
- [§4.1.1] The phrase 'the three blobs' is clear from Figure 4.16, but the figure is a screenshot with manual highlighting; a vectorized figure would improve readability.
- [§6.2] The sentence 'investigation if there is any significant performance increase' should be 'investigate whether there is a significant performance increase.'
- [References] Some references lack venue identifiers (e.g., [13], [31]); consider adding DOIs or arXiv identifiers where available.
Circularity Check
No significant circularity: the mAP comparison is measured on a held-out test set with no fitted parameter or self-cited theorem manufacturing the result.
full rationale
The paper's central claim is that the Balanced Guidance Integration strategy achieved the highest final mAP50-95 (0.7477) among the compared strategies, slightly surpassing the automated AL baseline (0.7348). This is an empirical result obtained by running three predefined human-guided use cases and one automated simulation, all starting from the same initial model M0, retraining for five iterations with the same fixed hyperparameters (epochs=50, seed=42, imgsz=640), and evaluating on a held-out test split of 227 images that was excluded from all selection and training processes. No equation in the paper defines the strategy's performance in terms of its inputs; the mAP numbers come from model evaluation, not from a fitted parameter renamed as a prediction. The AL suggestions and uncertainty heatmap are computed directly from the current model's predictions, and the human strategies are described as distinct selection policies over those visualizations. There is no self-citation that is load-bearing for the main claim: references to the supervisor's prior work appear only in background and related-work contexts (e.g., trajectory annotation, visual analytics platforms) and do not establish the empirical outcome. The paper transparently acknowledges threats to validity—single user, single dataset, single seed, lack of significance testing—in Sections 1.6, 3.5, 5, and 6.2. These are limitations on generalizability and statistical inference, not definitional circularity. The evaluation loop (model predicts, user selects, model retrains, test on held-out set) is the standard active learning protocol; nothing in the paper reduces the claimed performance advantage to its own construction. Therefore, no circular step is present, and the appropriate score is 0.
Assumptions & free parameters
free parameters (6)
- t-SNE perplexity =
12
- K-means clusters for initial L0 =
20
- Heatmap weighting exponent =
2
- Labeling budget per iteration =
30
- Fine-tuning epochs =
50
- Image size and random seed =
imgsz=640, seed=42
assumptions (4)
- domain assumption t-SNE at perplexity 12 preserves enough local structure to guide useful sample selection.
- domain assumption Feature embeddings extracted from the pretrained YOLOv11n backbone capture visual structure relevant to the active learning task.
- domain assumption The fixed 50-epoch YOLO fine-tuning protocol with seed 42 is a stable and unbiased training regime for all strategies.
- domain assumption The author, acting as the sole expert user, executed the three predefined strategies faithfully and without bias.
Cite this review
Pith. "Pith review of VILOD: A Visual Interactive Labeling Tool for Object Detection." pith.science (2026). https://pith.science/paper/ZMSBEDSF
@misc{pith2026250905317,
  author       = {Pith},
  title        = {Pith review of: VILOD: A Visual Interactive Labeling Tool for Object Detection},
  year         = {2026},
  howpublished = {\url{https://pith.science/paper/ZMSBEDSF}},
  note         = {Machine review of arXiv:2509.05317}
}
read the original abstract
The advancement of Object Detection (OD) using Deep Learning (DL) is often hindered by the significant challenge of acquiring large, accurately labeled datasets, a process that is time-consuming and expensive. While techniques like Active Learning (AL) can reduce annotation effort by intelligently querying informative samples, they often lack transparency, limit the strategic insight of human experts, and may overlook informative samples not aligned with an employed query strategy. To mitigate these issues, Human-in-the-Loop (HITL) approaches integrating human intelligence and intuition throughout the machine learning life-cycle have gained traction. Leveraging Visual Analytics (VA), effective interfaces can be created to facilitate this human-AI collaboration. This thesis explores the intersection of these fields by developing and investigating "VILOD: A Visual Interactive Labeling tool for Object Detection". VILOD utilizes components such as a t-SNE projection of image features, together with uncertainty heatmaps and model state views. Enabling users to explore data, interpret model states, AL suggestions, and implement diverse sample selection strategies within an iterative HITL workflow for OD. An empirical investigation using comparative use cases demonstrated how VILOD, through its interactive visualizations, facilitates the implementation of distinct labeling strategies by making the model's state and dataset characteristics more interpretable (RQ1). The study showed that different visually-guided labeling strategies employed within VILOD result in competitive OD performance trajectories compared to an automated uncertainty sampling AL baseline (RQ2). This work contributes a novel tool and empirical insight into making the HITL-AL workflow for OD annotation more transparent, manageable, and potentially more effective.
Figures


Figures from the paper (70 more)








Reference graph
Works this paper leans on
-
[1]
Object detection in 20 years: A survey,
Z. Zou, K. Chen, Z. Shi, Y . Guo, and J. Ye, “Object detection in 20 years: A survey,” Proceedings of the IEEE, vol. 111, no. 3, pp. 257–276, 2023
work page 2023
-
[2]
A comprehensive survey on deep active learning in medical image analysis,
H. Wang, Q. Jin, S. Li, S. Liu, M. Wang, and Z. Song, “A comprehensive survey on deep active learning in medical image analysis,”Medical Image Analysis, p. 103201, 2024
work page 2024
-
[3]
Active learning literature survey,
B. Settles, “Active learning literature survey,” 2009
2009
-
[4]
A survey of human-in-the-loop for machine learning,
X. Wu, L. Xiao, Y . Sun, J. Zhang, T. Ma, and L. He, “A survey of human-in-the-loop for machine learning,”Future Generation Computer Systems, vol. 135, pp. 364–381, 2022
2022
-
[5]
J. J. Thomas and K. A. Cook, Eds., Illuminating the Path: The Research and Devel- opment Agenda for Visual Analytics. IEEE Computer Society Press, 2005
work page 2005
-
[6]
A trajectory scoring tool for local anomaly detection in maritime traffic using visual analytics,
F. H. Abreu, A. Soares, F. V . Paulovich, and S. Matwin, “A trajectory scoring tool for local anomaly detection in maritime traffic using visual analytics,” ISPRS Inter- national Journal of Geo-Information, vol. 10, no. 6, p. 412, 2021
work page 2021
-
[7]
Power to the people: The role of humans in interactive machine learning,
S. Amershi, M. Cakmak, W. B. Knox, and T. Kulesza, “Power to the people: The role of humans in interactive machine learning,” AI magazine, vol. 35, no. 4, pp. 105–120, 2014
work page 2014
-
[8]
A comprehensive survey of machine learning techniques and models for object detection,
M. Trigka and E. Dritsas, “A comprehensive survey of machine learning techniques and models for object detection,” Sensors, vol. 25, no. 1, 2025. [Online]. Available: https://www.mdpi.com/1424-8220/25/1/214
work page 2025
Show all 34 references
-
[9]
Deep learning,
Y . LeCun, Y . Bengio, and G. Hinton, “Deep learning,” nature, vol. 521, no. 7553, pp. 436–444, 2015
2015
-
[10]
A survey of deep learning-based object detection,
L. Jiao, F. Zhang, F. Liu, S. Yang, L. Li, Z. Feng, and R. Qu, “A survey of deep learning-based object detection,” IEEE Access, vol. 7, pp. 128 837–128 868, 2019
2019
-
[11]
You only look once: Unified, real-time object detection,
J. Redmon, S. Divvala, R. Girshick, and A. Farhadi, “You only look once: Unified, real-time object detection,” in Proceedings of the IEEE conference on computer vision and pattern recognition, 2016, pp. 779–788
2016
-
[12]
Ssd: Single shot multibox detector,
W. Liu, D. Anguelov, D. Erhan, C. Szegedy, S. Reed, C.-Y . Fu, and A. C. Berg, “Ssd: Single shot multibox detector,” in Computer Vision–ECCV 2016: 14th European Conference, Amsterdam, The Netherlands, October 11–14, 2016, Proceedings, Part I 14. Springer, 2016, pp. 21–37
2016
-
[13]
Ultralytics yolo11,
G. Jocher and J. Qiu, “Ultralytics yolo11,” 2024. [Online]. Available: https: //github.com/ultralytics/ultralytics
2024
-
[14]
YOLO performance metrics
Ultralytics. YOLO performance metrics. Ultralytics. Accessed: 2025-05-07. [Online]. Available: https://docs.ultralytics.com/guides/yolo-performance-metrics/
2025
-
[15]
Vista: A visual ana- lytics platform for semantic annotation of trajectories,
A. Soares, J. Rose, M. Etemad, C. Renso, and S. Matwin, “Vista: A visual ana- lytics platform for semantic annotation of trajectories,” in Proceedings of the 22nd International Conference on Extending Database Technology (EDBT), 2019. 76
2019
-
[16]
A survey on deep active learning: Recent advances and new frontiers,
D. Li, Z. Wang, Y . Chen, R. Jiang, W. Ding, and M. Okumura, “A survey on deep active learning: Recent advances and new frontiers,” IEEE Transactions on Neural Networks and Learning Systems, 2024
2024
-
[17]
Analytic: An active learning system for trajectory classification,
A. S. Júnior, C. Renso, and S. Matwin, “Analytic: An active learning system for trajectory classification,” IEEE computer graphics and applications, vol. 37, no. 5, pp. 28–39, 2017
2017
-
[18]
Local anomaly detection in maritime traffic using visual analytics
F. H. O. Abreu, A. Soares, F. V . Paulovich, and S. Matwin, “Local anomaly detection in maritime traffic using visual analytics.” inIn: EDBT/ICDT Workshops: 4th Inter- national Workshop on Big Mobility Data Analytics (BMDA 2021), Nicosia, Cyprus., 2021
2021
-
[19]
A review of user interface design for interac- tive machine learning,
J. J. Dudley and P. O. Kristensson, “A review of user interface design for interac- tive machine learning,” ACM Transactions on Interactive Intelligent Systems (TiiS), vol. 8, no. 2, pp. 1–37, 2018
2018
-
[20]
Rajaraman and J
A. Rajaraman and J. D. Ullman, Mining of massive datasets. Autoedicion, 2011
2011
-
[21]
Visualizing data using t-sne,
L. v. d. Maaten and G. Hinton, “Visualizing data using t-sne,” Journal of machine learning research, vol. 9, no. Nov, pp. 2579–2605, 2008
2008
-
[22]
Umap: Uniform manifold approximation and projection for dimension reduction,
L. McInnes, J. Healy, and J. Melville, “Umap: Uniform manifold approximation and projection for dimension reduction,” arXiv preprint arXiv:1802.03426, 2018
2018 arXiv
-
[23]
A compre- hensive survey on transfer learning,
F. Zhuang, Z. Qi, K. Duan, D. Xi, Y . Zhu, H. Zhu, H. Xiong, and Q. He, “A compre- hensive survey on transfer learning,” Proceedings of the IEEE, vol. 109, no. 1, pp. 43–76, 2020
2020
-
[24]
Examining the impact of cross-domain learning on crime prediction,
F. K. Bappee, A. Soares, L. M. Petry, and S. Matwin, “Examining the impact of cross-domain learning on crime prediction,” Journal of big data, vol. 8, no. 1, p. 96, 2021
2021
-
[25]
Visually-enabled active deep learning for (geo) text and image classification: a review,
L. Yang, A. M. MacEachren, P. Mitra, and T. Onorati, “Visually-enabled active deep learning for (geo) text and image classification: a review,”ISPRS International Journal of Geo-Information, vol. 7, no. 2, p. 65, 2018
2018
-
[26]
Comparing visual-interactive labeling with active learning: An experimental study,
J. Bernard, M. Hutter, M. Zeppelzauer, D. Fellner, and M. Sedlmair, “Comparing visual-interactive labeling with active learning: An experimental study,”IEEE trans- actions on visualization and computer graphics, vol. 24, no. 1, pp. 298–308, 2017
2017
-
[27]
Visgil: machine learning-based vi- sual guidance for interactive labeling,
B. Grimmeisen, M. Chegini, and A. Theissler, “Visgil: machine learning-based vi- sual guidance for interactive labeling,” The Visual Computer, vol. 39, no. 10, pp. 5097–5119, 2023
2023
-
[28]
Interactive visualization for multi-target active learning,
E. T. C. Klaassen, “Interactive visualization for multi-target active learning,” Master Thesis, Eindhoven University of Technology, Eindhoven, The Netherlands, 2024, department of Mathematics and Computer Science, Visualization Group
2024
-
[29]
Slamvis: An interactive visualization approach for smart labeling on multidimensional data,
A. Qian, C. Li, X. Dong, S. Chen, Y . Zhang, and G. Li, “Slamvis: An interactive visualization approach for smart labeling on multidimensional data,” in 2021 IEEE Intl Conf on Parallel & Distributed Processing with Applications, Big Data & Cloud Computing, Sustainable Computin...
2021
-
[30]
Active learning for interactive visualiza- tion,
T. Iwata, N. Houlsby, and Z. Ghahramani, “Active learning for interactive visualiza- tion,” in Artificial Intelligence and Statistics. PMLR, 2013, pp. 342–350
2013
-
[31]
Active learning for deep object detection,
C.-A. Brust, C. Käding, and J. Denzler, “Active learning for deep object detection,”
-
[32]
Semi-supervised active learning for object detec- tion,
S. Chen, Y . Yang, and Y . Hua, “Semi-supervised active learning for object detec- tion,” Electronics, vol. 12, no. 2, p. 375, 2023
2023
-
[33]
Kernel density estimation — scipy v1.14.0 manual,
SciPy Developers, “Kernel density estimation — scipy v1.14.0 manual,” https:// docs.scipy.org/doc/scipy/tutorial/stats/kernel_density_estimation.html, 2025. 78 A Appendix 1 Use Case 1: Exploration & Structure Focus Annotated Samples Iteration 1 Table 1.4: Exploration & Structu...
2025
-
[2018]
Available: https://arxiv.org/abs/1809.09875
[Online]. Available: https://arxiv.org/abs/1809.09875
Reviewed August 5, 2026 · model on record in the stance chip above.
Discussion (0). Continue with ORCID to comment.