REVIEW 4 major objections 4 minor 31 references
Modelling Under-Reported Data: Pitfalls of Na\"ive Approaches and a New Statistical Framework for Epidemic Curve Reconstruction
T0 review · 4 major / 4 minor · reviewed 2026-08-04 · deepseek-v4-flash
Pith's one-line read The paper proves that ignoring under-reporting in Poisson autoregressions biases reproduction numbers and offers a normal-normal approximation to recover true counts.
desk verdict Useful new results on the pitfalls of ignoring under-reporting in Poisson autoregressions, but the key approximation claim rests on an unvalidated dependence assumption and a few loose ends. read the letter →
The pith
A machine-rendered reading of the paper's core claim, the machinery that carries it, and where it could break.
The reading
What carries the argument
The central mechanism is the latent Gaussian transformation X_t = F^{-1}_{X_t}(Φ(Z*_t)), applied to standardized latent variables Z*_t from a normal-normal approximation to a thinned count autoregression. The approximation replaces the binomial thinning Y_t | X_t ~ Bin(X_t, π) and the Poisson autoregression X_t | X_{t-1} ~ Pois(λ_t) with normal distributions that match conditional means and variances, yielding a continuous latent process Z_t that is easy to sample with gradient-based Bayesian software. The inverse-CDF transform then maps each posterior draw of Z*_t back to integer counts, and the paper asserts that the joint distribution of these transformed integers is close to the posterio
What would settle it
Run a long simulation (T ≥ 200) from a binomially thinned Poisson autoregression with small mean counts (e.g., about 3–5) and strong autocorrelation (ϕ ≈ 0.8). If the approximate-model credible intervals for the true epidemic curve have coverage far below nominal, or the lag-1 autocorrelation of Z*_t deviates materially from that of the true latent process, the central claim fails.
Extended reading notes
Core claim
The paper's central claim is that the posterior distribution of the parameters and latent true counts from a binomially thinned Poisson autoregression can be accurately approximated by fitting a normal-normal approximation—replacing each Poisson with a normal of matching conditional mean and variance, and each binomial thinning with a normal of matching conditional mean and variance—and then transforming each posterior draw of the standardized latent variable Z*_t via X_t = F^{-1}_{X_t}(Φ(Z*_t)). This transformation is key: it converts the continuous approximate latent process into integer counts with the correct marginal distributions while preserving the serial dependence structure, so the
Load-bearing premise
The method's central premise is that the standardized latent variable from the normal approximation carries essentially the same serial dependence as the latent Gaussian that would generate the true integer counts, an assumption the paper checks only in simulations with moderately large counts (means 6.7–40, series length 50) and explicitly concedes breaks down for very small counts.
Editorial extensions
If this is right
- Epidemic curve reconstructions can be computed with standard gradient-based Bayesian software instead of custom particle filters or MCMC samplers over discrete latent states, enabling faster and more scalable analyses.
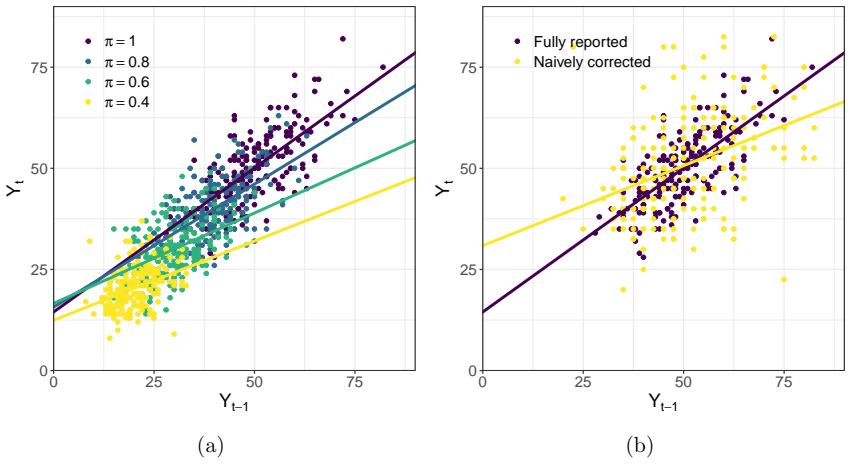
- Published reproduction numbers from Poisson autoregressions fit to under-reported counts are likely to be systematically underestimated unless under-reporting is explicitly modeled.
- The framework extends to multivariate spatiotemporal settings with covariates and additional data sources, as demonstrated by the England conurbation analysis that integrated random PCR testing data.
- The method is designed for series with reasonably large counts; the paper notes the approximation degrades when the mean count falls below about 5.
- Moment-based estimators for the thinned model are too variable for practical use, supporting the need for full posterior inference.
Reading between the lines
- If the normal-normal approximation with the latent Gaussian transform is as accurate as claimed for larger counts, it could serve as a fast surrogate for inference in other latent count models, such as ecology n-mixture or capture-recapture models, where discrete latent states create computational bottlenecks.
- The theoretical result that under-reporting biases ϕ downward implies that apparent declines in reproduction numbers over time may be confounded with improvements in reporting coverage; a testable implication is that regions with better reporting should show higher estimated ϕ from naive fits.
- The paper validates the approximation only for moderately large counts and a single series length; a formal error bound on the Gaussian approximation to the autocorrelation of Z*_t would strengthen the generalizability of the claim.
- The authors' framework naturally supports time-varying reporting probabilities driven by covariates, as they demonstrate for Covid-19; validating reconstructions against independent serosurveys, as they do with REACT data, could become a standard model-checking step.
Signed reviews
Editorial analysis
A structured set of objections, weighed in public.
Referee Report
Summary. The paper studies count-valued autoregressions with under-reporting. Section 2 derives moment-based results characterizing how ignoring binomial thinning biases estimates of the autoregressive parameter φ and the exogenous component ν, with two propositions on when ν is overestimated. Section 3 proposes an approximate Bayesian framework: replace a binomially thinned Poisson autoregression with a normal-normal model, standardize the latent process as Z*, and reconstruct integer counts via the latent Gaussian transformation X_t = F^{-1}_{X_t}(Φ(Z*_t)). The approximation is evaluated in a simulation study and applied to rotavirus data in Saarland and COVID-19 data in England. The paper argues that the approach retains the mechanistic appeal of thinned autoregressions while substantially simplifying inference.
Significance. If the central approximation is valid, this is a practically useful contribution: it offers a software-friendly route to epidemic curve reconstruction in multivariate, covariate-adjusted settings where exact MCMC is infeasible. The Section 2 results on the direction of bias from ignoring under-reporting are also of independent interest and extend earlier moment-matching work. Strengths include the reproducible analysis scripts, the two real-data applications, and the explicit connection to the latent Gaussian count time series construction of Jia et al. (2023). However, the paper's central claim that the approximate posterior is 'virtually identical' to the exact posterior is currently supported mainly by pointwise comparisons, and several implementation details of the approximate model are underspecified.
major comments (4)
- [Section 2 / Appendix A.1] Proposition 1 states a result for 'any consistent estimator' of ν in the misspecified model, but the proof only uses the moment equation \hatν = (1-\hatϕ)\tilde μ. Under misspecification, different estimators (e.g., MLE vs. method of moments) converge to different pseudo-true values, and the Poisson AR MLE need not satisfy this moment equation asymptotically. The claim is therefore overbroad. Please restrict the proposition to estimators based on the moment equations, or prove that all consistent estimators share the same pseudo-true value. The same issue propagates to Proposition 2.
- [Eq. (9) and Eqs. (11)-(12)] The normal-normal model uses variances sqrt(π(1−π)Z_t) and sqrt(λ_t), and model (12) uses a binomial probability of sum_{k=0}^{13} Z_{i,d-k}/pop_i. Since Z_t is Gaussian, it is negative with positive probability, making these expressions undefined or out of range. No positivity or truncation constraint is stated. This is not cosmetic: the approximate posterior is not well defined for negative Z. Please specify how the implementation handles negative Z (truncation, abs(), softplus, or similar) or reparameterize to guarantee positivity.
- [Section 3.3 and Section 4] The central claim Z*_{1:t} ≈ Z^X_{1:t} is validated only by pointwise agreement. Table 1's 'perfect match rate' and Figure 4 compare posterior medians and credible intervals time point by time point; they do not compare the joint serial dependence of the reconstructed X_t (e.g., ACF, partial ACF, or joint distributions of (X_t, X_{t-1})). Since epidemic curve reconstruction is about a coherent trajectory, a distortion of the lag structure would bias reconstructed epidemics even if marginal quantiles line up. Please add diagnostics for joint/autocorrelation structure.
- [Section 3.3 and Section 5.1] The reconstruction algorithm is not fully specified. The paper recommends computing X_t = F^{-1}_{X_t}(Φ(Z*_t)) with Z* the standardized innovations, but the rotavirus application writes X_t = F^{-1}_{X_t}(Φ(Z_t)). Also, F_{X_t} should be the conditional CDF of X_t given the relevant past and λ_t; this dependence is not stated. Please clarify the exact mapping used in the code and in each application.
minor comments (4)
- [Abstract] The sentence 'maps accurately maps this continuous process back to the integers' contains a duplicated phrase.
- [Section 1] Typo: 'thehhhmodel' should be 'the hhh model'.
- [Section 3.2] The sentence about 'attenuate the correlation between X and π' should presumably read 'between Z and π'.
- [Section 4] Minor typos: 'from from' in the Figure 3 caption, and 'mispecified' in Section 5.1. Also, the text says simulations with Rhat>1.05 were removed, but Table 1 says Rhat<1.01 was required; please make the filtering criterion precise.
Circularity Check
No significant circularity; the approximation is validated against the true model, and the latent transform is attributed to external work.
full rationale
The derivation chain is not circular. Section 2 derives the under-reporting consequences from the moment equations of Bracher and Held (2021), an independent external source, and the paper's Propositions 1 and 2 are algebraic consequences proven in Appendix A; no self-citation is used to establish them. The approximate model (9) is explicitly constructed by matching the first two conditional moments of the binomially thinned Poisson autoregression, and the paper does not claim this moment-matching is a prediction. The latent Gaussian transformation X_t = F^{-1}_{X_t}(Phi(Z*_t)) is explicitly borrowed from Jia et al. (2023), an external construction, and its marginal-matching property is a standard probability integral transform, not the paper's own derived output. The load-bearing approximation Z*_{1:t} approximately equal to Z^X_{1:t} is not established by definition; Section 4 tests it by comparing approximate-model reconstructions with MCMC samples from the true data-generating model across simulation scenarios, an external benchmark. No parameter is fitted to a subset and then reported as a prediction, no uniqueness theorem from the authors' own prior work is invoked, and no ansatz is hidden behind a citation. The only self-citation (Slater et al., 2025, Section 5.2.2) is an incidental remark about estimated serial intervals and is not load-bearing for the central claims. The reviewer concern that the simulation validation focuses on pointwise interval agreement rather than joint serial dependence is a genuine robustness/evidence limitation, but it is not circularity by construction.
Assumptions & free parameters
free parameters (3)
- reporting probability pi =
0.274 (rotavirus case study)
- autoregressive/transmission parameter phi =
varies by model and time (e.g., seasonal in rotavirus)
- exogenous mean nu =
varies by model and time (e.g., seasonal in rotavirus)
assumptions (4)
- domain assumption The true data-generating process is a binomially thinned Poisson autoregression with equations (1) and (2).
- standard math The process is stationary with finite moments, requiring phi < 1 and suitable initial conditions.
- ad hoc to paper The normal-normal approximation preserves the posterior distribution of the true model to a practically useful degree.
- ad hoc to paper The latent Gaussian transformation X_t = F^{-1}(Phi(Z*_t)) from Jia et al. (2023) produces a joint posterior of X_t similar to the true integer-valued process.
Cite this review
Pith. "Pith review of Modelling Under-Reported Data: Pitfalls of Na\"ive Approaches and a New Statistical Framework for Epidemic Curve Reconstruction." pith.science (2026). https://pith.science/paper/L7QVK3ZF
@misc{pith2026250910668,
  author       = {Pith},
  title        = {Pith review of: Modelling Under-Reported Data: Pitfalls of Na\"ive Approaches and a New Statistical Framework for Epidemic Curve Reconstruction},
  year         = {2026},
  howpublished = {\url{https://pith.science/paper/L7QVK3ZF}},
  note         = {Machine review of arXiv:2509.10668}
}
read the original abstract
Count-valued autoregressions are widely used to analyse time-series of reported infectious-disease cases because of their close connection with discrete-time transmission models. However, when such models are applied directly to under-reported case counts, their mechanistic interpretation can break down. We establish new theoretical results quantifying the consequences of ignoring under-reporting in these models. To address this issue, reported cases are often modelled as a binomially thinned version of an underlying count process, but such models are difficult to fit because the unobserved true counts are serially correlated and integer-valued. We develop a new statistical framework for under-reported infectious-disease data that uses a normal-normal approximation to a broad class of thinned count autoregressions and then accurately maps this continuous process back to the integers. Through simulations and applications to rotavirus incidence in a German state and Covid-19 incidence in English conurbations, we demonstrate that our approach both retains the mechanistic appeal of thinned autoregressions and substantially simplifies inference.
Figures


Figures from the paper (6 more)


Reference graph
Works this paper leans on
-
[1]
Cici Bauer and Jon Wakefield. Stratified S pace-- T ime I nfectious D isease M odelling, with an A pplication to H and, F oot and M outh D isease in C hina. Journal of the Royal Statistical Society: Series C (Applied Statistics), 67 0 (5): 0 1379--1398, 2018. doi:10.1111/rssc.12284
-
[2]
David I Bernstein. Rotavirus O verview. The P ediatric I nfectious D isease J ournal , 28 0 (3): 0 S50--S53, 2009. doi:10.1097/INF.0b013e3181967bee
-
[3]
Johannes Bracher and Leonhard Held. A M arginal M oment M atching A pproach for F itting E ndemic- E pidemic M odels to U nderreported D isease S urveillance C ounts. Biometrics, 77 0 (4): 0 1202--1214, 2021. doi:10.1111/biom.13371
-
[4]
Johannes Bracher and Leonhard Held. Endemic-epidemic models with discrete-time serial interval distributions for infectious disease prediction. International Journal of Forecasting, 38 0 (3): 0 1221--1233, 2022. doi:10.1016/j.ijforecast.2020.07.002
-
[5]
Statistical A nalysis of T ime S eries: Some R ecent D evelopments
David R Cox, Gudmundur Gudmundsson, Georg Lindgren, Lennart Bondesson, Erik Harsaae, Petter Laake, Katarina Juselius, and Steffen L Lauritzen. Statistical A nalysis of T ime S eries: Some R ecent D evelopments. Scandinavian Journal of Statistics, 8 0 (2): 0 93--115, 1981
1981
-
[6]
de Valpine, C
P. de Valpine, C. Paciorek, D. Turek, N. Michaud, C. Anderson-Bergman, F. Obermeyer, C. Wehrhahn Cortes, A. Rodr \'i guez, D. Temple Lang, W. Zhang, S. Paganin, J. Hug, and P. van Dam-Bates. NIMBLE: MCMC, Particle Filtering, and Programmable Hierarchical Modeling , 2024. URL https://cran.r-project.org/package=nimble
2024
-
[7]
M Bekker-Nielsen Dunbar and L Held. Endemic-Epidemic Framework Used in Covid-19 Modelling:[Discussion on the paper by Nunes, Caetano, Antunes and Dias] . REVSTAT-Statistical Journal, 18 0 (5): 0 565--574, 2020. doi:10.57805/revstat.v18i5.318
-
[8]
Konstantinos Fokianos, Anders Rahbek, and Dag Tj stheim. Poisson A utoregression. Journal of the American Statistical Association, 104 0 (488): 0 1430--1439, 2009. doi:10.1198/jasa.2009.tm08270
Show all 31 references
-
[9]
A statistical framework for the analysis of multivariate infectious disease surveillance counts
Leonhard Held, Michael H \"o hle, and Mathias Hofmann. A statistical framework for the analysis of multivariate infectious disease surveillance counts. Statistical Modelling, 5 0 (3): 0 187--199, 2005. doi:10.1191/1471082X05st098oa
2005 doi
- [10]
-
[11]
Emulating a G ravity M odel to I nfer the S patiotemporal D ynamics of an I nfectious D isease
Roman Jandarov, Murali Haran, Ottar Bj rnstad, and Bryan Grenfell. Emulating a G ravity M odel to I nfer the S patiotemporal D ynamics of an I nfectious D isease. Journal of the Royal Statistical Society Series C: Applied Statistics, 63 0 (3): 0 423--444, 2014. doi:10.1111/rssc.12042
2014 doi
-
[13]
Berg, Hans Skaug, and Bradley M
Kasper Kristensen, Anders Nielsen, Casper W. Berg, Hans Skaug, and Bradley M. Bell. TMB : A utomatic D ifferentiation and L aplace A pproximation. Journal of Statistical Software, 70 0 (5): 0 1--21, 2016. doi:10.18637/jss.v070.i05
2016 doi
-
[14]
Spatio- T emporal A nalysis of E pidemic P henomena using the R P ackage surveillance
Sebastian Meyer, Leonhard Held, and Michael Höhle. Spatio- T emporal A nalysis of E pidemic P henomena using the R P ackage surveillance . Journal of Statistical Software, 77 0 (11): 0 1--55, 2017. doi:10.18637/jss.v077.i11
2017 doi
-
[15]
Slice sampling
Radford M Neal. Slice sampling. The A nnals of S tatistics , 31 0 (3): 0 705--767, 2003. doi:10.1214/aos/1056562461
2003
-
[16]
Coronavirus (covid-19) I nfection S urvey, antibody data, UK: 29 March 2023
Office for National Statistics . Coronavirus (covid-19) I nfection S urvey, antibody data, UK: 29 March 2023 . Statistical bulletin, Office for National Statistics, March 2023. URL https://www.ons.gov.uk/. Accessed March 3, 2025
2023
-
[17]
Faster asymptotic solutions for n-mixtures on large populations
MRP Parker, J Cao, LLE Cowen, and LT Elliott. Faster asymptotic solutions for n-mixtures on large populations. Journal of Agricultural, Biological and Environmental Statistics, pages 1--16, 2024. doi:10.1007/s13253-024-00618-w
2024 doi
-
[18]
Cuts in B ayesian graphical models
Martyn Plummer. Cuts in B ayesian graphical models. Statistics and Computing, 25: 0 37--43, 2015. doi:10.1007/s11222-014-9503-z
2015 doi
-
[19]
Regression M odels for U nderstanding COVID-19 E pidemic D ynamics with I ncomplete D ata
Corbin Quick, Rounak Dey, and Xihong Lin. Regression M odels for U nderstanding COVID-19 E pidemic D ynamics with I ncomplete D ata. Journal of the American Statistical Association, 116 0 (536): 0 1561--1577, 2021. doi:10.1080/01621459.2021.2001339
2021
-
[20]
RE al-time A ssessment of C ommunity T ransmission (REACT) of SARS-CoV-2 virus: S tudy protocol
Steven Riley, Christina Atchison, Deborah Ashby, Christl A Donnelly, Wendy Barclay, Graham S Cooke, Helen Ward, Ara Darzi, Paul Elliott, REACT Study Group, et al. RE al-time A ssessment of C ommunity T ransmission (REACT) of SARS-CoV-2 virus: S tudy protocol. Wellcome Open Res...
2021 doi
-
[21]
Modelling zero inflated and under-reported count data
Debjit Sengupta and Surupa Roy. Modelling zero inflated and under-reported count data. Journal of Statistical Computation and Simulation, 93 0 (14): 0 2390--2409, 2023. doi:10.1080/00949655.2023.2182883
2023
-
[22]
Estimation of mean using under-reported and overdispersed count data
Debjit Sengupta and Surupa Roy. Estimation of mean using under-reported and overdispersed count data. Communications in Statistics-Simulation and Computation, pages 1--23, 2024. doi:10.1080/03610918.2024.2420262
2024
-
[23]
Leveraging cellphone-derived mobility networks to assess C ovid-19 travel risk
Justin J Slater, Patrick E Brown, Jeffrey S Rosenthal, and Jorge Mateu. Leveraging cellphone-derived mobility networks to assess C ovid-19 travel risk. The Annals of Applied Statistics, 19 0 (1): 0 56--74, 2025. doi:10.1214/24-AOAS1914
2025 doi
-
[24]
Wastewater surveillance using differentiable G aussian processes
Emily Somerset and Patrick E Brown. Wastewater surveillance using differentiable G aussian processes. Journal of the Royal Statistical Society Series C: Applied Statistics, page qlae073, 2024. doi:https://doi.org/10.1093/jrsssc/qlae073
2024 doi
-
[25]
RStan : the R interface to Stan , 2025
Stan Development Team . RStan : the R interface to Stan , 2025. URL https://mc-stan.org/. R package version 2.32.7
2025
-
[26]
Model selection and parameter estimation for dynamic epidemic models via iterated filtering: application to rotavirus in G ermany
Theresa Stocks, Tom Britton, and Michael H \"o hle. Model selection and parameter estimation for dynamic epidemic models via iterated filtering: application to rotavirus in G ermany. Biostatistics, 21 0 (3): 0 400--416, 2020. doi:10.1093/biostatistics/kxy057
2020 doi
-
[27]
A Hierarchical Framework for Correcting Under-Reporting in Count Data
Oliver Stoner, Theo Economou, and Gabriela Drummond Marques da Silva. A Hierarchical Framework for Correcting Under-Reporting in Count Data . Journal of the American Statistical Association, 2019. doi:10.1080/01621459.2019.1573732
2019
-
[28]
COVID-19 A rchive D ata D ownload , 2025
UK Health Security Agency . COVID-19 A rchive D ata D ownload , 2025. URL https://ukhsa-dashboard.data.gov.uk/covid-19-archive-data-download. Accessed: March 1, 2025
2025
-
[29]
Jointly estimating epidemiological dynamics of Covid-19 from case and wastewater data in A otearoa N ew Z ealand
Leighton M Watson, Michael J Plank, Bridget A Armstrong, Joanne R Chapman, Joanne Hewitt, Helen Morris, Alvaro Orsi, Michael Bunce, Christl A Donnelly, and Nicholas Steyn. Jointly estimating epidemiological dynamics of Covid-19 from case and wastewater data in A otearoa N ew Z...
2024 doi
-
[30]
Modelling the epidemiological impact of rotavirus vaccination in G ermany-- A B ayesian approach
Felix Weidemann, Manuel Dehnert, Judith Koch, Ole Wichmann, and Michael H \"o hle. Modelling the epidemiological impact of rotavirus vaccination in G ermany-- A B ayesian approach. Vaccine, 32 0 (40): 0 5250--5257, 2014. doi:10.1016/j.vaccine.2014.06.090
2014 doi
-
[31]
Some statistical aspects of the C ovid-19 response
Simon N Wood, Ernst C Wit, Paul M McKeigue, Danshu Hu, Beth Flood, Lauren Corcoran, and Thea Abou Jawad. Some statistical aspects of the C ovid-19 response. To appear in: Journal of the Royal Statistical Society Series A: Statistics in Society, 2025
2025
-
[32]
A negative binomial integer-valued GARCH model
Fukang Zhu. A negative binomial integer-valued GARCH model. Journal of Time Series Analysis, 32 0 (1): 0 54--67, 2011. doi:10.1111/j.1467-9892.2010.00684.x
2011
Reviewed August 4, 2026 · model on record in the stance chip above.
Discussion (0). Continue with ORCID to comment.