Revealing the Connection Between the Filamentary Hierarchy and Star Cluster Formation in a Simulated NGC 628 Galaxy
Pith reviewed 2026-05-17 22:33 UTC · model grok-4.3
The pith
Young star cluster masses in a simulated galaxy inherit their distribution directly from the mass spectrum of the gas filaments that fragment to form them.
A machine-rendered reading of the paper's core claim, the machinery that carries it, and where it could break.
Core claim
The mass function of young star clusters originates from the mass function of their parent filaments through gravitational fragmentation, demonstrated by identical power-law indices of -1.35 at the moment of cluster formation; continued evolution then drives the cluster mass function to a steeper index of -1.55 after 60 Myr as clusters expand and lose mass.
What carries the argument
Gravitational fragmentation of filaments, tracked by comparing the mass probability density functions of filaments and of the clusters they produce, which yields matching power-law slopes at birth.
If this is right
- The initial mass spectrum of star clusters is fixed at the moment their host filaments fragment, before any later dynamical evolution occurs.
- Cluster mass functions become steeper over time because clusters lose mass and grow in radius as they become unbound.
- The observed power-law indices around -1.5 in real galaxies can be explained as the evolved state of an initially flatter distribution inherited from filaments.
- Hierarchical filamentary structure in the interstellar medium directly imprints on the demographics of the first generation of star clusters.
Where Pith is reading between the lines
- If filament mass functions vary across different galactic environments, the birth mass functions of clusters should vary in the same way.
- Simulations that do not resolve individual filaments may need to impose the observed filament mass spectrum as an initial condition to recover realistic cluster populations.
- Future maps of filament masses in nearby galaxies could be used to predict the mass distribution of the youngest clusters before dynamical evolution alters it.
Load-bearing premise
The filament-finding tool and clustering algorithm identify real physical structures rather than introducing selection biases that could force the two mass distributions to match by accident.
What would settle it
A high-resolution simulation or JWST observation of NGC 628 in which the filament mass power-law index differs from the initial cluster mass power-law index by more than the reported uncertainties.
Figures


read the original abstract
There is abundant observational evidence for the hierarchical, interconnected nature of filaments in the interstellar medium (ISM) extending from galactic down to sub-parsec scales. New JWST images of NGC 628 in particular, show clusters forming along the two spiral arms of this galaxy. In this paper we investigate filament and cluster properties in an NGC 628-like multi-scale high-resolution magnetohydrodynamic simulation. We use a filament finding tool to identify filaments and derive the probability density functions (PDFs) for the filament lengths and masses. Using a clustering algorithm we identify star clusters formed between 268 to 278 Myr and follow this population as the galaxy evolves for 60 Myr, calculating their mass PDFs, average radius growth rate, and average mass loss rate. We find a power-law index of alpha_m = -1.35 for the filament masses. Calculating the power-law index from our cluster mass PDF, we find a value of alpha_{c,m} = -1.35 when the clusters first form, exactly our filament mass power-law index. This shows that properties of young clusters arise from the gravitational fragmentation of their host filaments. We track the post-formation evolution of the clusters as they become unbound, increase in radius and decrease in mass yielding an ever steeper mass power-law index. After 60 Myr, the mass power-law index is alpha_{c,m} = -1.55, matching other simulations and observations.
Editorial analysis
A structured set of objections, weighed in public.
Referee Report
Summary. The manuscript reports results from a multi-scale high-resolution MHD simulation of an NGC 628-like galaxy. A filament-finding tool is used to identify filaments and derive PDFs for filament lengths and masses, yielding a mass power-law index α_m = -1.35. A clustering algorithm identifies star clusters formed between 268 and 278 Myr; their mass PDF shows the identical index α_{c,m} = -1.35 at formation. The clusters are then evolved for 60 Myr, during which they become unbound, grow in radius, lose mass, and the mass power-law index steepens to α_{c,m} = -1.55. The authors interpret the initial index match as direct evidence that young cluster properties originate from gravitational fragmentation of their host filaments.
Significance. If the reported index match is shown to be physical rather than methodological, the result would link galactic filament fragmentation directly to the initial mass distribution of young star clusters, providing a numerical basis for the hierarchical nature of star formation observed in galaxies such as NGC 628. The tracking of post-formation evolution (radius growth and mass loss leading to a steeper index) adds a useful temporal dimension that aligns with other simulations and observations. The work is therefore potentially significant for models of clustered star formation, but its impact depends on demonstrating that the identification pipelines do not introduce correlated biases.
major comments (2)
- [Abstract] Abstract: The central claim is that the exact match α_m = -1.35 (filaments) = α_{c,m} = -1.35 (newly formed clusters at 268-278 Myr) demonstrates that cluster properties arise from gravitational fragmentation of host filaments. However, the abstract supplies no details on the filament-finding algorithm, the clustering method, the fitting procedure for the power laws, error bars, or possible selection biases. This omission leaves the equality difficult to evaluate and is load-bearing for the interpretation.
- [Abstract] Abstract and methods description: The interpretation assumes the filament finder (density ridges or similar) and cluster finder (proximity grouping of star particles) recover physically independent structures. No cross-validation is reported, such as spatial overlap statistics, results from alternative finders, or null tests on randomized particle distributions. Without these, the matching indices could arise from shared implicit thresholds or spatial scales rather than from the underlying fragmentation physics.
minor comments (1)
- [Abstract] The time interval 268-278 Myr is described as the formation window; clarifying whether this is a single snapshot or an integrated period over which clusters are identified would improve reproducibility.
Simulated Author's Rebuttal
We thank the referee for their careful and constructive review of our manuscript. The comments highlight important aspects of clarity and validation that we address below. We have revised the manuscript to incorporate additional details and tests as outlined in our point-by-point responses.
read point-by-point responses
-
Referee: [Abstract] Abstract: The central claim is that the exact match α_m = -1.35 (filaments) = α_{c,m} = -1.35 (newly formed clusters at 268-278 Myr) demonstrates that cluster properties arise from gravitational fragmentation of host filaments. However, the abstract supplies no details on the filament-finding algorithm, the clustering method, the fitting procedure for the power laws, error bars, or possible selection biases. This omission leaves the equality difficult to evaluate and is load-bearing for the interpretation.
Authors: We agree that the abstract would benefit from greater methodological transparency to support evaluation of the central claim. In the revised manuscript we have expanded the abstract to include brief descriptions of the filament-finding algorithm (density ridge detection on the gas distribution), the clustering method (proximity-based grouping of star particles), the power-law fitting procedure (maximum-likelihood estimation on the cumulative distribution function), and the approach to uncertainties (bootstrap resampling). We also direct readers to the methods section for discussion of selection biases. These changes make the reported index match more readily evaluable while preserving the abstract's brevity. revision: yes
-
Referee: [Abstract] Abstract and methods description: The interpretation assumes the filament finder (density ridges or similar) and cluster finder (proximity grouping of star particles) recover physically independent structures. No cross-validation is reported, such as spatial overlap statistics, results from alternative finders, or null tests on randomized particle distributions. Without these, the matching indices could arise from shared implicit thresholds or spatial scales rather than from the underlying fragmentation physics.
Authors: This concern about possible methodological correlation is well taken. Although the filament identification operates on the gas density field and the cluster identification on the stellar particle distribution, we acknowledge that the original submission did not include explicit cross-validation. To address this, the revised manuscript now includes spatial overlap statistics between the identified filaments and young clusters, results from an alternative filament-finding algorithm, and null tests performed on randomized star-particle distributions. These additions demonstrate that the power-law index match is not reproduced under randomization and is therefore unlikely to stem from shared thresholds or scales. revision: yes
Circularity Check
No circularity: mass power-law indices are independently measured from distinct identification pipelines on simulation output.
full rationale
The paper extracts alpha_m = -1.35 directly from the filament mass PDF produced by its filament-finding tool and alpha_{c,m} = -1.35 from the cluster mass PDF produced by its separate clustering algorithm applied to star particles at formation time. These are reported as parallel measurements whose numerical agreement is then interpreted as evidence for gravitational fragmentation. No equation defines one index in terms of the other, no parameter is fitted to enforce the match, and the abstract invokes no self-citation or prior ansatz to justify the values. The derivation chain therefore consists of two independent post-processing steps on the same simulation snapshot and remains self-contained against external benchmarks.
Axiom & Free-Parameter Ledger
free parameters (2)
- Cluster formation time window =
268 to 278 Myr
- Post-formation evolution duration =
60 Myr
axioms (2)
- domain assumption The filament finding tool accurately identifies gravitationally relevant structures in the simulated ISM.
- domain assumption The clustering algorithm correctly groups stars into bound clusters and tracks their unbound evolution.
Lean theorems connected to this paper
-
IndisputableMonolith/Cost/FunctionalEquation.leanwashburn_uniqueness_aczel unclear?
unclearRelation between the paper passage and the cited Recognition theorem.
We find a power-law index of α_m = −1.35 for the filament masses. ... α_{c,m} = −1.35 when the clusters first form, exactly our filament mass power-law index. This shows that properties of young clusters arise from the gravitational fragmentation of their host filaments.
-
IndisputableMonolith/Foundation/AlexanderDuality.leanalexander_duality_circle_linking unclear?
unclearRelation between the paper passage and the cited Recognition theorem.
We use a filament finding tool to identify filaments and derive the probability density functions (PDFs) for the filament lengths and masses. Using a clustering algorithm we identify star clusters...
What do these tags mean?
- matches
- The paper's claim is directly supported by a theorem in the formal canon.
- supports
- The theorem supports part of the paper's argument, but the paper may add assumptions or extra steps.
- extends
- The paper goes beyond the formal theorem; the theorem is a base layer rather than the whole result.
- uses
- The paper appears to rely on the theorem as machinery.
- contradicts
- The paper's claim conflicts with a theorem or certificate in the canon.
- unclear
- Pith found a possible connection, but the passage is too broad, indirect, or ambiguous to say the theorem truly supports the claim.
Reference graph
Works this paper leans on
-
[1]
2021, The Astrophysical Journal, 916, 83, doi: 10.3847/1538-4357/ac07a1
Abe, D., Inoue, T., Inutsuka, S.-i., & Matsumoto, T. 2021, The Astrophysical Journal, 916, 83, doi: 10.3847/1538-4357/ac07a1
-
[2]
2014, PLOS ONE, 9, 1, doi: 10.1371/journal.pone.0085777 Andr´ e, P
Alstott, J., Bullmore, E., & Plenz, D. 2014, PLOS ONE, 9, 1, doi: 10.1371/journal.pone.0085777 Andr´ e, P. 2017, Comptes Rendus. G´ eoscience, 349, 187, doi: 10.1016/j.crte.2017.07.002 Andr´ e, P., Di Francesco, J., Ward-Thompson, D., et al. 2014, From Filamentary Networks to Dense Cores in Molecular Clouds: Toward a New Paradigm for Star Formation (Unive...
-
[3]
Aniyan, S., Freeman, K. C., Arnaboldi, M., et al. 2018, Monthly Notices of the Royal Astronomical Society, 476, 1909, doi: 10.1093/mnras/sty310
-
[4]
Arzoumanian, D., Arakawa, S., Kobayashi, M. I. N., et al. 2023, The Astrophysical Journal Letters, 947, L29, doi: 10.3847/2041-8213/acc849
-
[5]
2019, A&A, 621, A42, doi: 10.1051/0004-6361/201832725 Astropy Collaboration, Robitaille, T
Arzoumanian, D., Andr´ e, Ph., K¨ onyves, V., et al. 2019, A&A, 621, A42, doi: 10.1051/0004-6361/201832725 Astropy Collaboration, Robitaille, T. P., Tollerud, E. J., et al. 2013, A&A, 558, A33, doi: 10.1051/0004-6361/201322068 Astropy Collaboration, Price-Whelan, A. M., Sip˝ ocz, B. M., et al. 2018, AJ, 156, 123, doi: 10.3847/1538-3881/aabc4f Astropy Coll...
-
[6]
Campello, R. J. G. B., Moulavi, D., & Sander, J. 2013, in Advances in Knowledge Discovery and Data Mining, ed. J. Pei, V. S. Tseng, L. Cao, H. Motoda, & G. Xu (Berlin, Heidelberg: Springer Berlin Heidelberg), 160–172
work page 2013
-
[7]
Chen, Y., Li, H., & Gnedin, O. Y. 2025, The Astrophysical Journal Letters, 980, L18, doi: 10.3847/2041-8213/adaf93
-
[8]
Chevance, M., Kruijssen, J. M. D., Hygate, A. P. S., et al. 2019, Monthly Notices of the Royal Astronomical Society, 493, 2872, doi: 10.1093/mnras/stz3525
-
[9]
Chiang, I.-D., Sandstrom, K. M., Chastenet, J., et al. 2021, The Astrophysical Journal, 907, 29, doi: 10.3847/1538-4357/abceb6 ESA/Webb, CSA, N. ., Lee, J., & Team, P.-J. 2022, Webb Inspects the Heart of the Phantom Galaxy,
-
[10]
2016, Monthly Notices of the Royal Astronomical Society, 457, 375, doi: 10.1093/mnras/stv2880
Federrath, C. 2016, Monthly Notices of the Royal Astronomical Society, 457, 375, doi: 10.1093/mnras/stv2880
-
[11]
Fiege, J. D., & Pudritz, R. E. 2000, Monthly Notices of the Royal Astronomical Society, 311, 85, doi: 10.1046/j.1365-8711.2000.03066.x Gaia Collaboration, Vallenari, A., Brown, A. G. A., et al. 2023, A&A, 674, A1, doi: 10.1051/0004-6361/202243940 Galv´ an-Madrid, R., Zhang, Q., Keto, E., et al. 2010, The Astrophysical Journal, 725, 17, doi: 10.1088/0004-6...
-
[12]
Hacar, A., Clark, S., Heitsch, F., et al. 2022, Initial Conditions for Star Formation: A Physical Description of the Filamentary ISM, https://arxiv.org/abs/2203.09562
-
[13]
2024, Astronomy &; Astrophysics, 694, A69, doi: 10.1051/0004-6361/202450779
Hacar, A., Konietzka, R., Seifried, D., et al. 2024, Astronomy &; Astrophysics, 694, A69, doi: 10.1051/0004-6361/202450779
-
[14]
Harris, C. R., Millman, K. J., van der Walt, S. J., et al. 2020, Nature, 585, 357, doi: 10.1038/s41586-020-2649-2
-
[15]
2023, Monthly Notices of the Royal Astronomical Society, 521, 5152–5159, doi: 10.1093/mnras/stad852
Hoemann, E., Heigl, S., & Burkert, A. 2023, Monthly Notices of the Royal Astronomical Society, 521, 5152–5159, doi: 10.1093/mnras/stad852
-
[16]
Howard, C. S., Pudritz, R. E., Sills, A., & Harris, W. E. 2019, Monthly Notices of the Royal Astronomical Society, 486, 1146–1155, doi: 10.1093/mnras/stz924
-
[17]
Hunter, J. D. 2007, Computing in Science & Engineering, 9, 90, doi: 10.1109/MCSE.2007.55
-
[18]
Inutsuka, S.-i., & Miyama, S. M. 1997, The Astrophysical Journal, 480, 681, doi: 10.1086/303982
-
[19]
Kahre, L., Walterbos, R. A., Kim, H., et al. 2018, The Astrophysical Journal, 855, 133, doi: 10.3847/1538-4357/aab101
-
[20]
Karam, J., Fujii, M. S., & Sills, A. 2025, Dynamics of Star Cluster Formation: The Effects of Ongoing Star Formation and Stellar Feedback, https://arxiv.org/abs/2503.21716
-
[21]
Kashyap, V., Lee, H., Siemiginowska, A., et al. 2008, Proceedings of SPIE - The International Society for Optical Engineering, doi: 10.1117/12.788372
-
[22]
Kim, J., Chevance, M., Kruijssen, J. M. D., et al. 2022, Monthly Notices of the Royal Astronomical Society, 516, 3006–3028, doi: 10.1093/mnras/stac2339
-
[23]
2016, ApJ, 833, 202, doi: 10.3847/1538-4357/833/2/202
Kim, J.-h., Agertz, O., Teyssier, R., et al. 2016, The Astrophysical Journal, 833, 202, doi: 10.3847/1538-4357/833/2/202
-
[24]
Kirk, H., Myers, P. C., Bourke, T. L., et al. 2013, The Astrophysical Journal, 766, 115, doi: 10.1088/0004-637x/766/2/115
-
[25]
Koch, E. W., & Rosolowsky, E. W. 2015, Monthly Notices of the Royal Astronomical Society, 452, 3435, doi: 10.1093/mnras/stv1521
-
[26]
Inutsuka, S. I. 2020, Astronomy &; Astrophysics, 642, A87, doi: 10.1051/0004-6361/202038232 17
-
[27]
2024, A&A, 681, A45, doi: 10.1051/0004-6361/202347268
Lacchin, E., Mastrobuono-Battisti, A., Calura, F., et al. 2024, A&A, 681, A45, doi: 10.1051/0004-6361/202347268
-
[28]
2025, The Astrophysical Journal, 989, 22, doi: 10.3847/1538-4357/ade9b5
Laverde-Villarreal, E., Sills, A., Cournoyer-Cloutier, C., & Arias Callejas, V. 2025, The Astrophysical Journal, 989, 22, doi: 10.3847/1538-4357/ade9b5
-
[29]
Lee, J. C., Sandstrom, K. M., Leroy, A. K., et al. 2023, ApJL, 944, L17, doi: 10.3847/2041-8213/acaaae
-
[30]
K., Hughes, A., Liu, D., et al
Leroy, A. K., Hughes, A., Liu, D., et al. 2021, ApJS, 255, 19, doi: 10.3847/1538-4365/abec80
-
[31]
Malicious User Experience Design Research for Cybersecurity
McKee, C. F., & Ostriker, E. C. 2007, Annual Review of Astronomy and Astrophysics, 45, 565–687, doi: 10.1146/annurev.astro.45.051806.110602
work page internal anchor Pith review Pith/arXiv arXiv doi:10.1146/annurev.astro.45.051806.110602 2007
-
[32]
Myers, P. C. 2009, ApJ, 700, 1609, doi: 10.1088/0004-637X/700/2/1609
- [33]
-
[34]
1964, ApJ, 140, 1056, doi: 10.1086/148005 pandas development team, T
Ostriker, J. 1964, ApJ, 140, 1056, doi: 10.1086/148005 pandas development team, T. 2025, pandas-dev/pandas: Pandas, v2.3.3 Zenodo, doi: 10.5281/zenodo.17229934
-
[35]
Peretto, N., Fuller, G. A., Andr´ e, P., et al. 2014, Astronomy &; Astrophysics, 561, A83, doi: 10.1051/0004-6361/201322172
-
[36]
2013, Astronomy &; Astrophysics, 559, A38, doi: 10.1051/0004-6361/201322134
Pfalzner, S., & Kaczmarek, T. 2013, Astronomy &; Astrophysics, 559, A38, doi: 10.1051/0004-6361/201322134
-
[37]
Pillsworth, R., Roscoe, E., Pudritz, R. E., & Koch, E. W. 2025a, Filamentary Hierarchies and Superbubbles I: Characterizing filament properties across a simulated spiral galaxy, https://arxiv.org/abs/2504.01099
-
[38]
Pillsworth, R., Roscoe, E., Pudritz, R. E., & Koch, E. W. 2025b, The Astrophysical Journal, 989, 233, doi: 10.3847/1538-4357/adf62c
-
[39]
Plummer, H. C. 1911, MNRAS, 71, 460, doi: 10.1093/mnras/71.5.460
-
[40]
Rice, T. S., Goodman, A. A., Bergin, E. A., Beaumont, C., & Dame, T. M. 2016, The Astrophysical Journal, 822, 52, doi: 10.3847/0004-637X/822/1/52
-
[41]
Robinson, H., Wadsley, J., Sellwood, J. A., & Pudritz, R. E. 2025, Star Formation and Magnetic Field Amplification due to Galactic Spirals, https://arxiv.org/abs/2506.16515
-
[42]
2019, Monthly Notices of the Royal Astronomical Society, 492, 5420, doi: 10.1093/mnras/stz3466
Schisano, E., Molinari, S., Elia, D., et al. 2019, Monthly Notices of the Royal Astronomical Society, 492, 5420, doi: 10.1093/mnras/stz3466
-
[43]
Schneider, S., & Elmegreen, B. G. 1979, ApJS, 41, 87, doi: 10.1086/190609
-
[44]
2023, A&A, 672, A133, doi: 10.1051/0004-6361/202140857
Shimajiri, Y., Andr´ e, Ph., Peretto, N., et al. 2023, A&A, 672, A133, doi: 10.1051/0004-6361/202140857
-
[45]
Smith, R. J., Shetty, R., Stutz, A. M., & Klessen, R. S. 2012, The Astrophysical Journal, 750, 64, doi: 10.1088/0004-637x/750/1/64
-
[46]
Tang, J., Grasha, K., & Krumholz, M. R. 2024, Monthly Notices of the Royal Astronomical Society, 532, 4583, doi: 10.1093/mnras/stae1799
-
[47]
Temim, T., Laming, J. M., Kavanagh, P. J., et al. 2024, The Astrophysical Journal Letters, 968, L18, doi: 10.3847/2041-8213/ad50d1
-
[48]
2002, A&A, 385, 337, doi: 10.1051/0004-6361:20011817
Teyssier, R. 2002, Astronomy &; Astrophysics, 385, 337, doi: 10.1051/0004-6361:20011817 The pandas development team. 2020, pandas-dev/pandas: Pandas, latest Zenodo, doi: 10.5281/zenodo.3509134
-
[49]
Thilker, D. A., Lee, J. C., Deger, S., et al. 2023, The Astrophysical Journal Letters, 944, L13, doi: 10.3847/2041-8213/acaeac van der Giessen, S. A., Matsumoto, K., Relano, M., et al. 2024, Radial properties of dust in galaxies: Comparison between observations and isolated galaxy simulations, https://arxiv.org/abs/2410.21430
-
[50]
Virtanen, P., Gommers, R., Oliphant, T. E., et al. 2020, Nature Methods, 17, 261, doi: 10.1038/s41592-019-0686-2
-
[51]
2015, Monthly Notices of the Royal Astronomical Society, 450, 4043, doi: 10.1093/mnras/stv735
Wang, K., Testi, L., Ginsburg, A., et al. 2015, Monthly Notices of the Royal Astronomical Society, 450, 4043, doi: 10.1093/mnras/stv735
-
[52]
Wells, M. R. A., Beuther, H., Molinari, S., et al. 2024, Astronomy &; Astrophysics, 690, A185, doi: 10.1051/0004-6361/202449794
-
[53]
C., Chandar, R., Rodr´ ıguez, M
Whitmore, B. C., Chandar, R., Rodr´ ıguez, M. J., et al. 2023, The Astrophysical Journal Letters, 944, L14, doi: 10.3847/2041-8213/acae94
-
[54]
J., Srinivasan, S., Pudritz, R
Whitworth, D. J., Srinivasan, S., Pudritz, R. E., et al. 2025, On the relation between magnetic field strength and gas density in the interstellar medium: A multiscale analysis, https://arxiv.org/abs/2407.18293
-
[55]
Williams, T. G., Sun, J., Barnes, A. T., et al. 2022, The Astrophysical Journal Letters, 941, L27, doi: 10.3847/2041-8213/aca674
-
[56]
Williams, T. G., Lee, J. C., Larson, K. L., et al. 2024, PHANGS-JWST: Data Processing Pipeline and First Full Public Data Release, https://arxiv.org/abs/2401.15142
-
[57]
Wadsley, J. 2024, Filamentary Hierarchies and Superbubbles: Galactic Multiscale MHD Simulations of GMC to Star Cluster Formation, https://arxiv.org/abs/2405.18474
-
[58]
2024, A&A, 691, A204, doi: 10.1051/0004-6361/202452064
Zhou, Jian-Wen, Kroupa, Pavel, & Wu, Wenjie. 2024, A&A, 691, A204, doi: 10.1051/0004-6361/202452064
-
[59]
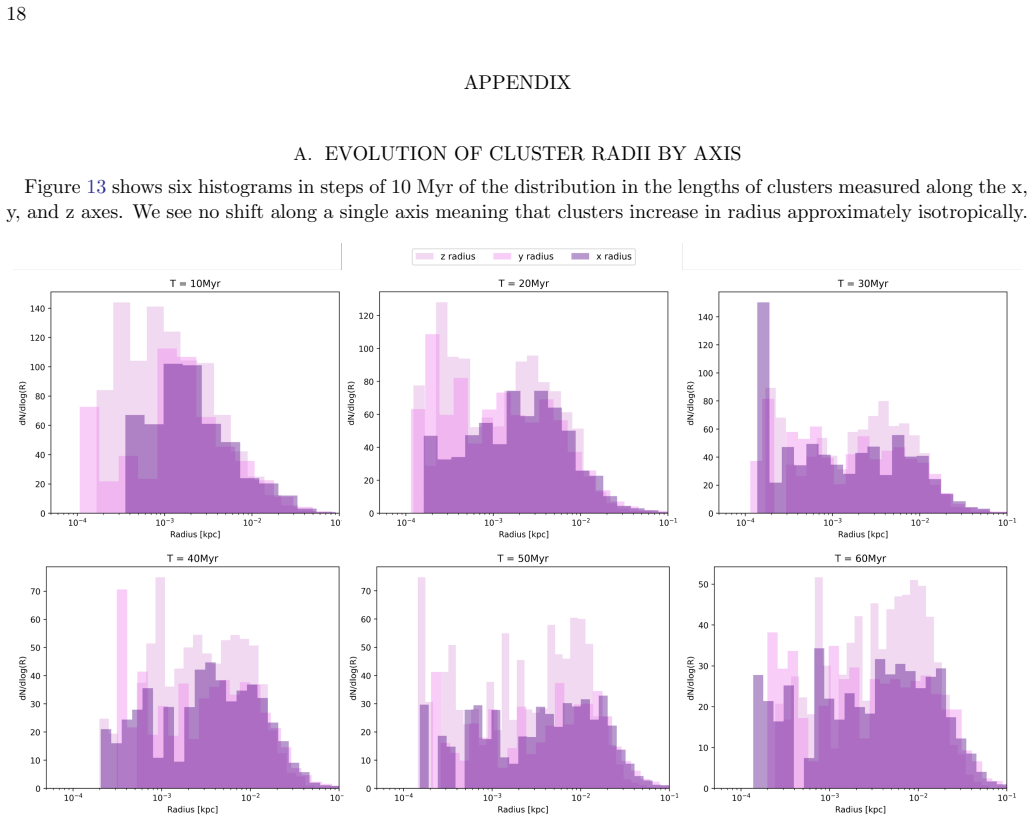
Zucker, C., Battersby, C., & Goodman, A. 2018, The Astrophysical Journal, 864, 153, doi: 10.3847/1538-4357/aacc66 18 APPENDIX A.EVOLUTION OF CLUSTER RADII BY AXIS Figure 13 shows six histograms in steps of 10 Myr of the distribution in the lengths of clusters measured along the x, y, and z axes. We see no shift along a single axis meaning that clusters in...
discussion (0)
Sign in with ORCID, Apple, or X to comment. Anyone can read and Pith papers without signing in.