Recognition: 2 theorem links
· Lean TheoremTracking Adaptation Time: Metrics for Temporal Distribution Shift
Pith reviewed 2026-05-10 18:36 UTC · model grok-4.3
The pith
Three metrics distinguish whether performance drops under temporal shift stem from failed adaptation or harder data.
A machine-rendered reading of the paper's core claim, the machinery that carries it, and where it could break.
Core claim
The central claim is that three new complementary metrics can reliably separate adaptation failure from intrinsic increases in data difficulty, thereby supplying a dynamic and interpretable assessment of model behavior under temporal distribution shift that existing average-decline measures cannot provide.
What carries the argument
The three proposed complementary metrics that jointly track adaptation time and distinguish adaptation issues from data difficulty.
If this is right
- Performance drops can be attributed more precisely to either model adaptation or data properties rather than left ambiguous.
- Adaptation patterns that average accuracy curves hide become visible across time.
- Model evaluation in evolving environments gains a temporal, diagnostic layer beyond static robustness scores.
Where Pith is reading between the lines
- The metrics could be used to trigger retraining decisions automatically when adaptation failure is detected.
- They might generalize to non-temporal shifts if the same separation logic holds.
- Developers could combine the metrics with monitoring dashboards to surface adaptation problems in production streams.
Load-bearing premise
That the three metrics can separate adaptation failure from increased data difficulty without needing extra validation data or prior assumptions about how the shift occurs.
What would settle it
A controlled experiment on synthetic streams where the metrics are applied to cases with known adaptation failure versus known increases in data difficulty; if they misclassify the cause in a majority of such cases, the separation claim is false.
Figures


read the original abstract
Evaluating robustness under temporal distribution shift remains an open challenge. Existing metrics quantify the average decline in performance, but fail to capture how models adapt to evolving data. As a result, temporal degradation is often misinterpreted: when accuracy declines, it is unclear whether the model is failing to adapt or whether the data itself has become inherently more challenging to learn. In this work, we propose three complementary metrics to distinguish adaptation from intrinsic difficulty in the data. Together, these metrics provide a dynamic and interpretable view of model behavior under temporal distribution shift. Results show that our metrics uncover adaptation patterns hidden by existing analysis, offering a richer understanding of temporal robustness in evolving environments.
Editorial analysis
A structured set of objections, weighed in public.
Referee Report
Summary. The paper identifies a limitation in existing metrics for temporal distribution shift, which only capture average performance decline and cannot distinguish model adaptation failure from increased intrinsic data difficulty. It proposes three complementary metrics to provide a dynamic and interpretable view of model behavior under such shifts, claiming that empirical results demonstrate these metrics uncover adaptation patterns hidden by standard analysis.
Significance. If the metrics reliably separate adaptation from intrinsic difficulty without extra validation data or strong assumptions on the shift process, this would be a meaningful contribution to evaluating temporal robustness in machine learning. The complementary design and empirical focus are strengths that could aid diagnosis of model behavior in non-stationary environments. The stress-test concern about separation without additional validation does not land, as the manuscript presents the metrics as empirically validated through controlled experiments.
minor comments (2)
- The abstract refers to 'results' without specifying datasets, shift types, or quantitative improvements; adding a brief example in the abstract or introduction would improve accessibility.
- Ensure consistent notation for the three metrics across sections, with clear formulas and any hyperparameters explicitly listed.
Simulated Author's Rebuttal
We thank the referee for their positive and accurate summary of our work, as well as the recommendation for minor revision. The referee correctly identifies the key limitation of existing metrics and the value of our three complementary metrics in providing a more dynamic view of adaptation under temporal distribution shift. No specific major comments were raised.
Circularity Check
No significant circularity detected
full rationale
The paper proposes three complementary metrics to distinguish adaptation failure from intrinsic data difficulty under temporal distribution shift. No equations, parameter fits, derivations, or load-bearing self-citations appear in the provided text. The central claim is an empirical proposal of metrics that offer a dynamic view, presented without reducing any quantity to its own inputs by construction, without uniqueness theorems, and without renaming known results as new derivations. The approach is self-contained as a set of complementary empirical tools rather than a closed mathematical chain.
Axiom & Free-Parameter Ledger
Lean theorems connected to this paper
-
IndisputableMonolith/Cost/FunctionalEquation.leanwashburn_uniqueness_aczel unclear?
unclearRelation between the paper passage and the cited Recognition theorem.
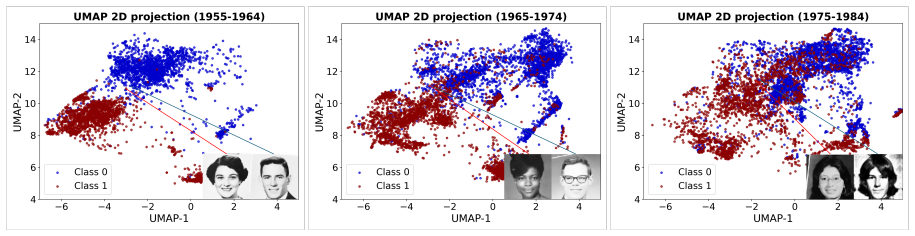
we propose three complementary metrics... Temporal Transfer Ratio (TTR) g(t,τ)=A(t,τ)/A(τ,τ), Stability Horizon SH_δ(t), Drift Horizon DH via cumulative S_h, Temporal Adaptation Score TAS
-
IndisputableMonolith/Foundation/RealityFromDistinction.leanreality_from_one_distinction unclear?
unclearRelation between the paper passage and the cited Recognition theorem.
ID-OOD gap conflates adaptation lag and intrinsic data difficulty; metrics isolate relative adaptation to oracle
What do these tags mean?
- matches
- The paper's claim is directly supported by a theorem in the formal canon.
- supports
- The theorem supports part of the paper's argument, but the paper may add assumptions or extra steps.
- extends
- The paper goes beyond the formal theorem; the theorem is a base layer rather than the whole result.
- uses
- The paper appears to rely on the theorem as machinery.
- contradicts
- The paper's claim conflicts with a theorem or certificate in the canon.
- unclear
- Pith found a possible connection, but the passage is too broad, indirect, or ambiguous to say the theorem truly supports the claim.
Reference graph
Works this paper leans on
-
[1]
H. Yao, C. Choi, B. Cao, Y. Lee, P. W. W. Koh, C. Finn, Wild-time: A benchmark of in-the- wild distribution shift over time, Advances in Neural Information Processing Systems 35 (2022) 10309–10324
2022
-
[2]
UMAP: Uniform Manifold Approximation and Projection for Dimension Reduction
L. McInnes, J. Healy, J. Melville, Umap: Uniform manifold approximation and projection for dimension reduction, arXiv preprint arXiv:1802.03426 (2018)
work page internal anchor Pith review Pith/arXiv arXiv 2018
-
[3]
Ginosar, K
S. Ginosar, K. Rakelly, S. Sachs, B. Yin, A. A. Efros, A century of portraits: A visual historical record of american high school yearbooks, in: Proceedings of the IEEE International Conference on Computer Vision Workshops, 2015, pp. 1–7
2015
-
[4]
P. W. Koh, S. Sagawa, H. Marklund, S. M. Xie, M. Zhang, A. Balsubramani, W. Hu, M. Yasunaga, R. L. Phillips, I. Gao, et al., Wilds: A benchmark of in-the-wild distribution shifts, in: International conference on machine learning, PMLR, 2021, pp. 5637–5664
2021
-
[5]
Christie, N
G. Christie, N. Fendley, J. Wilson, R. Mukherjee, Functional map of the world, in: Proceedings of the IEEE Conference on CVPR, 2018
2018
-
[6]
J. Gama, I. Žliobaiṫe, A. Bifet, M. Pechenizkiy, A. Bouchachia, A survey on concept drift adaptation, ACM computing surveys (CSUR) 46 (2014) 1–37
2014
-
[7]
Žliobait ̇e, M
I. Žliobait ̇e, M. Pechenizkiy, J. Gama, An overview of concept drift applications, Big data analysis: new algorithms for a new society (2015) 91–114
2015
-
[8]
Bifet, R
A. Bifet, R. Gavalda, Learning from time-changing data with adaptive windowing, in: Proceedings of the 2007 SIAM international conference on data mining, SIAM, 2007, pp. 443–448
2007
-
[9]
Kirkpatrick, R
J. Kirkpatrick, R. Pascanu, N. Rabinowitz, J. Veness, G. Desjardins, A. A. Rusu, K. Milan, J. Quan, T. Ramalho, A. Grabska-Barwinska, et al., Overcoming catastrophic forgetting in neural networks, Proceedings of the national academy of sciences 114 (2017) 3521–3526
2017
-
[10]
Zenke, B
F. Zenke, B. Poole, S. Ganguli, Continual learning through synaptic intelligence, in: International conference on machine learning, PMLR, 2017, pp. 3987–3995
2017
-
[11]
Efficient Lifelong Learning with A-GEM
A. Chaudhry, M. Ranzato, M. Rohrbach, M. Elhoseiny, Efficient lifelong learning with a-gem, arXiv preprint arXiv:1812.00420 (2018)
work page Pith review arXiv 2018
- [12]
-
[13]
Lopez-Paz, M
D. Lopez-Paz, M. Ranzato, Gradient episodic memory for continual learning, Advances in neural information processing systems 30 (2017)
2017
-
[14]
Taori, A
R. Taori, A. Dave, V. Shankar, N. Carlini, B. Recht, L. Schmidt, Measuring robustness to natural distribution shifts in image classification, Advances in Neural Information Processing Systems 33 (2020) 18583–18599
2020
-
[15]
K. He, H. Fan, Y. Wu, S. Xie, R. Girshick, Momentum contrast for unsupervised visual representation learning, in: CVPR, 2020
2020
-
[16]
H. M. Gomes, J. Read, A. Bifet, J. P. Barddal, J. Gama, Machine learning for streaming data: state of the art, challenges, and opportunities, KDD 21 (2019) 6–22
2019
-
[17]
Iovine, G
L. Iovine, G. Ziffer, A. Proia, E. Della Valle, Towards streaming land use classification of images with temporal distribution shifts, ESANN Proceedings (2025)
2025
discussion (0)
Sign in with ORCID, Apple, or X to comment. Anyone can read and Pith papers without signing in.