Recognition: unknown
Galactic Rain: Cool Gas Inflows in Red Geyser Galaxies and Their Connection to AGN Activity and Interactions
Pith reviewed 2026-05-10 14:32 UTC · model grok-4.3
The pith
Galaxy interactions replenish cool gas reservoirs in red geysers, fueling AGN activity and sustaining radio emission to regulate quiescence.
A machine-rendered reading of the paper's core claim, the machinery that carries it, and where it could break.
Core claim
Red geyser galaxies host predominantly inflowing cool gas traced by Na I D absorption, with detection fractions of 63 percent versus 40 percent in controls and reservoir areas 1.6 times larger. Radio-detected systems show inflowing gas reservoirs seven times larger than non-radio red geysers, while galaxies subject to environmental effects host reservoirs 2.7 times larger than isolated red geysers. Acceleration and accretion timescales of roughly 1 Myr and 20 Myr indicate the absorbing clouds are young and short-lived, supporting the view that galaxy interactions replenish cool gas reservoirs to fuel AGN activity, sustain radio emission, and regulate long-term quiescence.
What carries the argument
Spatially resolved Na I D absorption velocities and reservoir sizes, which reveal inflow kinematics and their correlations with radio detection and environmental effects.
If this is right
- Cool gas inflows in red geysers occur at only about 10 percent of free-fall speed and exhibit ordered motions with velocity dispersion 0.4 times that of the stars.
- The absorbing clouds are short-lived, with acceleration timescales around 1 million years and accretion timescales around 20 million years.
- Red geysers maintain quiescence through cycles of gas inflow that fuel low-level AGN feedback and radio emission.
- Environmental interactions increase the prevalence and extent of cool gas inflows compared to isolated systems.
Where Pith is reading between the lines
- The same inflow-AGN cycle may operate in other populations of massive quiescent galaxies beyond the red geyser selection.
- Direct measurements of merger or interaction rates in red geysers could provide an independent test of the replenishment mechanism.
- Environmental density may influence the duty cycle of low-level AGN activity in quiescent galaxies more broadly.
Load-bearing premise
That observed differences in Na I D reservoir sizes between radio-detected, environmentally affected, and control red geysers arise from causal connections to interactions and AGN rather than selection effects or unaccounted variables.
What would settle it
A larger sample of red geysers showing no significant difference in cool gas reservoir sizes between radio-detected versus non-radio systems or between environmentally affected versus isolated systems after matching on stellar mass and other observables.
Figures


read the original abstract
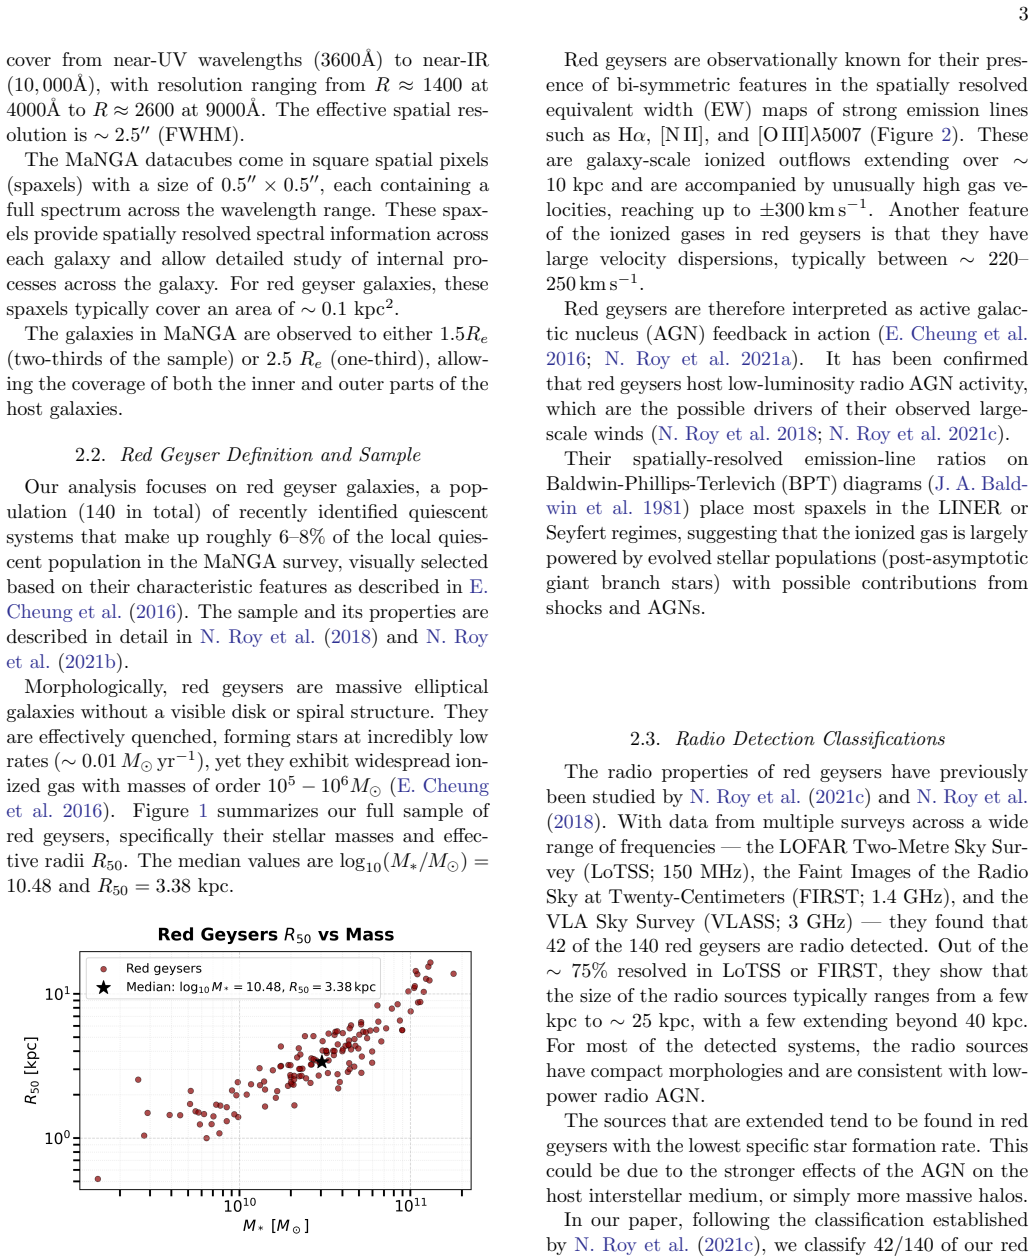
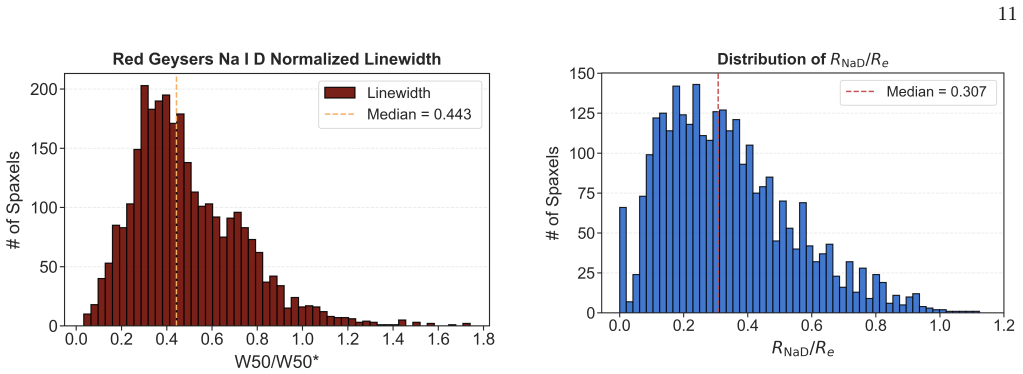
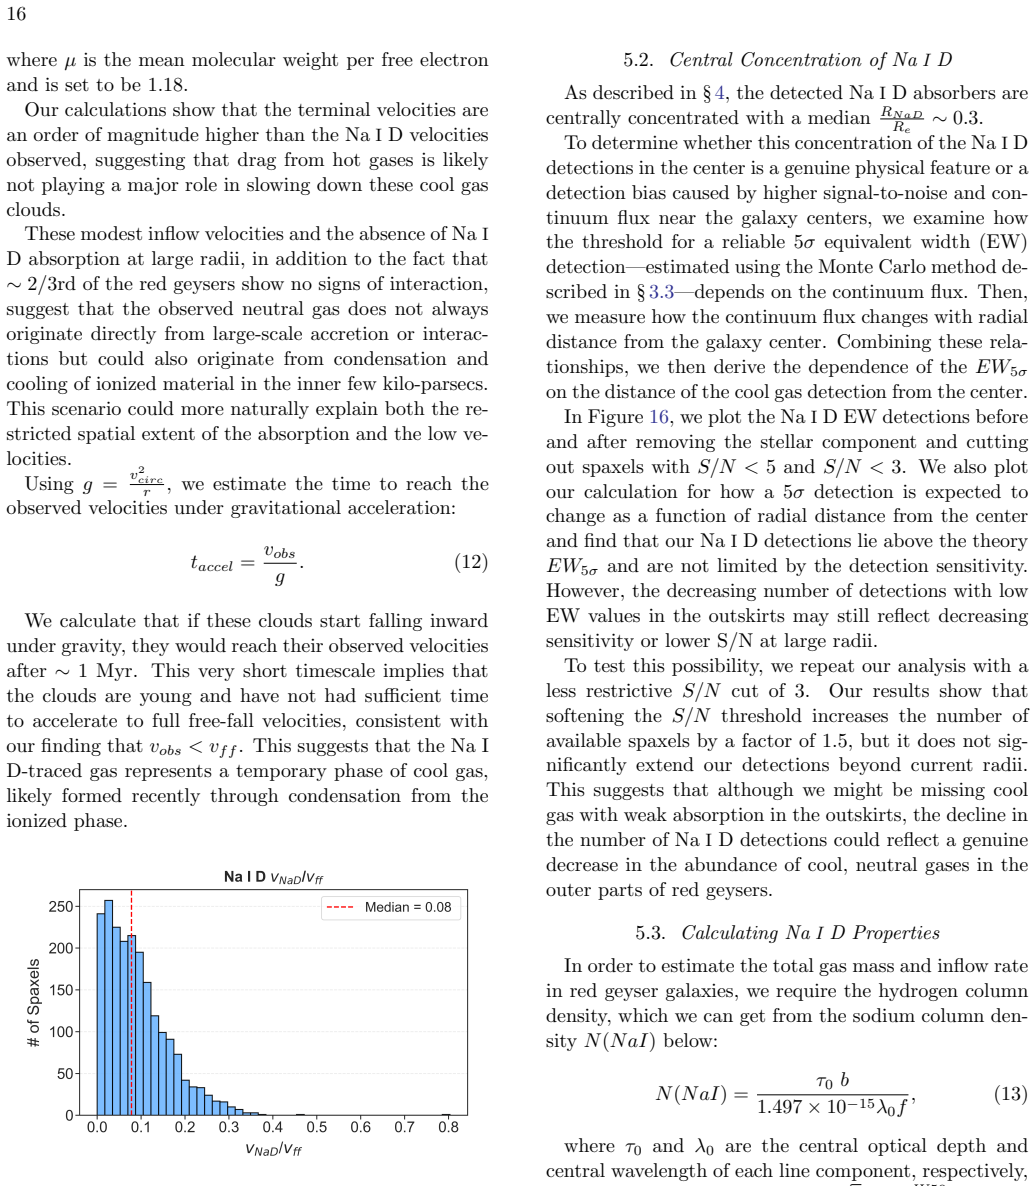
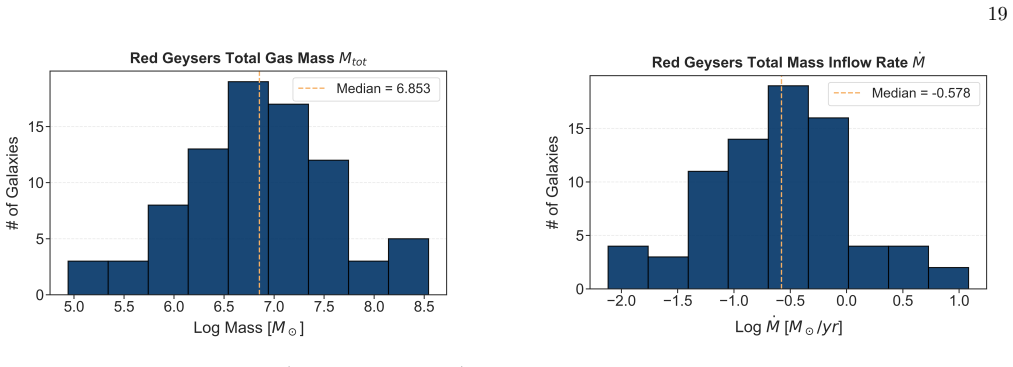
Red geysers are a population of massive (log[M/M$_\odot$]~10.5), quiescent galaxies that exhibit large-scale but weak, bi-symmetric ionized gas outflows, interpreted as signatures of ongoing, low-level active galactic nucleus (AGN) feedback. We investigate the kinematics and prevalence of cool (T~100-1000K), neutral gas traced by Na I D absorption, and its connection to galaxy environment and AGN activity. Using 140 red geyser galaxies from the Sloan Digital Sky Survey-IV Mapping Nearby Galaxies at Apache Point Observatory (MaNGA), we measure spatially resolved velocities and dispersions via double-Gaussian fits to the Na I D doublet. We find that ~70% of the cool gas is inflowing, with a median velocity of ~47 km/s (~10% of the expected free-fall speed), and also exhibits kinematically ordered motions with ${\sigma}_{NaD}$/${\sigma_*}$~0.4. Additionally, the Na I D absorption is more prevalent in red geysers than in a matched control sample, showing a higher detection fraction (63% vs 40%) and reservoir areas ~1.6 times larger. Acceleration (~1 Myr) and accretion (~20 Myr) timescales indicate that the absorbing clouds are likely young and short-lived. Another intriguing result is that radio-detected red geysers (30% of the sample) show inflowing gas reservoirs ~7 times larger than in non-radio systems. Similarly, galaxies subject to environmental effects host inflowing gas reservoirs ~2.7 times larger than isolated red geysers. We take this as evidence that galaxy interactions play a key role in replenishing the cool gas reservoirs of red geysers, fueling central AGN activity, sustaining radio emission, and regulating long-term quiescence. These findings reveal that quiescent systems are governed by cycles of inflow, feedback, and regulation.
Editorial analysis
A structured set of objections, weighed in public.
Referee Report
Summary. The paper examines cool neutral gas in 140 red geyser galaxies from MaNGA, using double-Gaussian fits to Na I D absorption to measure spatially resolved kinematics. It reports that ~70% of the gas is inflowing at a median velocity of ~47 km/s (~10% of free-fall), with kinematically ordered motions (σ_NaD/σ_* ~0.4). Red geysers show higher Na I D detection fractions (63% vs 40%) and ~1.6x larger reservoirs than a matched control sample. Radio-detected systems (30% of sample) have ~7x larger inflowing reservoirs than non-radio ones, while environmentally affected galaxies have ~2.7x larger reservoirs than isolated red geysers. The authors interpret these differences as evidence that galaxy interactions replenish cool gas reservoirs, fuel central AGN activity, sustain radio emission, and help regulate long-term quiescence.
Significance. If the central correlations hold after bias checks, the work strengthens the picture of gas cycles in quiescent massive galaxies by linking cool inflows to AGN feedback and environment. It adds to evidence that red geysers are not fully static but experience ongoing accretion and regulation. Strengths include the use of a sizable MaNGA sample with spatially resolved spectroscopy and direct comparison to a control sample; the kinematic decomposition and timescale estimates (accretion ~20 Myr) are useful for future modeling. The result is relevant to understanding how quiescence is maintained despite the presence of gas.
major comments (3)
- [Abstract] Abstract: the central claim that radio-detected red geysers host ~7 times larger inflowing Na I D reservoirs (and thus that interactions fuel AGN and sustain radio emission) is load-bearing, yet the abstract provides no information on whether the radio-detected subsample was re-matched to the non-radio subsample on the same variables (stellar mass, redshift, local density) used for the primary control sample. Without this, the factor-of-7 difference cannot be distinguished from selection effects arising from the red geyser definition or MaNGA fiber coverage.
- [Abstract] Abstract: the reported ~2.7 times larger reservoirs in environmentally affected red geysers is similarly central to the interaction-replenishment interpretation, but the text does not demonstrate that the environmental split survives explicit matching or that the red geyser selection (which already incorporates ionized-gas kinematics and quiescence) does not preferentially select systems with detectable neutral gas in denser environments.
- [Abstract] Abstract: the overall detection fraction (63% vs 40%) and reservoir area ratio (~1.6) are presented as evidence of enhanced cool gas in red geysers, but without tabulated sample sizes, error propagation on the double-Gaussian fit parameters, or a description of how reservoir areas are integrated from the fits, it is not possible to assess whether these ratios are robust to the fitting choices or to the definition of 'detection'.
minor comments (2)
- [Abstract] The notation σ_NaD/σ_* ~0.4 is given without specifying whether this is a median, mean, or typical value across the sample, or how the stellar dispersion is measured in the same apertures.
- [Abstract] The acceleration (~1 Myr) and accretion (~20 Myr) timescales are stated without the explicit formulas or assumptions (e.g., cloud size, density) used to derive them from the observed velocities and reservoir sizes.
Simulated Author's Rebuttal
We thank the referee for their careful reading of the manuscript and for highlighting these points about the abstract. We address each major comment below and will make corresponding revisions to improve clarity and address potential concerns about selection effects and methodological transparency.
read point-by-point responses
-
Referee: [Abstract] Abstract: the central claim that radio-detected red geysers host ~7 times larger inflowing Na I D reservoirs (and thus that interactions fuel AGN and sustain radio emission) is load-bearing, yet the abstract provides no information on whether the radio-detected subsample was re-matched to the non-radio subsample on the same variables (stellar mass, redshift, local density) used for the primary control sample. Without this, the factor-of-7 difference cannot be distinguished from selection effects arising from the red geyser definition or MaNGA fiber coverage.
Authors: The abstract summarizes results from the full analysis, where the 140 red geyser galaxies form a sample already matched to the control on stellar mass, redshift, and local density. The radio-detected subset (30% of the sample) is drawn directly from this parent sample. We will revise the abstract to explicitly note that the factor-of-7 comparison is internal to the matched red geyser population and will add a short statement confirming that the key property distributions remain comparable between radio-detected and non-radio systems. A more detailed bias check will also be added to the results section of the revised manuscript. revision: yes
-
Referee: [Abstract] Abstract: the reported ~2.7 times larger reservoirs in environmentally affected red geysers is similarly central to the interaction-replenishment interpretation, but the text does not demonstrate that the environmental split survives explicit matching or that the red geyser selection (which already incorporates ionized-gas kinematics and quiescence) does not preferentially select systems with detectable neutral gas in denser environments.
Authors: The environmental classification is performed independently of the Na I D measurements using group catalogs and visual inspection. We will revise the abstract to clarify that the 2.7 factor is measured within the red geyser sample after the primary matching, and we will expand the methods and results sections to show that the reservoir difference remains after explicit matching on stellar mass and redshift. We will also add a brief discussion addressing whether the red geyser selection criteria could introduce environment-dependent detection biases. revision: yes
-
Referee: [Abstract] Abstract: the overall detection fraction (63% vs 40%) and reservoir area ratio (~1.6) are presented as evidence of enhanced cool gas in red geysers, but without tabulated sample sizes, error propagation on the double-Gaussian fit parameters, or a description of how reservoir areas are integrated from the fits, it is not possible to assess whether these ratios are robust to the fitting choices or to the definition of 'detection'.
Authors: We agree that these details are essential for evaluating robustness. The full manuscript describes the double-Gaussian fitting and defines detection as significant Na I D absorption (S/N > 3) in at least one spaxel, with reservoir areas obtained by integrating over qualifying spaxels. We will add a table of sample sizes (N = 140 for both red geysers and control) with binomial uncertainties on the detection fractions, include a description of area integration, and note the propagation of fit-parameter uncertainties. These additions will be made in the methods and results sections of the revised manuscript; a concise reference will also be inserted in the abstract. revision: yes
Circularity Check
No significant circularity: observational comparisons to external matched control
full rationale
The paper reports direct measurements of Na I D absorption kinematics and reservoir sizes in a sample of 140 red geysers drawn from MaNGA, with comparisons to a separately matched control sample and splits by radio detection and environment. No equations, fitted parameters, or self-citations are used to derive the reported velocities, detection fractions, or size ratios; the central claim is an interpretive inference from the observed differences rather than a reduction of any quantity to itself by construction. The analysis relies on external public data and standard fitting procedures without the self-definitional, fitted-input-as-prediction, or uniqueness-imported patterns that would indicate circularity.
Axiom & Free-Parameter Ledger
free parameters (1)
- double-Gaussian fit parameters for Na I D doublet
axioms (2)
- domain assumption Na I D absorption traces cool neutral gas at temperatures 100-1000 K
- domain assumption Blueshifted absorption indicates inflow toward the galaxy center
Reference graph
Works this paper leans on
-
[1]
2022, ApJS, 259, 35, doi: 10.3847/1538-4365/ac4414
Abdurro’uf, Accetta, K., Aerts, C., et al. 2022, ApJS, 259, 35, doi: 10.3847/1538-4365/ac4414
-
[2]
D., Allende Prieto, C., Almeida, A., et al
Albareti, F. D., Prieto, C. A., Almeida, A., et al. 2017, The Astrophysical Journal Supplement Series, 233, 25, doi: 10.3847/1538-4365/aa8992
-
[3]
Baldwin, J. A., Phillips, M. M., & Terlevich, R. 1981, PASP, 93, 5, doi: 10.1086/130766
-
[4]
Barlow, T. A., & Sargent, W. L. W. 1997, AJ, 113, 136, doi: 10.1086/118239
-
[5]
and Schaefer, Adam and Cappellari, Michele and Ji, Xihan and Bershady, Matthew A
Belfiore, F., Westfall, K. B., Schaefer, A., et al. 2019, AJ, 158, 160, doi: 10.3847/1538-3881/ab3e4e
-
[6]
2025, arXiv e-prints, arXiv:2510.11455, doi: 10.48550/arXiv.2510.11455
Bevacqua, D., Marchesini, D., Saracco, P., et al. 2025, arXiv e-prints, arXiv:2510.11455, doi: 10.48550/arXiv.2510.11455
-
[7]
Blanton, M. R., Bershady, M. A., Abolfathi, B., et al. 2017, AJ, 154, 28, doi: 10.3847/1538-3881/aa7567
-
[8]
Overview of the SDSS-IV MaNGA Survey: Mapping Nearby Galaxies at Apache Point Observatory
Bundy, K., Bershady, M. A., Law, D. R., et al. 2015, ApJ, 798, 7, doi: 10.1088/0004-637X/798/1/7
-
[9]
Cappellari, M. 2023, MNRAS, 526, 3273, doi: 10.1093/mnras/stad2597
-
[10]
Cappellari, M., & Copin, Y. 2003, MNRAS, 342, 345, doi: 10.1046/j.1365-8711.2003.06541.x
-
[11]
2016, Nature, 533, 504, doi: 10.1038/nature18006
Cheung, E., Bundy, K., Cappellari, M., et al. 2016, Nature, 533, 504, doi: 10.1038/nature18006
-
[12]
Crawford, I. A. 1992, MNRAS, 259, 47, doi: 10.1093/mnras/259.1.47
-
[13]
L., Belli, S., Park, M., et al
Davies, R. L., Belli, S., Park, M., et al. 2024, MNRAS, 528, 4976, doi: 10.1093/mnras/stae327
-
[14]
Dey, A., Schlegel, D. J., Lang, D., et al. 2019, AJ, 157, 168, doi: 10.3847/1538-3881/ab089d
-
[15]
Drory, N., MacDonald, N., Bershady, M. A., et al. 2015, AJ, 149, 77, doi: 10.1088/0004-6256/149/2/77
-
[16]
Fabian, A. C. 2012, ARA&A, 50, 455, doi: 10.1146/annurev-astro-081811-125521
work page internal anchor Pith review doi:10.1146/annurev-astro-081811-125521 2012
-
[17]
Forman, W., Jones, C., & Tucker, W. 1985, ApJ, 293, 102, doi: 10.1086/163218
-
[18]
Fumagalli, M., Prochaska, J. X., Kasen, D., et al. 2011, MNRAS, 418, 1796, doi: 10.1111/j.1365-2966.2011.19599.x 23
-
[19]
Gunn, J. E., Siegmund, W. A., Mannery, E. J., et al. 2006, The Astronomical Journal, 131, 2332, doi: 10.1086/500975
-
[20]
Burbidge, E. M. 1997, in Astronomical Society of the Pacific Conference Series, Vol. 128, Mass Ejection from Active Galactic Nuclei, ed. N. Arav, I. Shlosman, & R. J. Weymann, 19, doi: 10.48550/arXiv.astro-ph/9704234
work page internal anchor Pith review doi:10.48550/arxiv.astro-ph/9704234 1997
-
[21]
2000, ApJS, 129, 493, doi: 10.1086/313421
Armus, L. 2000, ApJS, 129, 493, doi: 10.1086/313421
-
[22]
Herbig, G. H. 1995, ARA&A, 33, 19, doi: 10.1146/annurev.aa.33.090195.000315
-
[23]
Jacoby, G. H., Hunter, D. A., & Christian, C. A. 1984, ApJS, 56, 257, doi: 10.1086/190983
-
[24]
Krug, H. B., Rupke, D. S. N., & Veilleux, S. 2010, ApJ, 708, 1145, doi: 10.1088/0004-637X/708/2/1145
-
[25]
Law, D. R., Yan, R., Bershady, M. A., et al. 2015, AJ, 150, 19, doi: 10.1088/0004-6256/150/1/19
-
[26]
2020, MNRAS, 496, 2962, doi: 10.1093/mnras/staa1489
Maraston, C., Hill, L., Thomas, D., et al. 2020, MNRAS, 496, 2962, doi: 10.1093/mnras/staa1489
-
[27]
Martin, C. L. 2005, ApJ, 621, 227, doi: 10.1086/427277
-
[28]
Morton, D. C. 1991, ApJS, 77, 119, doi: 10.1086/191601
-
[29]
2012, A&A, 545, A21, doi: 10.1051/0004-6361/201219284
Puspitarini, L., & Lallement, R. 2012, A&A, 545, A21, doi: 10.1051/0004-6361/201219284
-
[30]
2018, ApJ, 869, 117, doi: 10.3847/1538-4357/aaee72
Roy, N., Bundy, K., Cheung, E., et al. 2018, The Astrophysical Journal, 869, 117, doi: 10.3847/1538-4357/aaee72
-
[31]
2021a, ApJ, 913, 33, doi: 10.3847/1538-4357/abf1e6
Roy, N., Bundy, K., Nevin, R., et al. 2021a, ApJ, 913, 33, doi: 10.3847/1538-4357/abf1e6
-
[32]
Roy, N., Bundy, K., Rubin, K. H. R., et al. 2021b, ApJ, 919, 145, doi: 10.3847/1538-4357/ac0f74
-
[33]
2021c, ApJ, 922, 230, doi: 10.3847/1538-4357/ac24a0
Roy, N., Moravec, E., Bundy, K., et al. 2021c, ApJ, 922, 230, doi: 10.3847/1538-4357/ac24a0
-
[34]
Rubin, K. H. R., Prochaska, J. X., Koo, D. C., & Phillips, A. C. 2012, ApJL, 747, L26, doi: 10.1088/2041-8205/747/2/L26
-
[35]
Rubin, K. H. R., Weiner, B. J., Koo, D. C., et al. 2010, ApJ, 719, 1503, doi: 10.1088/0004-637X/719/2/1503
-
[36]
Rubin, K. H. R., Juarez, C., Cooksey, K. L., et al. 2022, ApJ, 936, 171, doi: 10.3847/1538-4357/ac7b88
-
[37]
S., Veilleux, S., & Sanders, D
Rupke, D. S., Veilleux, S., & Sanders, D. B. 2005, ApJS, 160, 115, doi: 10.1086/432889
-
[38]
F., Jimenez-Vicente, J., et al
Sanchez-Blazquez, P., Peletier, R. F., Jimenez-Vicente, J., et al. 2007, VizieR Online Data Catalog: MILES library of empirical spectra (Sanchez-blazquez+, 2006),, VizieR On-line Data Catalog: J/MNRAS/371/703. Originally published in: 2006MNRAS.371..703S
2007
-
[39]
Savage, B. D., Bohlin, R. C., Drake, J. F., & Budich, W. 1977, ApJ, 216, 291, doi: 10.1086/155471
-
[40]
Shull, J. M., & van Steenberg, M. E. 1985, ApJ, 298, 268, doi: 10.1086/163605
-
[41]
Smee, S. A., Gunn, J. E., Uomoto, A., et al. 2013, The Astronomical Journal, 146, 32, doi: 10.1088/0004-6256/146/2/32
-
[42]
Steidel, C. C., Erb, D. K., Shapley, A. E., et al. 2010, ApJ, 717, 289, doi: 10.1088/0004-637X/717/1/289
-
[43]
Tyson, N. D., & Rich, R. M. 1991, ApJ, 367, 547, doi: 10.1086/169651
-
[44]
Weiner, B. J., Coil, A. L., Prochaska, J. X., et al. 2009, ApJ, 692, 187, doi: 10.1088/0004-637X/692/1/187
-
[45]
2019, SSRv, 215, 5, doi: 10.1007/s11214-018-0571-9
Scannapieco, E. 2019, SSRv, 215, 5, doi: 10.1007/s11214-018-0571-9
-
[46]
and Cappellari, Michele and Bershady, Matthew A
Westfall, K. B., Cappellari, M., Bershady, M. A., et al. 2019, AJ, 158, 231, doi: 10.3847/1538-3881/ab44a2
-
[47]
Yan, R., Bundy, K., Law, D. R., et al. 2016, The Astronomical Journal, 152, 197, doi: 10.3847/0004-6256/152/6/197
-
[48]
2019, ApJ, 883, 175, doi: 10.3847/1538-4357/ab3ebc
Yan, R., Chen, Y., Lazarz, D., et al. 2019, ApJ, 883, 175, doi: 10.3847/1538-4357/ab3ebc
discussion (0)
Sign in with ORCID, Apple, or X to comment. Anyone can read and Pith papers without signing in.