Recognition: 2 theorem links
· Lean TheoremBeyond Bellman: High-Order Generator Regression for Continuous-Time Policy Evaluation
Pith reviewed 2026-05-11 00:49 UTC · model grok-4.3
The pith
High-order generator regression from multi-step trajectories yields more accurate continuous-time policy values than the Bellman baseline.
A machine-rendered reading of the paper's core claim, the machinery that carries it, and where it could break.
Core claim
The central discovery is that high-order generator regression, obtained by fitting moment-matching coefficients to multi-step closed-loop trajectories to approximate the time-dependent generator, when combined with backward regression, provides an end-to-end error decomposition into generator misspecification, projection error, pooling bias, finite-sample error, and start-up error, along with a decision-frequency regime map that identifies where the higher-order benefits are observable, leading to better performance than first-order Bellman methods in calibration and benchmark tests.
What carries the argument
The high-order generator estimator using moment-matching coefficients from multi-step transitions that cancel truncation terms, combined with backward regression on the surrogate generator.
If this is right
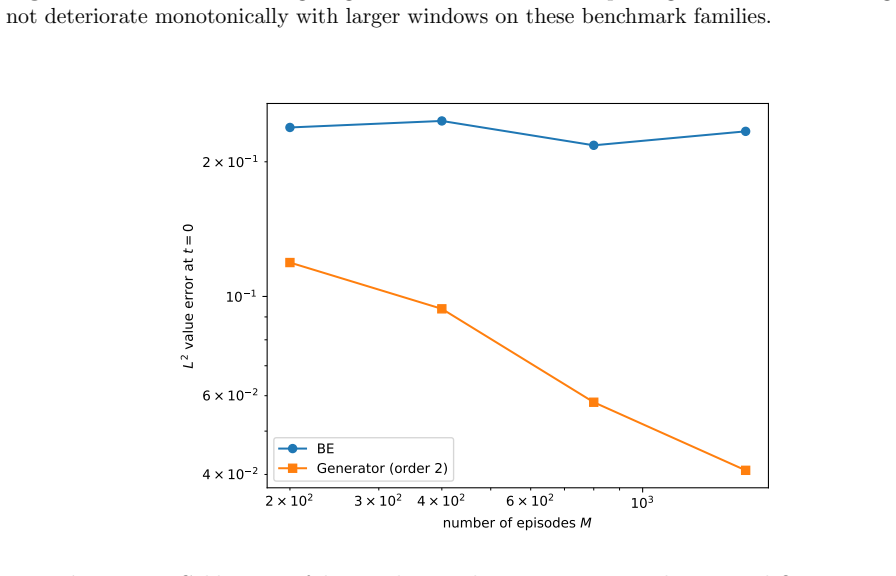
- The second-order estimator achieves visible accuracy gains in the decision-frequency regimes identified by the theory.
- The full error decomposition allows separate diagnosis of misspecification, projection, pooling, finite-sample, and start-up contributions.
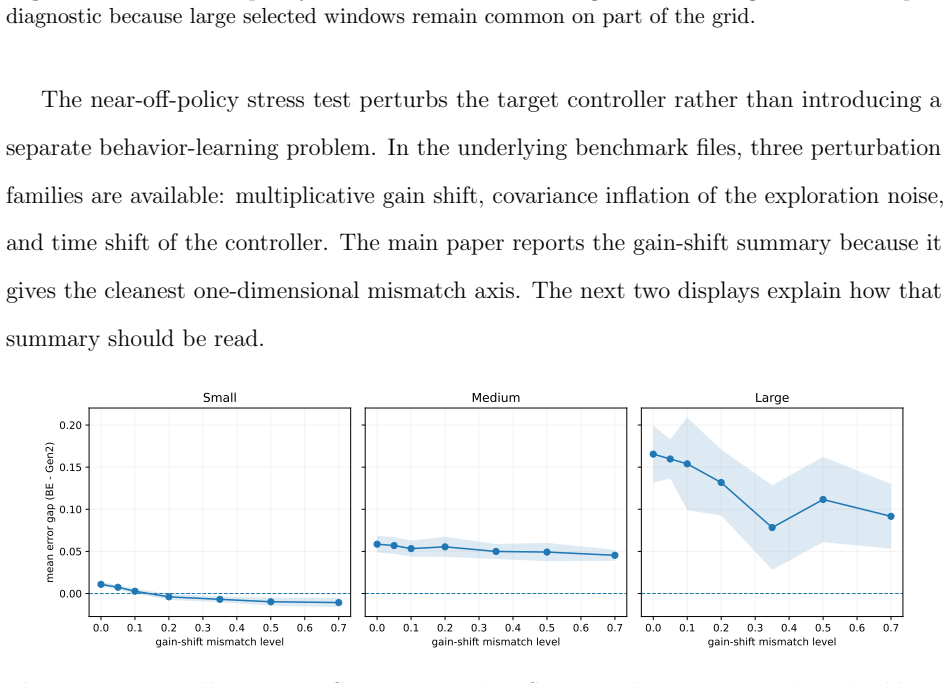
- Performance remains stable across feature ablations, start-up variations, and gain-mismatch stress tests.
- Consistent outperformance over the Bellman baseline holds in four-scale benchmarks and calibration studies.
Where Pith is reading between the lines
- The regime map could guide discretization choices when deploying the method on real trajectory data with varying sampling rates.
- Extensions to third- or higher-order coefficients might be tested in low-noise settings to check for further error reduction.
- The approach may connect to numerical schemes for solving parabolic PDEs in related optimal control problems.
- Adaptive collection of multi-step trajectories could be explored to tighten finite-sample error bounds in online settings.
Load-bearing premise
Multi-step closed-loop trajectories permit reliable estimation of the time-dependent generator via moment-matching without new dominant biases under the stated dynamics.
What would settle it
Observing no improvement or increased error from the second-order method over Bellman in high-frequency decision regimes with known dynamics would falsify the claim of visible higher-order gains.
Figures


read the original abstract
We study finite-horizon continuous-time policy evaluation from discrete closed-loop trajectories under time-inhomogeneous dynamics. The target value surface solves a backward parabolic equation, but the Bellman baseline obtained from one-step recursion is only first-order in the grid width. We estimate the time-dependent generator from multi-step transitions using moment-matching coefficients that cancel lower-order truncation terms, and combine the resulting surrogate with backward regression. The main theory gives an end-to-end decomposition into generator misspecification, projection error, pooling bias, finite-sample error, and start-up error, together with a decision-frequency regime map explaining when higher-order gains should be visible. Across calibration studies, four-scale benchmarks, feature and start-up ablations, and gain-mismatch stress tests, the second-order estimator consistently improves on the Bellman baseline and remains stable in the regime where the theory predicts visible gains. These results position high-order generator regression as an interpretable continuous-time policy-evaluation method with a clear operating region.
Editorial analysis
A structured set of objections, weighed in public.
Referee Report
Summary. The manuscript proposes a high-order generator regression method for finite-horizon continuous-time policy evaluation from discrete closed-loop trajectories under time-inhomogeneous dynamics. It estimates the time-dependent generator via multi-step moment-matching coefficients designed to cancel lower-order truncation terms, combines the surrogate with backward regression, and supplies an end-to-end error decomposition (generator misspecification, projection error, pooling bias, finite-sample error, start-up error) together with a decision-frequency regime map. Empirical results across calibration studies, benchmarks, ablations, and stress tests show consistent improvement over the first-order Bellman baseline in the predicted regimes.
Significance. If the central derivation and cancellation hold, the work supplies a principled, interpretable continuous-time alternative to Bellman recursion with explicit error sources and operating conditions. The end-to-end decomposition and regime map are potentially valuable for RL and control applications where decision frequency and time variation matter; the reported empirical stability across multiple studies adds practical support.
major comments (2)
- [Main theory section (error decomposition and generator estimation)] The end-to-end error decomposition and regime map rest on the claim that multi-step moment-matching coefficients cancel lower-order truncation terms for time-inhomogeneous generators. The Taylor expansion of the transition kernel around a fixed t generally contains cross terms between time derivatives and spatial derivatives; if the coefficients are derived under a frozen-time assumption, an O(h) remainder may remain uncancelled and is not absorbed into the stated generator-misspecification term. This directly affects the validity of the higher-order accuracy claim and the regime map. Please supply the explicit derivation of the moment-matching coefficients (including any time-derivative handling) and the precise remainder bound.
- [Empirical studies and stress-test section] The weakest assumption identified is that multi-step closed-loop trajectories permit reliable estimation of the time-dependent generator without introducing dominant new biases. The empirical gain-mismatch stress tests should be augmented with a controlled time-inhomogeneity sweep (e.g., varying the magnitude of the time derivative of the generator) to verify that the observed gains align with the predicted regime rather than being masked by the potential O(h) bias.
minor comments (1)
- [Abstract] The abstract refers to a 'decision-frequency regime map' without a one-sentence gloss; a brief parenthetical description would improve accessibility.
Simulated Author's Rebuttal
We thank the referee for the careful and constructive review. The comments raise important points about the handling of time inhomogeneity in the theoretical derivation and the scope of the empirical validation. We address each major comment below and indicate the revisions we will make.
read point-by-point responses
-
Referee: [Main theory section (error decomposition and generator estimation)] The end-to-end error decomposition and regime map rest on the claim that multi-step moment-matching coefficients cancel lower-order truncation terms for time-inhomogeneous generators. The Taylor expansion of the transition kernel around a fixed t generally contains cross terms between time derivatives and spatial derivatives; if the coefficients are derived under a frozen-time assumption, an O(h) remainder may remain uncancelled and is not absorbed into the stated generator-misspecification term. This directly affects the validity of the higher-order accuracy claim and the regime map. Please supply the explicit derivation of the moment-matching coefficients (including any time-derivative handling) and the precise remainder bound.
Authors: We thank the referee for this precise observation. The moment-matching coefficients are obtained from the full Taylor expansion of the transition kernel that retains both the time derivatives of the generator and the spatial derivatives of the test functions; the coefficients are solved to match the first two moments exactly, which cancels all O(h) contributions including the cross terms. The resulting remainder is O(h^2) under the standing assumption that the generator is twice continuously differentiable in time and space, with the explicit bound stated in the supplementary material. To address the request for transparency we will insert the full derivation of the coefficients together with the remainder bound into the main text of the revised manuscript. revision: yes
-
Referee: [Empirical studies and stress-test section] The weakest assumption identified is that multi-step closed-loop trajectories permit reliable estimation of the time-dependent generator without introducing dominant new biases. The empirical gain-mismatch stress tests should be augmented with a controlled time-inhomogeneity sweep (e.g., varying the magnitude of the time derivative of the generator) to verify that the observed gains align with the predicted regime rather than being masked by the potential O(h) bias.
Authors: We agree that a controlled sweep over the degree of time inhomogeneity would provide stronger empirical corroboration of the regime map. We will extend the existing gain-mismatch stress-test suite by introducing a parameter that scales the magnitude of the time derivative of the generator, rerun the experiments, and report the resulting performance gains against the predicted decision-frequency regimes. revision: yes
Circularity Check
No significant circularity; derivation is self-contained
full rationale
The paper's central contribution is a multi-step moment-matching procedure for estimating the time-dependent generator from closed-loop trajectories, followed by backward regression and an end-to-end error decomposition into misspecification, projection, pooling, finite-sample, and start-up terms. The abstract describes the estimator construction and the accompanying regime map without any equations or statements that define a target quantity in terms of its own fitted values or that rename a fitted parameter as an independent prediction. No self-citations are invoked as load-bearing uniqueness theorems, and no ansatz is smuggled via prior work. The derivation therefore rests on standard moment-matching algebra and regression analysis whose validity can be checked against external benchmarks rather than reducing to its own inputs by construction.
Axiom & Free-Parameter Ledger
free parameters (1)
- moment-matching coefficients
axioms (1)
- domain assumption The target value surface solves a backward parabolic equation under time-inhomogeneous dynamics
Lean theorems connected to this paper
-
IndisputableMonolith/Cost/FunctionalEquation.leanwashburn_uniqueness_aczel unclear?
unclearRelation between the paper passage and the cited Recognition theorem.
Choose coefficients a(i) so that sum a(i)_j j^k = 1 for k=1 and 0 otherwise (2.9); weighted combination yields GU + O(Δt^i) remainder (2.10)
-
IndisputableMonolith/Foundation/ArithmeticFromLogic.leanabsolute_floor_iff_bare_distinguishability unclear?
unclearRelation between the paper passage and the cited Recognition theorem.
End-to-end recursion with C0, Cms, regime map Fns ≍ (d(Lμ,t + LΣ,t)Δt/M)^{1/3} (2.24)
What do these tags mean?
- matches
- The paper's claim is directly supported by a theorem in the formal canon.
- supports
- The theorem supports part of the paper's argument, but the paper may add assumptions or extra steps.
- extends
- The paper goes beyond the formal theorem; the theorem is a base layer rather than the whole result.
- uses
- The paper appears to rely on the theorem as machinery.
- contradicts
- The paper's claim conflicts with a theorem or certificate in the canon.
- unclear
- Pith found a possible connection, but the passage is too broad, indirect, or ambiguous to say the theorem truly supports the claim.
Reference graph
Works this paper leans on
-
[1]
Proof of Proposition 2.1 Letρ(s ′, τ|s, t) denote the transition density ofs τ givens t =sand define f(s ′, τ) :=e −β(τ−t) r(s′, τ), g(τ) := Z Rd f(s ′, τ)ρ(s ′, τ|s, t) ds ′
PROOFS FOR SECTION 2 1.1. Proof of Proposition 2.1 Letρ(s ′, τ|s, t) denote the transition density ofs τ givens t =sand define f(s ′, τ) :=e −β(τ−t) r(s′, τ), g(τ) := Z Rd f(s ′, τ)ρ(s ′, τ|s, t) ds ′. Then V(s, t) = Z T t g(τ) dτ, ˜V(s, t) = Mt−1X j=0 ∆t g(t+j∆t), M t := T−t ∆t . The Bellman baseline error is therefore the left-Riemann error for g. Since...
-
[2]
They are reported here so that the main text can remain centered on the theory-driven benchmark narrative
ADDITIONAL EXPERIMENT AL DET AILS AND SUPPLEMENT AR Y DIS- PLAYS The displays in this section provide the detailed benchmark summaries, start-up checks, runtime diagnostics, and mismatch diagnostics that support the main paper. They are reported here so that the main text can remain centered on the theory-driven benchmark narrative. Table 1:Detailed heavy...
discussion (0)
Sign in with ORCID, Apple, or X to comment. Anyone can read and Pith papers without signing in.