Recognition: unknown
Medium Characterization with Hard Probes: From Cherenkov Light in QED to Jet Drift in QCD
Pith reviewed 2026-05-08 17:30 UTC · model grok-4.3
The pith
A dispersive fit to liquid argon's refractive index shows Cherenkov angular distributions carry excess signal over scintillation, while jet drift produces distinct v2 and acoplanarity patterns that separate it from energy loss in the quark–
A machine-rendered reading of the paper's core claim, the machinery that carries it, and where it could break.
Core claim
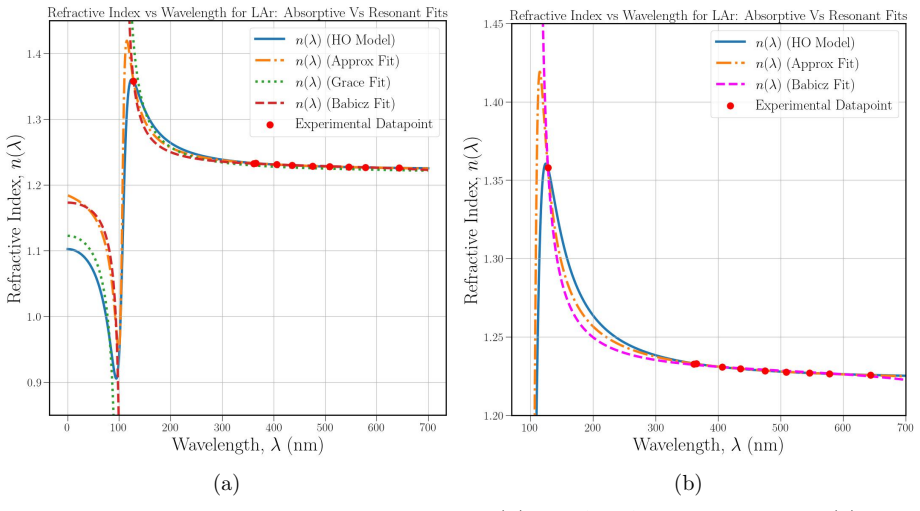
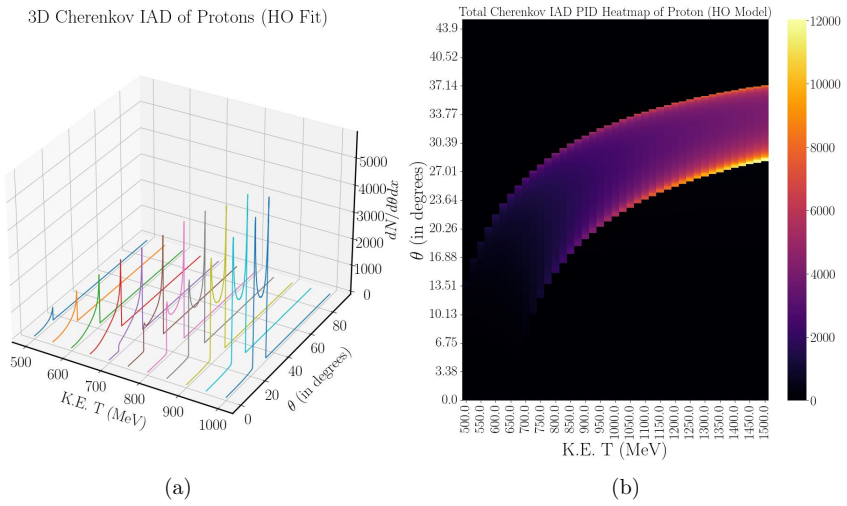
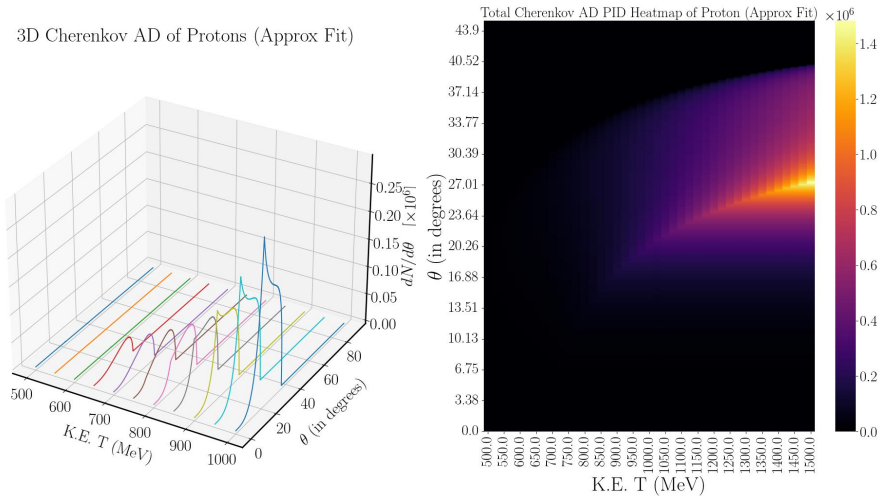
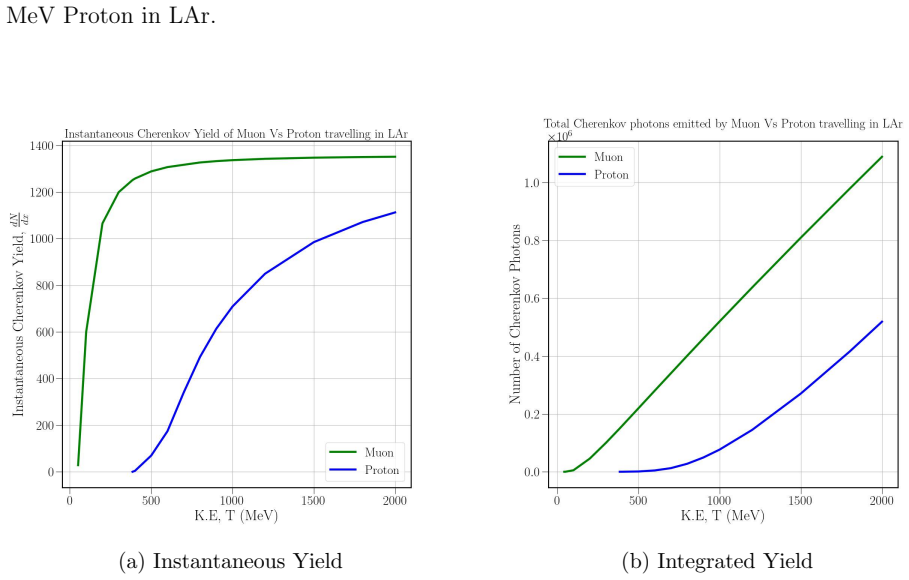
This dissertation presents a unified framework for medium characterization with hard probes spanning from Cherenkov light in QED to jet drift in QCD. A dispersive fit to the refractive index n(λ) of liquid argon is developed by incorporating anomalous dispersion at the 106.6 nm resonance for the first time. The angular distribution of Cherenkov radiation is shown to be highly sensitive to the peak of the refractive index and to contribute a significant excess over isotropic scintillation in certain angular bins. For high-energy nuclear collisions jet drift—the flow-induced deflection of partons—is employed as a tomographic probe of the quark–gluon plasma; simulations across PbPb, AuAu and UU
What carries the argument
The dispersive fit to the refractive index of liquid argon that incorporates anomalous dispersion, together with the flow-induced deflection of partons (jet drift) modeled in the anisotropic parton evolution Monte Carlo.
If this is right
- The predicted excess in specific angular bins can be used to improve particle-identification precision in liquid-argon detectors.
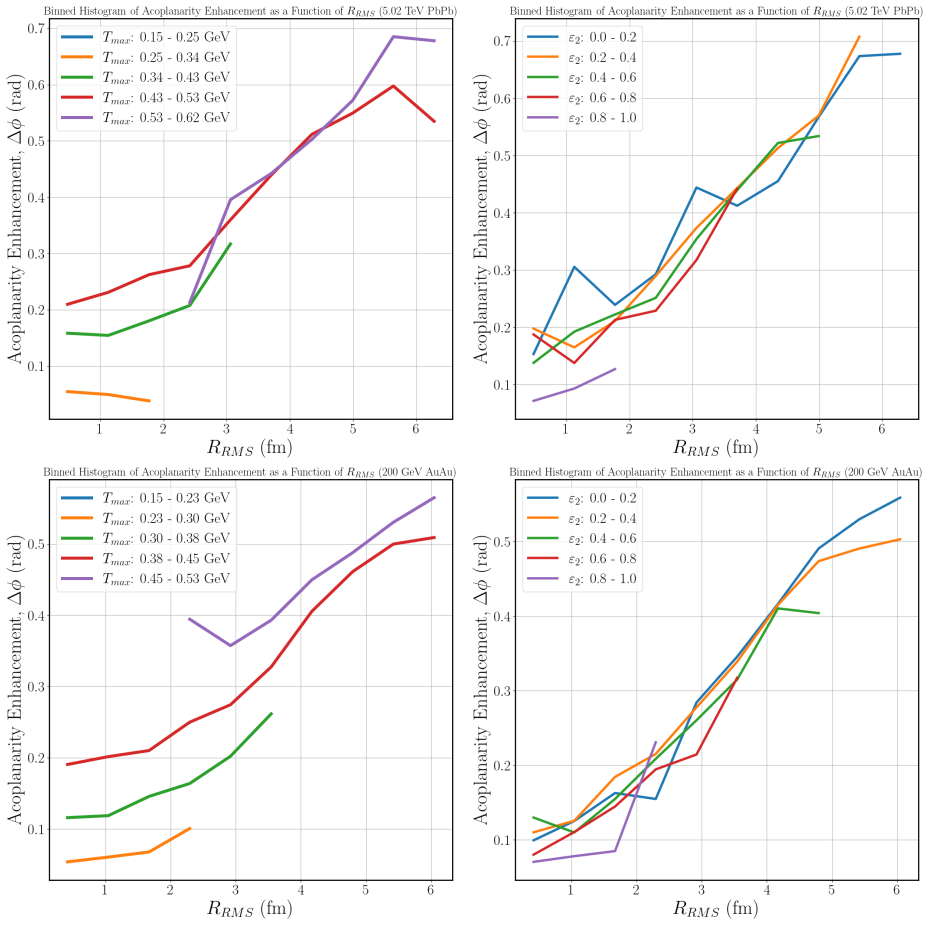
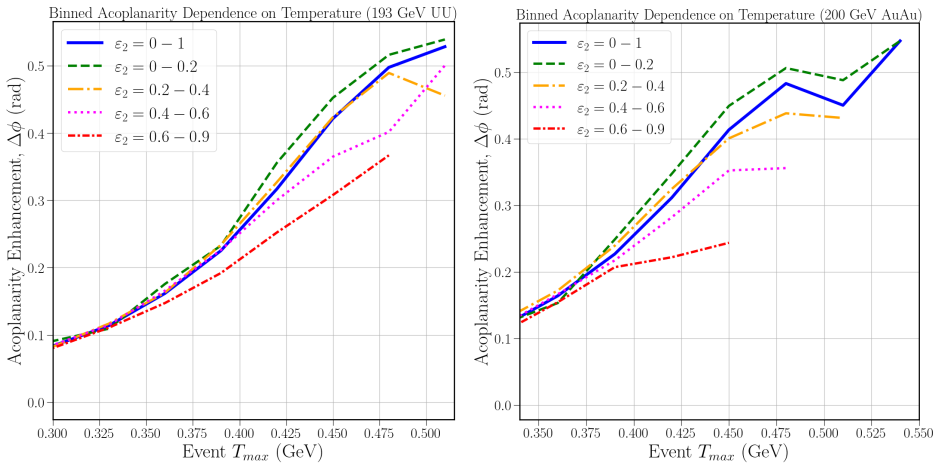
- Jet drift depends on medium size, temperature and geometry, producing observable differences in elliptic flow and acoplanarity across collision systems.
- These distinct patterns in v2 and Δφ allow jet drift to be separated from conventional parton energy loss.
- The angular and kinematic signatures together increase the ability to resolve fundamental properties of the probed media.
Where Pith is reading between the lines
- Confirmation of the Cherenkov excess would permit tighter subtraction of scintillation backgrounds in neutrino detectors.
- The jet-drift observables could be tracked as a function of collision centrality to map how medium flow evolves during the plasma lifetime.
- Treating the two probes within one framework hints at possible future cross-checks between electromagnetic and strong-interaction tomography, although the work presents them as separate studies.
Load-bearing premise
The dispersive fit accurately represents the refractive index peak at relevant wavelengths and the Monte Carlo simulation correctly captures flow-induced deflection without large confounding contributions from other jet-modification mechanisms.
What would settle it
Measurement of the Cherenkov angular distribution in liquid argon that shows no excess over isotropic scintillation in the angular bins predicted by the fit, or heavy-ion data in which v2 and dihadron acoplanarity lack the distinct system-size and geometry dependence expected from jet drift.
Figures


read the original abstract
This dissertation presents a unified framework for medium characterization with hard probes spanning from Cherenkov light in quantum electrodynamics (QED) to jet drift in quantum chromodynamics (QCD). We first develop a dispersive fit to the refractive index $n(\lambda)$ of liquid argon (LAr) by incorporating anomalous dispersion at the 106.6 nm resonance for the first time. We show that the angular distribution of Cherenkov radiation is highly sensitive to the peak of the refractive index and contributes a significant excess over isotropic scintillation in certain angular bins. This work is important for precision Particle Identification (PID) for experiments like DUNE and CCM. Transitioning to high-energy nuclear collisions, we utilize ``jet drift'' -- the flow-induced deflection of partons -- as a tomographic probe of the Quark-Gluon Plasma (QGP). Using the Anisotropic Parton Evolution (APE) Monte Carlo simulation across various collision systems (PbPb, AuAu, and UU), we disentangle how the jet modification depends on medium size, temperature, and geometry. We show that jet drift exhibits distinct systematics in observables like the elliptic flow ($v_2$) and dihadron acoplanarity ($\Delta\phi$), which helps disentangle it from conventional energy loss. Together, these studies demonstrate how the angular and kinematic signatures of hard probes revolutionize our ability to resolve the fundamental properties of matter.
Editorial analysis
A structured set of objections, weighed in public.
Referee Report
Summary. The manuscript presents a unified framework for medium characterization using hard probes, from QED to QCD. It develops a dispersive fit to the refractive index n(λ) of liquid argon incorporating anomalous dispersion at the 106.6 nm resonance for the first time. It claims that the angular distribution of Cherenkov radiation is highly sensitive to the peak of the refractive index and produces a significant excess over isotropic scintillation in certain angular bins, relevant for PID in DUNE and CCM. For QCD, it employs the Anisotropic Parton Evolution Monte Carlo across PbPb, AuAu, and UU collisions to study jet drift as a tomographic probe of the QGP, claiming that jet drift exhibits distinct systematics in v2 and dihadron acoplanarity Δφ that help disentangle it from conventional energy loss, depending on medium size, temperature, and geometry.
Significance. If the central claims hold, the QED results could enhance precision modeling of Cherenkov light for particle identification in neutrino and dark matter experiments. The QCD component would provide a new flow-sensitive observable for QGP tomography, with the multi-system comparison offering a way to separate geometric and dynamical effects. The conceptual unification of angular signatures in QED and QCD probes is a strength, and the use of APE MC across collision systems is a positive step toward falsifiable predictions.
major comments (2)
- [Abstract and QCD jet-drift analysis] Abstract and QCD jet-drift section: The central claim that jet drift produces distinct systematics in v2 and Δφ (distinct from conventional energy loss) is load-bearing for the tomographic interpretation. This requires the APE MC to generate parton trajectories whose angular deflection is driven dominantly by the medium flow velocity field, with other mechanisms (radiative loss, collisional broadening) either absent or orthogonal in the chosen observables. No explicit orthogonality test or residual-contamination analysis is described, which directly affects whether the reported systematics are robust predictions or simulation artifacts.
- [QED Cherenkov radiation analysis] QED Cherenkov section: The dispersive fit to n(λ) and the resulting sensitivity of the angular distribution to the refractive-index peak are load-bearing for the claimed excess over isotropic scintillation. The manuscript must supply the explicit functional form of the fit, the fitted parameters (including the anomalous-dispersion term), and quantitative comparison plots or tables showing the excess in specific angular bins; without these, the 'highly sensitive' and 'significant excess' statements cannot be assessed.
minor comments (1)
- [Abstract] The abstract relies on qualitative statements ('we show', 'distinct systematics') without quoting any numerical values, fit parameters, or observable differences; adding one or two concrete numbers would improve clarity.
Simulated Author's Rebuttal
We thank the referee for the careful and constructive review of our manuscript. We address each major comment point by point below and indicate the revisions we will implement to improve clarity and robustness.
read point-by-point responses
-
Referee: [Abstract and QCD jet-drift analysis] Abstract and QCD jet-drift section: The central claim that jet drift produces distinct systematics in v2 and Δφ (distinct from conventional energy loss) is load-bearing for the tomographic interpretation. This requires the APE MC to generate parton trajectories whose angular deflection is driven dominantly by the medium flow velocity field, with other mechanisms (radiative loss, collisional broadening) either absent or orthogonal in the chosen observables. No explicit orthogonality test or residual-contamination analysis is described, which directly affects whether the reported systematics are robust predictions or simulation artifacts.
Authors: We agree that an explicit orthogonality test strengthens the tomographic interpretation. The current analysis infers distinct systematics from the multi-system comparison (PbPb, AuAu, UU), where variations in geometry, size, and temperature produce unique patterns in v2 and Δφ that differ from pure energy-loss expectations. To make this more rigorous, we will add in the revised manuscript a dedicated subsection or appendix presenting APE runs with the flow velocity field disabled, quantifying the residual contributions from radiative loss and collisional broadening to the reported observables. revision: yes
-
Referee: [QED Cherenkov radiation analysis] QED Cherenkov section: The dispersive fit to n(λ) and the resulting sensitivity of the angular distribution to the refractive-index peak are load-bearing for the claimed excess over isotropic scintillation. The manuscript must supply the explicit functional form of the fit, the fitted parameters (including the anomalous-dispersion term), and quantitative comparison plots or tables showing the excess in specific angular bins; without these, the 'highly sensitive' and 'significant excess' statements cannot be assessed.
Authors: We agree that the explicit functional form, parameters, and quantitative comparisons are required for full assessment and reproducibility. The dispersive fit is a modified Sellmeier form that includes an anomalous-dispersion term centered at the 106.6 nm resonance. In the revised manuscript we will insert the complete functional expression, the numerical values of all fitted parameters, and new figures (or tables) that directly compare the Cherenkov angular distributions with and without the anomalous-dispersion peak, reporting the excess over isotropic scintillation in the relevant angular bins. revision: yes
Circularity Check
No significant circularity detected
full rationale
The paper presents a dispersive fit to the LAr refractive index incorporating anomalous dispersion, followed by a demonstration that Cherenkov angular distributions are sensitive to the index peak, and separately employs the APE Monte Carlo to study jet-drift effects on v2 and Δφ across collision systems. No quoted equations or sections reduce a claimed prediction or uniqueness result to a fitted input, self-citation, or definitional tautology by construction. The Monte Carlo is used as an independent simulation tool to explore dependencies on medium parameters; the reported distinct systematics are outputs of that model rather than reparameterizations of its inputs. The derivation chain remains self-contained against external benchmarks.
Axiom & Free-Parameter Ledger
free parameters (1)
- parameters in dispersive fit to n(lambda)
axioms (1)
- domain assumption Validity of the Anisotropic Parton Evolution Monte Carlo for modeling parton evolution in QGP
discussion (0)
Sign in with ORCID, Apple, or X to comment. Anyone can read and Pith papers without signing in.