Recognition: 2 theorem links
· Lean TheoremConfoundingSHAP: Quantifying confounding strength in causal inference
Pith reviewed 2026-05-12 03:19 UTC · model grok-4.3
The pith
ConfoundingSHAP attributes confounding strength to individual covariates through a targeted Shapley game over adjustment sets.
A machine-rendered reading of the paper's core claim, the machinery that carries it, and where it could break.
Core claim
ConfoundingSHAP is a Shapley-based method for attributing confounding strength to individual covariates. We propose a Shapley game targeted to infer the confounding strength of the covariates. Our resulting Shapley values differ from the standard applications of SHAP explanations on causal targets, such as understanding treatment effect heterogeneity, which are ill-suited for our task. Second, as our task requires evaluating the value function over many adjustment sets, we provide a scalable TabPFN-based estimation that avoids exhaustive refitting. We demonstrate the practical value across various datasets, where ConfoundingSHAP provides informative explanations of which observed covariates
What carries the argument
The custom Shapley value game whose value function is defined on adjustment sets to isolate the confounding bias removed by each covariate.
If this is right
- Analysts gain an explicit ranking of which covariates most influence the treatment-outcome dependence.
- Adjustment decisions can be prioritized by the magnitude of attributed confounding strength.
- The method supplies an explanation of the observed treatment assignment mechanism without assuming it is known.
- Scalable evaluation makes the attributions feasible even when the number of covariates is moderately large.
Where Pith is reading between the lines
- The same game structure could be adapted to quantify the strength of other bias sources such as selection bias.
- Rankings from ConfoundingSHAP might serve as input features for automated confounder-selection procedures in high-dimensional settings.
- In longitudinal data the method could be extended to time-varying confounders by defining value functions over time-indexed adjustment sets.
Load-bearing premise
The value function over adjustment sets isolates confounding strength rather than other forms of statistical dependence or model misspecification.
What would settle it
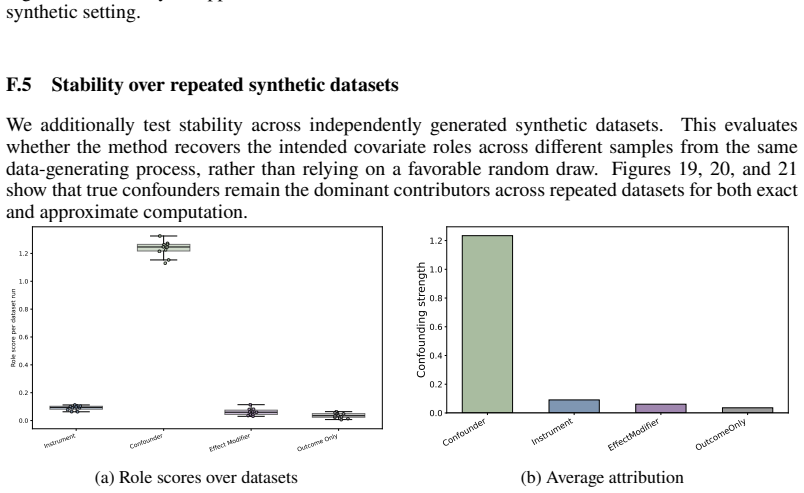
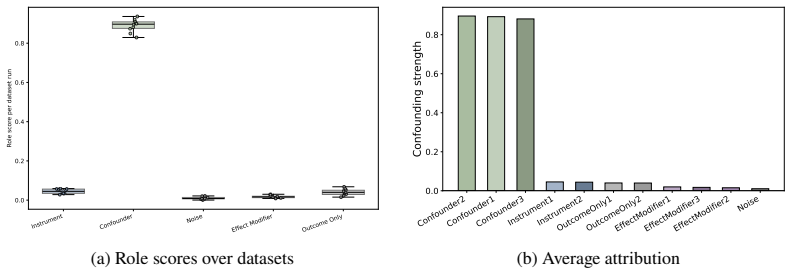
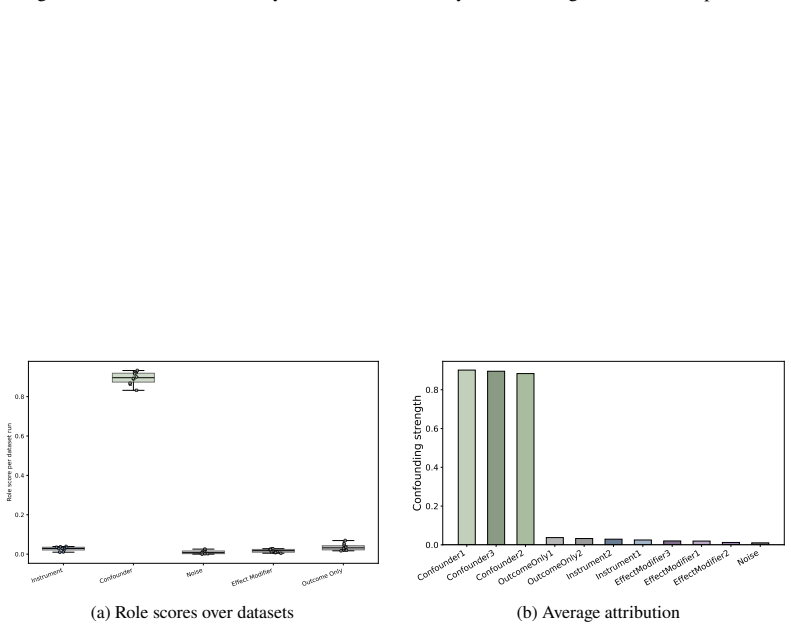
A controlled simulation with known true confounders and non-confounders in which the method assigns low strength to the true confounders or high strength to non-confounders would falsify the approach.
Figures


read the original abstract
In causal inference, confounders are variables that influence both treatment decisions and outcomes. However, unlike as in randomized clinical trials, the treatment assignment mechanism in observational studies is not known, and it is thus unclear which covariates act as confounders. Here, we aim to generate insight for causal inference and answer: which of the observed covariates act as confounders? We introduce ConfoundingSHAP, a Shapley-based method for attributing confounding strength to individual covariates. Our contributions are twofold. First, we propose a Shapley game targeted to infer the confounding strength of the covariates. Our resulting Shapley values differ from the standard applications of SHAP explanations on causal targets, such as understanding treatment effect heterogeneity, which are ill-suited for our task. Second, as our task requires evaluating the value function over many adjustment sets, we provide a scalable TabPFN-based estimation that avoids exhaustive refitting. We demonstrate the practical value across various datasets, where ConfoundingSHAP provides informative explanations of which observed covariates drive confounding and thereby helps to provide more insight for causal inference in practice.
Editorial analysis
A structured set of objections, weighed in public.
Referee Report
Summary. The manuscript introduces ConfoundingSHAP, a Shapley-value method that attributes confounding strength to individual covariates in observational causal inference. It defines a game whose value function is evaluated over adjustment sets (distinct from standard SHAP applications to treatment-effect heterogeneity), and substitutes TabPFN for exhaustive refitting to achieve scalability. The authors claim that the resulting attributions identify which observed covariates drive confounding and thereby supply practical insight for causal analysis, with demonstrations on various datasets.
Significance. If the value function successfully isolates confounding strength rather than general dependence, the approach would supply a useful diagnostic for high-dimensional observational studies, helping analysts decide which covariates to adjust for and interpret the sources of bias. The TabPFN-based estimator is a pragmatic engineering contribution that removes the computational barrier to evaluating the exponential number of adjustment sets.
major comments (3)
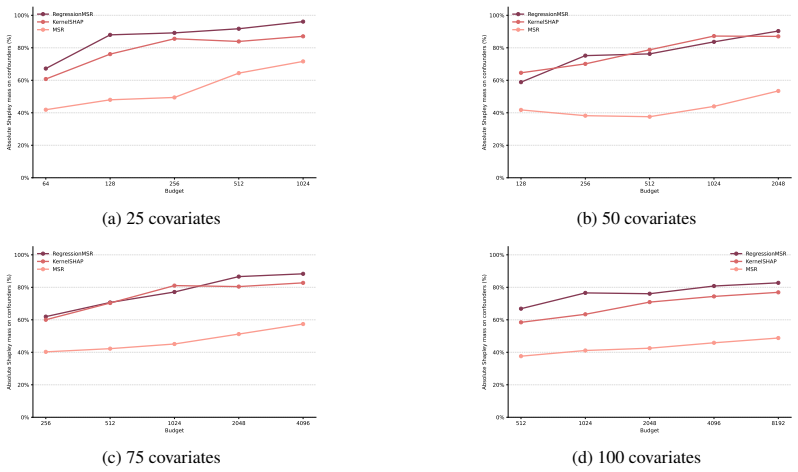
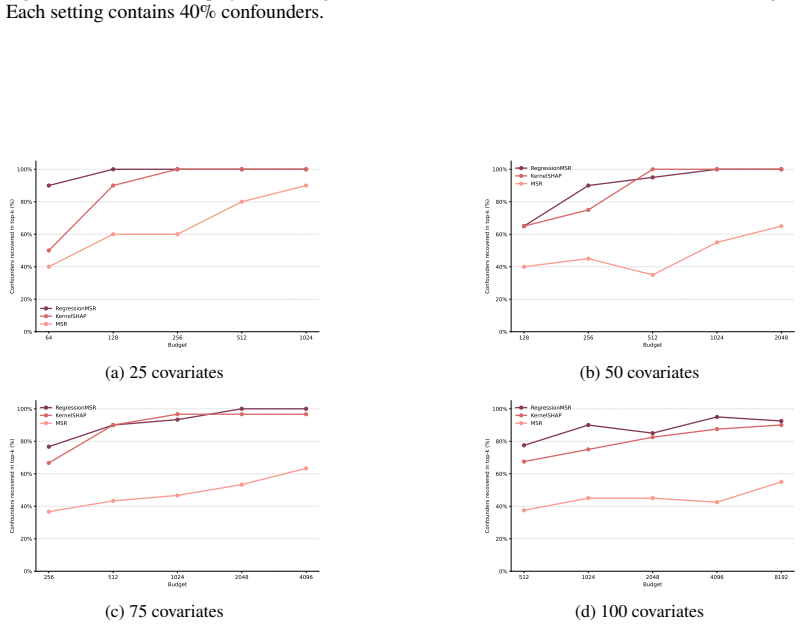
- [demonstration / experiments] The empirical evaluation (demonstration section) reports no quantitative metrics, error bars, or comparisons against ground-truth confounding strengths or alternative methods. Without these, the claim that ConfoundingSHAP 'provides informative explanations' cannot be assessed and the central practical contribution remains unsupported.
- [§3 (Shapley game definition)] The value function of the proposed Shapley game is defined over adjustment sets but contains no explicit mechanism (contrast, bias term, or causal contrast) that subtracts direct predictive effects, mediation, or collider bias. Consequently, the attributions may reflect any form of statistical dependence rather than confounding strength alone; this is load-bearing for the method's validity.
- [§2 / §3] The manuscript asserts that the resulting Shapley values 'differ from the standard applications of SHAP explanations on causal targets' yet provides no formal comparison or counter-example showing that standard SHAP on the outcome or CATE would fail to recover the same ranking of confounders.
minor comments (2)
- [§3] Notation for the value function v(S) and the adjustment-set game should be introduced with a single, self-contained definition rather than scattered across paragraphs.
- [experiments] The abstract states that the method was 'demonstrated on various datasets' but the main text should include a table summarizing dataset characteristics, number of covariates, and sample sizes.
Simulated Author's Rebuttal
We thank the referee for the constructive feedback and positive assessment of ConfoundingSHAP's potential utility. We address each major comment below, indicating where revisions will be made.
read point-by-point responses
-
Referee: The empirical evaluation (demonstration section) reports no quantitative metrics, error bars, or comparisons against ground-truth confounding strengths or alternative methods. Without these, the claim that ConfoundingSHAP 'provides informative explanations' cannot be assessed and the central practical contribution remains unsupported.
Authors: We agree that the demonstration section would be strengthened by quantitative support. The current version uses qualitative illustrations on real datasets to highlight interpretability where ground truth is unavailable. In revision we will add a new subsection with synthetic experiments that have known confounding structures, reporting metrics such as ranking correlation with true confounders and precision at identifying them. We will also compare against baselines (e.g., outcome-model feature importance) and include error bars from repeated simulations. revision: yes
-
Referee: The value function of the proposed Shapley game is defined over adjustment sets but contains no explicit mechanism (contrast, bias term, or causal contrast) that subtracts direct predictive effects, mediation, or collider bias. Consequently, the attributions may reflect any form of statistical dependence rather than confounding strength alone; this is load-bearing for the method's validity.
Authors: The value function is explicitly the absolute change in the estimated average treatment effect when the covariate is added to the adjustment set: v(S) = |τ̂ − τ̂_S|, where τ̂ is the unadjusted estimate and τ̂_S is the estimate after adjusting for S. This focuses on impact to the causal quantity rather than predictive power. We will revise §3 to state this definition more prominently and add a limitations paragraph discussing mediation and collider effects under the maintained no-unmeasured-confounding assumption for the observed covariates. revision: yes
-
Referee: The manuscript asserts that the resulting Shapley values 'differ from the standard applications of SHAP explanations on causal targets' yet provides no formal comparison or counter-example showing that standard SHAP on the outcome or CATE would fail to recover the same ranking of confounders.
Authors: We will add a new comparison subsection (and appendix counter-example) showing that standard SHAP applied to an outcome model or CATE model ranks variables by predictive strength, including non-confounders such as pure outcome predictors. The counter-example uses a simple DAG in which a non-confounder receives high standard SHAP but low ConfoundingSHAP; we will also report empirical ranking differences on one of the real datasets. revision: yes
Circularity Check
No significant circularity in ConfoundingSHAP derivation
full rationale
The paper defines a Shapley game over adjustment sets whose value function measures changes in causal effect estimates, then computes attributions via the standard Shapley formula and approximates the many evaluations with TabPFN. This construction does not reduce any claimed prediction to a fitted parameter by definition, nor does it rely on a self-citation chain or imported uniqueness theorem to justify the central result. The value function is an explicit modeling choice whose correctness is an external assumption rather than a tautology, and the method is presented as a novel targeting of Shapley values rather than a renaming of a known pattern. The derivation therefore remains self-contained against external benchmarks.
Axiom & Free-Parameter Ledger
axioms (2)
- domain assumption A value function over adjustment sets exists that isolates confounding strength
- domain assumption TabPFN can approximate the required value-function evaluations without refitting
Lean theorems connected to this paper
-
IndisputableMonolith/Cost/FunctionalEquation.leanwashburn_uniqueness_aczel unclear?
unclearRelation between the paper passage and the cited Recognition theorem.
We define the game as follows: Coalition values. ... ν(S) := −E[b_S(X_S)]. ... the Shapley value ϕ_j ...
-
IndisputableMonolith/Foundation/RealityFromDistinction.leanreality_from_one_distinction unclear?
unclearRelation between the paper passage and the cited Recognition theorem.
the residual confounding bias ... b_S(x_S) := δ_S(x_S) − τ_S(x_S)
What do these tags mean?
- matches
- The paper's claim is directly supported by a theorem in the formal canon.
- supports
- The theorem supports part of the paper's argument, but the paper may add assumptions or extra steps.
- extends
- The paper goes beyond the formal theorem; the theorem is a base layer rather than the whole result.
- uses
- The paper appears to rely on the theorem as machinery.
- contradicts
- The paper's claim conflicts with a theorem or certificate in the canon.
- unclear
- Pith found a possible connection, but the passage is too broad, indirect, or ambiguous to say the theorem truly supports the claim.
Reference graph
Works this paper leans on
-
[1]
C.BénardandJ.Josse.Variableimportanceforcausalforests: Breakingdowntheheterogeneity of treatment effects.Journal of Causal Inference, 13(1), 2025
work page 2025
-
[2]
Learningoptimaldynamictreatmentregimesusing causal tree methods in medicine
T.Blümlein,J.Persson,andS.Feuerriegel. Learningoptimaldynamictreatmentregimesusing causal tree methods in medicine. InMachine Learning for Healthcare Conference, 2022
work page 2022
- [3]
- [4]
-
[5]
S. L. Chau, R. Hu, J. Gonzalez, and D. Sejdinovic. RKHS-SHAP: Shapley values for kernel methods. InConference on Neural Information Processing Systems (NeurIPS), 2022
work page 2022
-
[6]
arXiv preprint arXiv:2002.11631 , year=
H.Chen,T.Harinen,J.-Y.Lee,MikeYung,andZ.Zhao. CausalML:Pythonpackageforcausal machine learning.arXiv preprint, arXiv:2002.11631, 2020
-
[7]
J.Chen, A.Vargas-Bustamante, K.Mortensen, andA.N.Ortega. Racialandethnicdisparities inhealthcareaccessandutilizationundertheaffordablecareact.MedicalCare,54(2):140–146, 2016
work page 2016
-
[8]
T. Chen and C. Guestrin. XGBoost: A scalable tree boosting system. InInternational Confer- ence on Knowledge Discovery and Data Mining (KDD), 2016
work page 2016
-
[9]
C.CinelliandC.Hazlett. Makingsenseofsensitivity: Extendingomittedvariablebias.Journal of the Royal Statistical Society Series B: Statistical Methodology, 82(1):39–67, 2020
work page 2020
-
[10]
A.F.Connors. TheeffectivenessofrightheartcatheterizationintheinitialcareofcriticallyIII patients.JAMA: The Journal of the American Medical Association, 276(11):889, 1996
work page 1996
-
[11]
I. Covert and S.-I. Lee. Improving KernelSHAP: Practical Shapley value estimation via linear regression. InInternational Conference on Artificial Intelligence and Statistics (AISTATS), 2021
work page 2021
-
[12]
Understandingglobalfeaturecontributionswithadditive importance measures
I.Covert,S.Lundberg,andS.-I.Lee. Understandingglobalfeaturecontributionswithadditive importance measures. InConference on Neural Information Processing Systems (NeurIPS), 2020
work page 2020
-
[13]
Nonparametricestimationofheterogeneoustreatmenteffects: From theory to learning algorithms
A.CurthandM.vanderSchaar. Nonparametricestimationofheterogeneoustreatmenteffects: From theory to learning algorithms. InInternational Conference on Artificial Intelligence and Statistics (AISTATS), 2021. 10
work page 2021
-
[14]
V.Dorie,J.Hill,U.Shalit,M.Scott,andD.Cervone. Automatedversusdo-it-yourselfmethods for causal inference: Lessons learned from a data analysis competition.Statistical Science, 34 (1), 2019
work page 2019
-
[15]
J. Dorn, K. Guo, and N. Kallus. Doubly-valid/Doubly-sharp sensitivity analysis for causal inference with unmeasured confounding.Journal of the American Statistical Association, 120 (549):331–342, 2025
work page 2025
-
[16]
S. Feuerriegel, D. Frauen, V. Melnychuk, J. Schweisthal, K. Hess, A. Curth, S. Bauer, N. Kil- bertus, I. S. Kohane, and M. van der Schaar. Causal machine learning for predicting treatment outcomes.Nature Medicine, 30(4):958–968, 2024
work page 2024
-
[17]
J. Fonseca and J. Stoyanovich. ExplainerPFN: Towards tabular foundation models for model- free zero-shot feature importance estimations.arXiv preprint, arXiv:2601.23068, 2026
- [18]
- [19]
-
[20]
C. Frye, C. Rowat, and I. Feige. Asymmetric Shapley values: Incorporating causal knowledge into model-agnostic explainability. InConference on Neural Information Processing Systems (NeurIPS), 2020
work page 2020
-
[21]
F. Fumagalli, M. Muschalik, P. Kolpaczki, E. Hüllermeier, and B. Hammer. SHAP-IQ: Uni- fied approximation of any-order Shapley interactions. InConference on Neural Information Processing Systems (NeurIPS), 2023
work page 2023
-
[22]
F. Fumagalli, M. Muschalik, P. Kolpaczki, E. Hüllermeier, and B. Hammer. KernelSHAP-IQ: Weighted least-square optimization for Shapley interactions. InInternational Conference on Machine Learning (ICML), 2024
work page 2024
-
[23]
F. Fumagalli, L. Butler, J. S. Kang, K. Ramchandran, and R. T. Witter. An odd estima- tor for Shapley values. InInternational Conference on Machine Learning (ICML), volume arXiv:2602.01399, 2026
-
[24]
PolySHAP:ExtendingKernelSHAPwithinteraction- informed polynomial regression
F.Fumagalli,R.T.Witter,andC.Musco. PolySHAP:ExtendingKernelSHAPwithinteraction- informed polynomial regression. InInternational Conference on Learning Representations (ICLR), 2026
work page 2026
-
[25]
L. Grinsztajn, K. Flöge, O. Key, F. Birkel, P. Jund, B. Roof, B. Jäger, D. Safaric, S. Alessi, A. Hayler, M. Manium, R. Yu, F. Jablonski, S. B. Hoo, A. Garg, J. Robertson, M. Bühler, V. Moroshan, L. Purucker, C. Cornu, L. C. Wehrhahn, A. Bonetto, B. Schölkopf, S. Gambhir, N. Hollmann, and F. Hutter. TabPFN-2.5: Advancing the state of the art in tabular fo...
work page 2026
-
[26]
R.Gutman,S.Sheiba,O.N.Klein,N.D.Bird,A.Gruber,D.Aronson,O.Caspi,andU.Shalit. From observational data to clinical recommendations: A causal framework for estimating patient-level treatment effects and learning policies.arXiv preprint, arXiv:2507.11381, 2025
-
[27]
S. M. Hammer, D. A. Katzenstein, M. D. Hughes, H. Gundacker, R. T. Schooley, R. H. Haubrich,W.K.Henry,M.M.Lederman,J.P.Phair,M.Niu,M.S.Hirsch,andT.C.Merigan. A trial comparing nucleoside monotherapy with combination therapy in HIV-infected adults withCD4cellcountsfrom200to500percubicmillimeter.NewEnglandJournalofMedicine, 335(15):1081–1090, 1996
work page 1996
-
[28]
In- terpretationofepidemiologicstudiesveryoftenlackedadequateconsiderationofconfounding
L.G.Hemkens,H.Ewald,F.Naudet,A.Ladanie,J.G.Shaw,G.Sajeev,andJ.P.Ioannidis. In- terpretationofepidemiologicstudiesveryoftenlackedadequateconsiderationofconfounding. Journal of Clinical Epidemiology, 93:94–102, 2018
work page 2018
-
[29]
M. A. Hernán and J. M. Robins. Using big data to emulate a target trial when a randomized trial is not available.American Journal of Epidemiology, 183(8):758–764, 2016
work page 2016
- [30]
-
[31]
EfficientandSharpOff-PolicyLearning under Unobserved Confounding
K.Hess,D.Frauen,V.Melnychuk,andS.Feuerriegel. EfficientandSharpOff-PolicyLearning under Unobserved Confounding. InInternational Conference on Learning Representations (ICLR), 2026
work page 2026
-
[32]
O. J. Hines, K. Diaz-Ordaz, and S. Vansteelandt. Variable importance measures for heteroge- neous treatment effects.Biometrics, 81(4):ujaf140, 2025
work page 2025
-
[33]
N. Hollmann, S. Müller, K. Eggensperger, and F. Hutter. TabPFN: A transformer that solves small tabular classification problems in a second. InInternational Conference on Learning Representations (ICLR), 2023
work page 2023
-
[34]
Accuratepredictionsonsmalldatawithatabularfoundationmodel.Nature, 637(8045):319–326, Jan
N.Hollmann,S.Müller,L.Purucker,A.Krishnakumar,M.Körfer,S.B.Hoo,R.T.Schirrmeis- ter, andF.Hutter. Accuratepredictionsonsmalldatawithatabularfoundationmodel.Nature, 637(8045):319–326, Jan. 2025
work page 2025
-
[35]
C. Hu, L. Li, W. Huang, T. Wu, Q. Xu, J. Liu, and B. Hu. Interpretable machine learning for early prediction of prognosis in sepsis: A discovery and validation study.Infectious Diseases and Therapy, 11(3):1117–1132, 2022
work page 2022
- [36]
-
[37]
Cambridge University Press, 1 edition, Apr
G.W.ImbensandD.B.Rubin.CausalInferenceforStatistics,Social,andBiomedicalSciences: An Introduction. Cambridge University Press, 1 edition, Apr. 2015
work page 2015
-
[38]
E. H. Kennedy. Towards optimal doubly robust estimation of heterogeneous causal effects. Electronic Journal of Statistics, 17(2), 2023
work page 2023
-
[39]
P. Kolpaczki and E. Hüllermeier. Approximation algorithms for the Shapley value: Taxonomy and properties. InInternational Joint Conference on Artificial Intelligence (IJCAI), 2026
work page 2026
-
[40]
P. Kolpaczki, V. Bengs, M. Muschalik, and E. Hüllermeier. Approximating the Shapley value without marginal contributions. InConference on Artificial Intelligence (AAAI), 2024
work page 2024
-
[41]
P. Kolpaczki, M. Muschalik, F. Fumagalli, B. Hammer, and E. Hüllermeier. SVARM-IQ: Efficientapproximationofany-orderShapleyinteractionsthroughstratification.InInternational Conference on Artificial Intelligence and Statistics (AISTATS), 2024
work page 2024
-
[42]
Z.LiuandX.Huang. Explainingindividualizedtreatmentrules: IntegratingLIMEandSHAP with xgboost in precision medicine.Statistics in Medicine, 44(28-30):e70322, 2025
work page 2025
-
[43]
A. R. Ludtke, I. Diaz, and M. J. van der Laan. The statistics of sensitivity analyses.U.C. Berkeley Division of Biostatistics Working Paper Series, page Working Paper 341, 2015
work page 2015
-
[44]
Aunifiedapproachtointerpretingmodelpredictions
S.LundbergandS.-I.Lee. Aunifiedapproachtointerpretingmodelpredictions. InConference on Neural Information Processing Systems (NeurIPS), 2017
work page 2017
-
[45]
S.M.Lundberg,G.Erion,H.Chen,A.DeGrave,J.M.Prutkin,B.Nair,R.Katz,J.Himmelfarb, N. Bansal, and S.-I. Lee. From local explanations to global understanding with explainable AI for trees.Nature Machine Intelligence, 2(1):56–67, 2020
work page 2020
-
[46]
D. Martens, G. Shmueli, T. Evgeniou, K. Bauer, C. Janiesch, S. Feuerriegel, S. Gabel, S. Goethals, T. Greene, N. Klein, M. Kraus, N. Kühl, C. Perlich, W. Verbeke, A. Zharova, P. Zschech, and F. Provost. Beware of "Explanations" of AI.Business \& Information Systems Engineering (BISE), 2026
work page 2026
-
[47]
M. L. Martini, S. N. Neifert, W. H. Shuman, E. K. Chapman, A. J. Schüpper, E. K. Oermann, J. Mocco, M. Todd, J. C. Torner, A. Molyneux, S. Mayer, P. L. Roux, M. D. I. Vergouwen, G. J. E. Rinkel, G. K. C. Wong, P. Kirkpatrick, A. Quinn, D. Hänggi, N. Etminan, W. M. Van DenBergh,B.N.R.Jaja,M.Cusimano,T.A.Schweizer,J.I.Suarez,H.Fukuda,S.Yamagata, B.Lo,A.Leon...
work page 2022
-
[48]
A. Mcclean, Z. Branson, and E. H. Kennedy. Calibrated sensitivity models.Biometrika, page asag001, 2026
work page 2026
-
[49]
V. Melnychuk, D. Frauen, and S. Feuerriegel. Partial Counterfactual Identification of Con- tinuous Outcomes with a Curvature Sensitivity Model. InConference on Neural Information Processing Systems (NeurIPS), 2023. 12
work page 2023
-
[50]
Inference on Variable Importance for Treatment Effect Heterogeneity: Shapley Values and Beyond
P.Morzywolek,P.B.Gilbert,andA.Luedtke. Inferenceonlocalvariableimportancemeasures for heterogeneous treatment effects.arXiv preprint, arXiv:2510.18843, 2025
work page internal anchor Pith review Pith/arXiv arXiv 2025
-
[51]
M. Muschalik, H. Baniecki, F. Fumagalli, P. Kolpaczki, B. Hammer, and E. Hüllermeier. Shapiq: Shapley interactions for machine learning. InConference on Neural Information Processing Systems (NeurIPS), 2024
work page 2024
-
[52]
M. Muschalik, F. Fumagalli, B. Hammer, and E. Hüllermeier. Beyond TreeSHAP: Efficient computation of any-order shapley interactions for tree ensembles. InConference on Artificial Intelligence (AAAI), volume 38, pages 14388–14396, 2024
work page 2024
-
[53]
InInternational Conference on Learning Representations (ICLR), 2025
M.Muschalik,F.Fumagalli,P.Frazzetto,J.Strotherm,L.Hermes,A.Sperduti,E.Hüllermeier, andB.Hammer.Exactcomputationofany-orderShapleyinteractionsforgraphneuralnetworks. InInternational Conference on Learning Representations (ICLR), 2025
work page 2025
-
[54]
C. Musco and R. T. Witter. Provably accurate Shapley value estimation via leverage score sampling. InInternational Conference on Learning Representations (ICLR), 2025
work page 2025
-
[55]
A. Nadel and R. Wettenstein. From decision trees to boolean logic: A fast and unified SHAP algorithm. InConference on Artificial Intelligence (AAAI), volume 40, pages 24476–24485, 2026
work page 2026
-
[56]
Measuringvariable importance in heterogeneous treatment effects with confidence
J.Paillard,A.R.Lobo,V.Kolodyazhniy,B.Thirion,andD.A.Engemann. Measuringvariable importance in heterogeneous treatment effects with confidence. InInternational Conference on Machine Learning (ICML), 2025
work page 2025
-
[57]
Á. Parafita, T. Garriga, A. Brando, and F. J. Cazorla. Practical Do-Shapley explanations with estimand-agnostic causal inference. InConference on Neural Information Processing Systems (NeurIPS), 2025
work page 2025
-
[58]
Pearl.Causality: Models, Reasoning, and Inference
J. Pearl.Causality: Models, Reasoning, and Inference. Cambridge University Press, 2 edition, 2009
work page 2009
-
[59]
P. Rehill and N. Biddle. Transparency challenges in policy evaluation with causal machine learning: Improving usability and accountability.Data & Policy, 6:e43, 2024
work page 2024
-
[60]
M.T.Ribeiro,S.Singh,andC.Guestrin. "WhyshouldItrustyou?": Explainingthepredictions ofanyclassifier.InInternationalConferenceonKnowledgeDiscoveryandDataMining(KDD), 2016
work page 2016
-
[61]
J. M. Robins, A. Rotnitzky, and D. O. Scharfstein. Sensitivity analysis for selection bias and unmeasured confounding in missing data and causal inference models. In W. Miller, M. E. Halloran, and D. Berry, editors,Statistical Models in Epidemiology, the Environment, and Clinical Trials, volume 116, pages 1–94. Springer New York, New York, NY, 2000
work page 2000
-
[62]
P. R. Rosenbaum and D. B. Rubin. Assessing sensitivity to an unobserved binary covariate in an observational study with binary outcome.Journal of the Royal Statistical Society Series B: Statistical Methodology, 45(2):212–218, Jan. 1983
work page 1983
-
[63]
P. R. Rosenbaum and D. B. Rubin. The central role of the propensity score in observational studies for causal effects.Biometrika, 70(1):41–55, 1983
work page 1983
-
[64]
Estimatingcausaleffectsoftreatmentsinrandomizedandnonrandomizedstudies
D.B.Rubin. Estimatingcausaleffectsoftreatmentsinrandomizedandnonrandomizedstudies. Journal of Educational Psychology, 66(5):688–701, 1974
work page 1974
-
[65]
D.B.Rubin. Causalinferenceusingpotentialoutcomes: Design,modeling,decisions.Journal of the American Statistical Association, 100(469):322–331, 2005
work page 2005
- [66]
-
[67]
K.Sechidis, K.Papangelou, P.D.Metcalfe, D.Svensson, J.Weatherall, andG.Brown. Distin- guishing prognostic and predictive biomarkers: An information theoretic approach.Bioinfor- matics, 34(19):3365–3376, 2018
work page 2018
-
[68]
K.Sechidis,S.Sun,Y.Chen,J.Lu,C.Zhang,M.Baillie,D.Ohlssen,M.Vandemeulebroecke, R. Hemmings, S. Ruberg, and B. Bornkamp. WATCH: A workflow to assess treatment effect heterogeneityindrugdevelopmentforclinicaltrialsponsors.PharmaceuticalStatistics,24(2): e2463, 2025. 13
work page 2025
-
[69]
K. Sechidis, C. Zhang, S. Sun, Y. Chen, A. Spector, and B. Bornkamp. Using individualized treatment effects to assess treatment effect heterogeneity.Statistics in Medicine, 44(28-30): e70324, 2025
work page 2025
-
[70]
L. S. Shapley. A value for n-person games. In H. W. Kuhn and A. W. Tucker, editors, ContributionstotheTheoryofGames(AM-28),VolumeII,pages307–318.PrincetonUniversity Press, 1953
work page 1953
-
[71]
Y. Shi, Y. Zou, J. Liu, Y. Wang, Y. Chen, F. Sun, Z. Yang, G. Cui, X. Zhu, X. Cui, and F.Liu. Ultrasound-basedradiomicsXGBoostmodeltoassesstheriskofcentralcervicallymph node metastasis in patients with papillary thyroid carcinoma: Individual application of SHAP. Frontiers in Oncology, 12:897596, 2022
work page 2022
-
[72]
Y. Shimoni, E. Karavani, S. Ravid, P. Bak, T. H. Ng, S. H. Alford, D. Meade, and Y. Gold- schmidt.Anevaluationtoolkittoguidemodelselectionandcohortdefinitionincausalinference, June 2019
work page 2019
-
[73]
E. Štrumbelj and I. Kononenko. Explaining prediction models and individual predictions with feature contributions.Knowledge and Information Systems, 41(3):647–665, 2014
work page 2014
-
[74]
Q. Sun, K. Zhang, Y. Xu, M. Luo, Z. Yang, Q. Liu, S. Liu, and A. Liu. Explainable machine learningforpredictingclinicaloutcomesinHIV/TBco-infection: Acomparativeretrospective study.BMC Infectious Diseases, 25(1):1589, 2025
work page 2025
-
[75]
D. Svensson, E. Hermansson, N. Nikolaou, K. Sechidis, and I. Lipkovich. Overview and practical recommendations on using Shapley values for identifying predictive biomarkers via CATE modeling.arXiv preprint, arXiv:2505.01145, 2025
-
[76]
Z. Tan. A distributional approach for causal inference using propensity scores.Journal of the American Statistical Association, 101(476):1619–1637, 2006
work page 2006
-
[77]
C.Tarabanis,E.Kalampokis,M.Khalil,C.L.Alviar,L.A.Chinitz,andL.Jankelson. Explain- able SHAP-XGBoost models for in-hospital mortality after myocardial infarction.Cardiovas- cular Digital Health Journal, 4(4):126–132, 2023
work page 2023
-
[78]
J.Textor,B.VanDerZander,M.S.Gilthorpe,M.Liśkiewicz,andG.T.Ellison. Robustcausal inference using directed acyclic graphs: The R package ‘dagitty’.International Journal of Epidemiology, page dyw341, 2017
work page 2017
-
[79]
M. J. Van Der Laan and D. Rubin. Targeted maximum likelihood learning.The International Journal of Biostatistics, 2(1), 2006
work page 2006
-
[80]
T. J. VanderWeele and P. Ding. Sensitivity analysis in observational research: Introducing the E-value.Annals of Internal Medicine, 167(4):268–274, 2017
work page 2017
discussion (0)
Sign in with ORCID, Apple, or X to comment. Anyone can read and Pith papers without signing in.