Recognition: 2 theorem links
· Lean TheoremGHGbench: A Unified Multi-Entity, Multi-Task Benchmark for Carbon Emission Prediction
Pith reviewed 2026-05-14 19:45 UTC · model grok-4.3
The pith
GHGbench shows building carbon emissions are structurally harder to predict than company emissions, with out-of-distribution gaps dominating model differences.
A machine-rendered reading of the paper's core claim, the machinery that carries it, and where it could break.
Core claim
GHGbench establishes that building-level greenhouse gas emission prediction is structurally more difficult than company-level prediction, that the in-distribution to out-of-distribution performance gap substantially exceeds within-model differences across both tracks, that a tabular foundation model is the first baseline to open a paired-bootstrap-significant improvement over tuned gradient-boosted trees on multi-city building tasks, and that multimodal remote-sensing embeddings deliver gains precisely where tabular generalization collapses, while exposing catastrophic city transfer and sector-factor lookup ceilings as systematic limitations.
What carries the argument
The GHGbench benchmark, consisting of a company track with 32,000+ records and a building track with 491,591 harmonized records across 26 metropolitan areas, evaluated on canonical in-distribution and cross-region/city transfer splits using multi-seed paired-bootstrap statistical tests.
Load-bearing premise
Harmonizing 13 heterogeneous building data sources into a single schema produces accurate labels and features without introducing systematic errors that affect the reported generalization gaps.
What would settle it
Re-evaluating the building track on the same splits but with independently sourced and harmonized emission labels from additional cities that removes the paired-bootstrap significance between the tabular foundation model and tuned trees would falsify the central performance claims.
Figures


read the original abstract
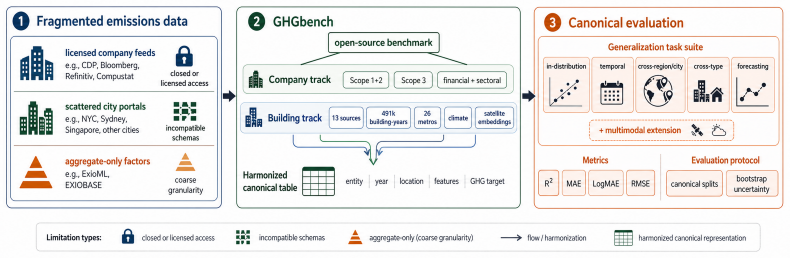
Open datasets and benchmarks for entity-level carbon-emission prediction remain fragmented across access, scale, granularity, and evaluation. We introduce GHGbench, an open dataset and benchmark for company- and building-level greenhouse-gas prediction. The company track contains 32,000+ company-year records from 12,000+ firms with Scope 1+2 and Scope 3 disclosures and financial/sectoral signals; the building track harmonises 491,591 building-year records from 13 open sources into a single schema across 26 metropolitan areas (10 U.S., 15 Australian, 1 Singaporean), with climate covariates and multimodal remote-sensing embeddings. GHGbench defines canonical splits with in-distribution and cross-region/city transfer as primary tasks and temporal hold-out plus short-horizon forecasting as supplementary appendix evidence; headline baselines span gradient-boosted trees, a tabular foundation model, MLP, FT-Transformer, and multimodal fusion, with an LLM panel as auxiliary, all evaluated under multi-seed paired-bootstrap tests. Three benchmark-level findings emerge: (i) building emissions are structurally harder than company emissions; (ii) the in-distribution to out-of-distribution gap dwarfs any within-model gap across both the company track and the building track, and a tabular foundation model is, to our knowledge, the first baseline to open a paired-bootstrap-significant gap over tuned trees on a multi-city building-emissions task; (iii) multimodal remote-sensing embeddings help precisely where tabular generalisation breaks. GHGbench also exposes catastrophic city transfer and the sector-factor lookup ceiling as systematic failure modes. Code and reconstruction recipes are available at GHGbench.
Editorial analysis
A structured set of objections, weighed in public.
Referee Report
Summary. The manuscript introduces GHGbench, a unified benchmark for company- and building-level greenhouse gas emission prediction. The company track aggregates over 32,000 company-year records from 12,000+ firms with Scope 1+2 and Scope 3 disclosures plus financial/sectoral signals. The building track harmonizes 491,591 building-year records from 13 open sources into a single schema across 26 metropolitan areas (10 U.S., 15 Australian, 1 Singaporean), incorporating climate covariates and multimodal remote-sensing embeddings. Canonical splits emphasize in-distribution versus cross-region/city transfer tasks, with temporal hold-out and short-horizon forecasting as supplementary evidence. Baselines include gradient-boosted trees, a tabular foundation model, MLP, FT-Transformer, multimodal fusion, and an auxiliary LLM panel, all evaluated with multi-seed paired-bootstrap tests. Three headline findings are reported: (i) building emissions are structurally harder than company emissions; (ii) ID-to-OOD gaps dwarf within-model differences, with the tabular foundation model achieving the first paired-bootstrap-significant improvement over tuned trees on the multi-city building task; (iii) multimodal remote-sensing embeddings help precisely where tabular generalization breaks. The work also identifies catastrophic city transfer and sector-factor lookup ceilings as systematic failure modes, with code and reconstruction recipes released.
Significance. If the harmonization steps are validated to preserve unbiased labels and features, GHGbench would constitute a valuable contribution by establishing the first large-scale, multi-entity benchmark that systematically tests generalization across cities, regions, and modalities in carbon-emission prediction. The explicit release of code/recipes, use of paired-bootstrap significance testing, and identification of concrete failure modes (city transfer, lookup ceilings) are strengths that support reproducibility and future work. The reported dominance of distribution shift over model choice, together with the utility of remote-sensing embeddings, could usefully inform model design in this application area.
major comments (1)
- [Building track harmonization] Building track (abstract and § on data construction): the central claims (i)–(iii) all rest on the harmonized 491k-record building dataset. The manuscript states that 13 heterogeneous sources were unified but reports no quantitative validation of this step—no inter-source label agreement metrics, no ablation on single-source subsets, and no audit of imputation or aggregation-rule effects. Without such checks, systematic differences in reporting standards, emission-factor assumptions, or city-level aggregation could artifactually inflate the reported ID/OOD gaps and multimodal gains, exactly as flagged by the weakest-assumption analysis.
minor comments (2)
- The abstract and methods would benefit from a concise table summarizing the 13 building sources, their original schemas, and the exact harmonization rules applied (even if full recipes are in the released code).
- Clarify whether the paired-bootstrap tests correct for multiple comparisons across the many model–split combinations reported.
Simulated Author's Rebuttal
We thank the referee for the constructive feedback and for recognizing the potential value of GHGbench for the community. We address the single major comment below and will incorporate the suggested validation steps in the revised manuscript.
read point-by-point responses
-
Referee: [Building track harmonization] Building track (abstract and § on data construction): the central claims (i)–(iii) all rest on the harmonized 491k-record building dataset. The manuscript states that 13 heterogeneous sources were unified but reports no quantitative validation of this step—no inter-source label agreement metrics, no ablation on single-source subsets, and no audit of imputation or aggregation-rule effects. Without such checks, systematic differences in reporting standards, emission-factor assumptions, or city-level aggregation could artifactually inflate the reported ID/OOD gaps and multimodal gains, exactly as flagged by the weakest-assumption analysis.
Authors: We agree that quantitative validation of the harmonization is necessary to support the central claims. The original manuscript emphasized release of the full reconstruction recipes to enable external audits, but did not include explicit agreement metrics or sensitivity checks. In the revision we will add: (i) pairwise label agreement statistics on the subset of buildings that appear in multiple sources, (ii) performance ablations restricted to single-source city subsets for the largest metropolitan areas, and (iii) sensitivity tables showing how ID/OOD gaps and multimodal gains change under alternative imputation and aggregation rules. These additions will confirm that the reported findings are robust to harmonization choices. revision: yes
Circularity Check
No circularity: benchmark relies on external data harmonization and standard evaluation protocols
full rationale
The paper constructs GHGbench by aggregating and harmonizing 13 external public building datasets plus company disclosures, defines canonical ID/OOD splits, and evaluates off-the-shelf baselines (trees, tabular foundation models, multimodal fusion) under paired-bootstrap tests. No equations, fitted parameters, or self-citations are used to derive the three headline empirical findings; those findings are direct statistical comparisons on the released data. The harmonization step is presented as a preprocessing recipe whose validity is left to external audit rather than being defined in terms of the reported gaps. This is a standard benchmark paper whose derivation chain is self-contained against external sources and does not reduce any claim to its own inputs by construction.
Axiom & Free-Parameter Ledger
axioms (1)
- standard math Standard multi-seed paired-bootstrap statistical tests are appropriate for comparing model performance on this data.
Lean theorems connected to this paper
-
IndisputableMonolith/Cost/FunctionalEquation.leanwashburn_uniqueness_aczel unclear?
unclearRelation between the paper passage and the cited Recognition theorem.
The building track harmonises 491,591 building-year records from 13 open sources into a single schema... headline baselines span gradient-boosted trees, a tabular foundation model, MLP, FT-Transformer, and multimodal fusion
-
IndisputableMonolith/Foundation/RealityFromDistinction.leanreality_from_one_distinction unclear?
unclearRelation between the paper passage and the cited Recognition theorem.
Three benchmark-level findings emerge: (i) building emissions are structurally harder... (ii) the in-distribution to out-of-distribution gap dwarfs any within-model gap... (iii) multimodal remote-sensing embeddings help precisely where tabular generalisation breaks
What do these tags mean?
- matches
- The paper's claim is directly supported by a theorem in the formal canon.
- supports
- The theorem supports part of the paper's argument, but the paper may add assumptions or extra steps.
- extends
- The paper goes beyond the formal theorem; the theorem is a base layer rather than the whole result.
- uses
- The paper appears to rely on the theorem as machinery.
- contradicts
- The paper's claim conflicts with a theorem or certificate in the canon.
- unclear
- Pith found a possible connection, but the passage is too broad, indirect, or ambiguous to say the theorem truly supports the claim.
Reference graph
Works this paper leans on
-
[1]
Abdul Fatir Ansari, Lorenzo Stella, Caner Turkmen, Xiyuan Zhang, Pedro Mercado, Huibin Shen, Oleksandr Shchur, Syama Sundar Rangapuram, Sebastian Pineda Arango, Shubham Kapoor, Jasper Zschiegner, Danielle C. Maddix, Hao Wang, Michael W. Mahoney, Kari Torkkola, Andrew Gordon Wilson, Michael Bohlke-Schneider, and Yuyang Wang. Chronos: Learning the language ...
work page 2024
-
[2]
The Claude 3 model family: Opus, Sonnet, Haiku
Anthropic. The Claude 3 model family: Opus, Sonnet, Haiku. https://www.anthropic. com/news/claude-3-family, 2024
work page 2024
-
[3]
Pandarasamy Arjunan, Kameshwar Poolla, and Clayton Miller. EnergyStar++: Towards more accurate and explanatory building energy benchmarking.Applied Energy, 276:115413, 2020. doi: 10.1016/j.apenergy.2020.115413
-
[4]
Jérémi Assael, Thibaut Heurtebize, Laurent Carlier, and François Soupé. Greenhouse gases emissions: Estimating corporate non-reported emissions using interpretable machine learning. Sustainability, 15(4):3391, 2023. doi: 10.3390/su15043391
-
[5]
Jacob Beck, Anna Steinberg, Andreas Dimmelmeier, et al. Addressing data gaps in sustainability reporting: A benchmark dataset for greenhouse gas emission extraction.Scientific Data, 12: 1497, 2025. doi: 10.1038/s41597-025-05664-8
-
[6]
Do investors care about carbon risk?Journal of Financial Economics, 142(2):517–549, 2021
Patrick Bolton and Marcin Kacperczyk. Do investors care about carbon risk?Journal of Financial Economics, 142(2):517–549, 2021. doi: 10.1016/j.jfineco.2021.05.008
-
[7]
Leo Breiman. Random forests.Machine Learning, 45(1):5–32, 2001. doi: 10.1023/A: 1010933404324
work page doi:10.1023/a: 2001
-
[8]
Tianqi Chen and Carlos Guestrin. XGBoost: A scalable tree boosting system. InProceedings of the 22nd ACM SIGKDD International Conference on Knowledge Discovery and Data Mining, pages 785–794, 2016. doi: 10.1145/2939672.2939785
-
[9]
SatMAE: Pre-training transformers for temporal and multi-spectral satellite imagery
Yezhen Cong, Samar Khanna, Chenlin Meng, Patrick Liu, Erik Rozi, Yutong He, Marshall Burke, David Lobell, and Stefano Ermon. SatMAE: Pre-training transformers for temporal and multi-spectral satellite imagery. InAdvances in Neural Information Processing Systems, volume 35, 2022
work page 2022
-
[10]
Felix Creutzig, Giovanni Baiocchi, Robert Bierkandt, Peter-Paul Pichler, and Karen C. Seto. Global typology of urban energy use and potentials for an urbanization mitigation wedge. Proceedings of the National Academy of Sciences, 112(20):6283–6288, 2015. doi: 10.1073/ pnas.1315545112
work page 2015
-
[11]
A decoder-only foundation model for time-series forecasting
Abhimanyu Das, Weihao Kong, Rajat Sen, and Yichen Zhou. A decoder-only foundation model for time-series forecasting. InInternational Conference on Machine Learning (ICML), 2024
work page 2024
-
[12]
International Journal of Forecasting 27, 822–844
Hengfang Deng, David Fannon, and Matthew J. Eckelman. Predictive modeling for US commercial building energy use: A comparison of existing statistical and machine learning algorithms using CBECS microdata.Energy and Buildings, 163:34–43, 2018. doi: 10.1016/j. enbuild.2017.12.031
work page doi:10.1016/j 2018
-
[13]
Dougherty, Tianyuan Huang, Yirong Chen, Rishee K
Thomas R. Dougherty, Tianyuan Huang, Yirong Chen, Rishee K. Jain, and Ram Rajagopal. SCHMEAR: Scalable construction of holistic models for energy analysis from rooftops. In Proceedings of the 8th ACM International Conference on Systems for Energy-Efficient Buildings, Cities, and Transportation (BuildSys), 2021
work page 2021
-
[14]
M. Drusch, U. Del Bello, S. Carlier, O. Colin, V . Fernandez, F. Gascon, B. Hoersch, C. Isola, P. Laberinti, P. Martimort, A. Meygret, F. Spoto, O. Sy, F. Marchese, and P. Bargellini. Sentinel- 2: ESA’s optical high-resolution mission for GMES operational services.Remote Sensing of Environment, 120:25–36, 2012. doi: 10.1016/j.rse.2011.11.026
-
[15]
Patrick Emami, Abhijeet Sahu, and Peter Graf. BuildingsBench: A large-scale dataset of 900K buildings and benchmark for short-term load forecasting. InAdvances in Neural Information Processing Systems (NeurIPS) Datasets and Benchmarks Track, 2023. 10
work page 2023
-
[16]
Benchmarking distribution shift in tabular data with TableShift
Josh Gardner, Zoran Popovic, and Ludwig Schmidt. Benchmarking distribution shift in tabular data with TableShift. InAdvances in Neural Information Processing Systems (NeurIPS) Datasets and Benchmarks Track, 2023
work page 2023
-
[17]
Revisiting deep learning models for tabular data
Yury Gorishniy, Ivan Rubachev, Valentin Khrulkov, and Artem Babenko. Revisiting deep learning models for tabular data. InAdvances in Neural Information Processing Systems (NeurIPS), 2021
work page 2021
-
[18]
Léo Grinsztajn, Edouard Oyallon, and Gaël Varoquaux. Why do tree-based models still outperform deep learning on typical tabular data? InAdvances in Neural Information Processing Systems (NeurIPS) Datasets and Benchmarks Track, 2022
work page 2022
-
[19]
ExioML: Eco-economic dataset for machine learning in global sectoral sustainability
Yanming Guo, Charles Guan, and Jin Ma. ExioML: Eco-economic dataset for machine learning in global sectoral sustainability. InTackling Climate Change with Machine Learning Workshop at ICLR, 2024. arXiv:2406.09046
-
[20]
Group reasoning emission estimation networks.arXiv preprint arXiv:2502.06874, 2025
Yanming Guo, Xiao Qian, Kevin Credit, and Jin Ma. Group reasoning emission estimation networks.arXiv preprint arXiv:2502.06874, 2025. Tackling Climate Change with Machine Learning Workshop at ICLR 2025; introduces the ExioNAICS dataset
-
[21]
Estimation of corporate greenhouse gas emissions via machine learning
You Han, Achintya Gopal, Liwen Ouyang, and Aaron Key. Estimation of corporate greenhouse gas emissions via machine learning. InTackling Climate Change with Machine Learning Workshop at ICML, 2021. arXiv:2109.04318
-
[22]
Accurate predictions on small data with a tabular foundation model.Nature, 637(8045):319–326, 2025
Noah Hollmann, Samuel Müller, Lennart Purucker, Arjun Krishnakumar, Max Körfer, Shi Bin Hoo, Robin Tibor Schirrmeister, and Frank Hutter. Accurate predictions on small data with a tabular foundation model.Nature, 637:319–326, 2025. doi: 10.1038/s41586-024-08328-6
-
[23]
Climate change 2023: Synthesis report
IPCC. Climate change 2023: Synthesis report. contribution of Working Groups I, II and III to the Sixth Assessment Report of the Intergovernmental Panel on Climate Change. Technical report, Intergovernmental Panel on Climate Change, Geneva, Switzerland, 2023
work page 2023
-
[24]
Albert Q. Jiang, Alexandre Sablayrolles, Arthur Mensch, Chris Bamford, Devendra Singh Chaplot, Diego de las Casas, Florian Bressand, Gianna Lengyel, Guillaume Lample, Lucile Saulnier, et al. Mistral 7B.arXiv preprint arXiv:2310.06825, 2023
work page internal anchor Pith review Pith/arXiv arXiv 2023
-
[25]
LightGBM: A highly efficient gradient boosting decision tree
Guolin Ke, Qi Meng, Thomas Finley, Taifeng Wang, Wei Chen, Weidong Ma, Qiwei Ye, and Tie-Yan Liu. LightGBM: A highly efficient gradient boosting decision tree. InAdvances in Neural Information Processing Systems (NeurIPS), 2017
work page 2017
-
[26]
Tian Li, Tianqi Liu, Azadeh Omidfar Sawyer, Pingbo Tang, Vivian Loftness, Yi Lu, and Jiarong Xie. Generalized building energy and carbon emissions benchmarking with post-prediction analysis.Developments in the Built Environment, 17:100320, 2024. doi: 10.1016/j.dibe.2024. 100320
-
[27]
Hobson, Zixiao Shi, and Forrest Meg- gers
Clayton Miller, Anjukan Kathirgamanathan, Bianca Picchetti, Pandarasamy Arjunan, June Young Park, Zoltan Nagy, Paul Raftery, Brodie W. Hobson, Zixiao Shi, and Forrest Meg- gers. The building data genome project 2, energy meter data from the ASHRAE great energy predictor III competition.Scientific Data, 7(1):368, 2020. doi: 10.1038/s41597-020-00712-x
-
[28]
NASA Langley Research Center POWER Project. NASA POWER daily api. https://power. larc.nasa.gov/docs/services/api/temporal/daily/, 2026. Accessed 2026-04-25
work page 2026
-
[29]
Quyen Nguyen, Ivan Diaz-Rainey, and Duminda Kuruppuarachchi. Predicting corporate carbon footprints for climate finance risk analyses: A machine learning approach.Energy Economics, 95:105129, 2021. doi: 10.1016/j.eneco.2021.105129
-
[30]
Quyen Nguyen, Ivan Diaz-Rainey, Adam Kitto, Ben I. McNeil, Nicholas A. Pittman, and Renzhu Zhang. Scope 3 emissions: Data quality and machine learning prediction accuracy. PLOS Climate, 2(11):e0000208, 2023. doi: 10.1371/journal.pclm.0000208
-
[31]
nopperl. Corporate emission reports: LLM finetuning dataset for extracting Scope 1/2/3 from sustainability reports. https://github.com/nopperl/corporate_emission_reports,
-
[32]
Accessed 2026-04-26. 11
work page 2026
-
[33]
OpenAI. GPT-4 technical report.arXiv preprint arXiv:2303.08774, 2023
work page internal anchor Pith review Pith/arXiv arXiv 2023
-
[34]
Colorado J. Reed, Ritwik Gupta, Shufan Li, Sarah Brockman, Christopher Funk, Brian Clipp, Kurt Keutzer, Salvatore Candido, Matt Uyttendaele, and Trevor Darrell. Scale-MAE: A scale- aware masked autoencoder for multiscale geospatial representation learning. InProceedings of the IEEE/CVF International Conference on Computer Vision (ICCV), 2023
work page 2023
-
[35]
David Rolnick, Priya L. Donti, Lynn H. Kaack, Kelly Kochanski, Alexandre Lacoste, Kris Sankaran, Andrew Slavin Ross, Nikola Milojevic-Dupont, Natasha Jaques, Anna Waldman- Brown, Alexandra Sasha Luccioni, Tegan Maharaj, Evan D. Sherwin, S. Karthik Mukkavilli, Konrad P. Kording, Carla Gomes, Andrew Y . Ng, Demis Hassabis, John C. Platt, Felix Creutzig, Jen...
-
[36]
Machine learning models for prediction of Scope 3 carbon emissions
George Serafeim and Gladys Vélez Caicedo. Machine learning models for prediction of Scope 3 carbon emissions. Technical Report 22-080, Harvard Business School, 2022. URL https://www.hbs.edu/faculty/Pages/item.aspx?num=62566
work page 2022
-
[37]
Konstantin Stadler, Richard Wood, Tatyana Bulavskaya, Carl-Johan Södersten, Moana Simas, Sarah Schmidt, Arkaitz Usubiaga, José Acosta-Fernández, Jeroen Kuenen, Martin Bruckner, Stefan Giljum, Stephan Lutter, Stefano Merciai, Jannick H. Schmidt, Michaela C. Theurl, Christoph Plutzar, Thomas Kastner, Nina Eisenmenger, Karl-Heinz Erb, Arjan de Koning, and Ar...
-
[38]
Malof, Bohao Huang, and Kyle Bradbury
Artem Streltsov, Jordan M. Malof, Bohao Huang, and Kyle Bradbury. Estimating residential building energy consumption using overhead imagery.Applied Energy, 280:116018, 2020. doi: 10.1016/j.apenergy.2020.116018
-
[39]
a rXiv preprint arXiv:2412.02732 (2024)
Daniela Szwarcman, Sujit Roy, Paolo Fraccaro, et al. Prithvi-EO-2.0: A versatile multi-temporal foundation model for Earth observation applications.arXiv preprint arXiv:2412.02732, 2024
-
[40]
Cli- matebert: A pretrained language model for climate-related text,
Nicolas Webersinke, Mathias Kraus, Julia Anna Bingler, and Markus Leippold. ClimateBert: A pretrained language model for climate-related text.arXiv preprint arXiv:2110.12010, 2021
-
[41]
Unified training of universal time series forecasting transformers
Gerald Woo, Chenghao Liu, Akshat Kumar, Caiming Xiong, Silvio Savarese, and Doyen Sahoo. Unified training of universal time series forecasting transformers. InInternational Conference on Machine Learning (ICML), 2024
work page 2024
-
[42]
The GHG protocol: A corporate accounting and reporting standard (revised edition)
World Resources Institute and World Business Council for Sustainable Development. The GHG protocol: A corporate accounting and reporting standard (revised edition). https: //ghgprotocol.org/corporate-standard, 2004
work page 2004
-
[43]
Corporate value chain (Scope 3) accounting and reporting standard
World Resources Institute and World Business Council for Sustainable Develop- ment. Corporate value chain (Scope 3) accounting and reporting standard. Tech- nical report, Greenhouse Gas Protocol, 2011. URL https://ghgprotocol.org/ corporate-value-chain-scope-3-standard
work page 2011
-
[44]
An Yang, Baosong Yang, Beichen Zhang, Binyuan Hui, Bo Zheng, Bowen Yu, Chengyuan Li, Dayiheng Liu, Fei Huang, Haoran Wei, et al. Qwen2.5 technical report.arXiv preprint arXiv:2412.15115, 2024
work page internal anchor Pith review Pith/arXiv arXiv 2024
-
[45]
Winston Yap, Angela N. Wu, Clayton Miller, et al. Revealing building operating carbon dynamics for multiple cities.Nature Sustainability, 8:1199–1210, 2025. doi: 10.1038/ s41893-025-01615-8. 12 Table 3: GHGbench dataset overview. Track Scale Targets Key signals Company 12,087 companies; 32,830 enriched company–year rows from 2018–2023; 31,331 usable Scope...
-
[46]
Institutional review board (IRB) approvals or equivalent for research with human subjects Question: Does the paper describe potential risks incurred by study participants, whether such risks were disclosed to the subjects, and whether Institutional Review Board (IRB) approvals (or an equivalent approval/review based on the requirements of your country or ...
discussion (0)
Sign in with ORCID, Apple, or X to comment. Anyone can read and Pith papers without signing in.