The Topological Stability Index: A Variance-Based Measure for Persistence Barcodes
Pith reviewed 2026-06-29 00:24 UTC · model grok-4.3
The pith
The normalized Topological Stability Index on persistence barcodes is an affine function of the collision probability and thus a monotone reparametrization of Rényi entropy of order two.
A machine-rendered reading of the paper's core claim, the machinery that carries it, and where it could break.
Core claim
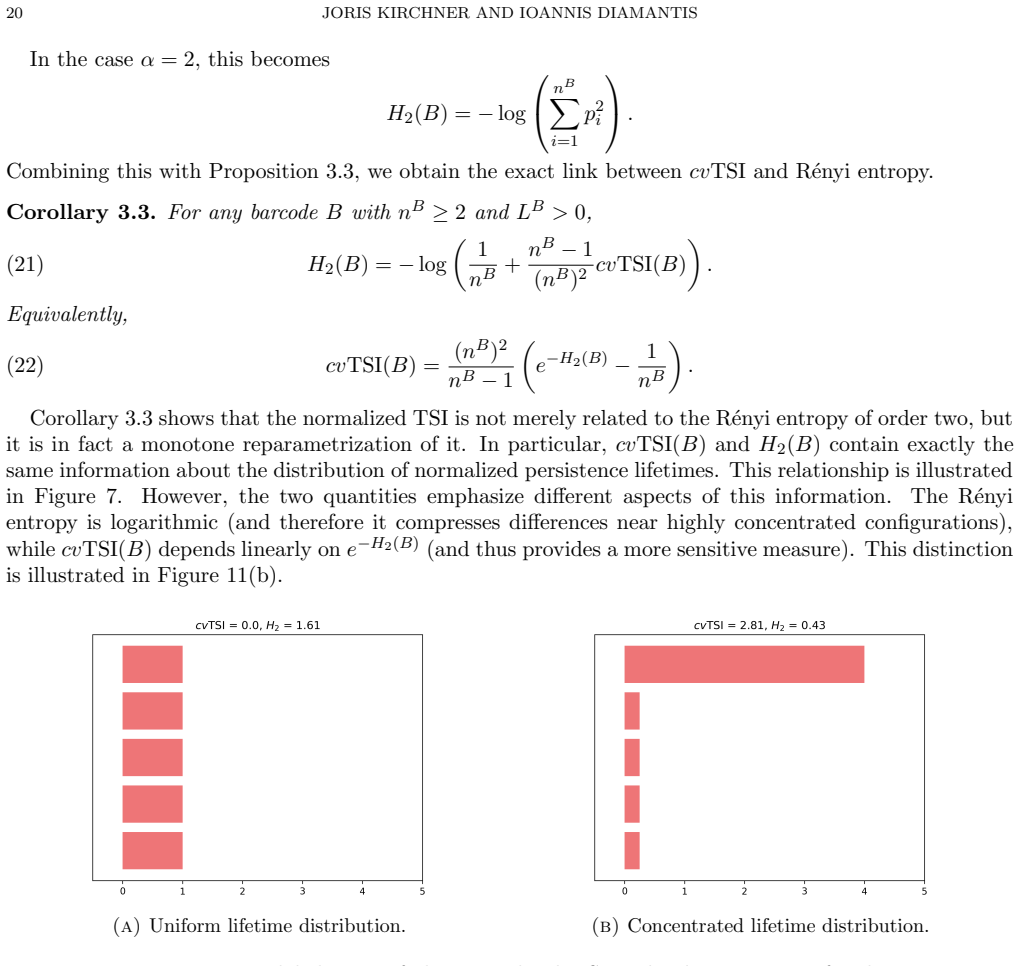
The normalized cvTSI is an affine function of the collision probability sum p_i squared, and therefore a monotone reparametrization of the Rényi entropy of order two, establishing an explicit algebraic bridge between variance-based and entropy-based summaries for persistence barcodes.
What carries the argument
cvTSI, the normalized coefficient of variation of persistence lifetimes, which satisfies an algebraic identity with the collision probability sum p_i squared.
If this is right
- TSI remains sensitive to heterogeneous feature scales while persistent entropy does not.
- Explicit update formulas allow efficient recomputation when bars are inserted or deleted.
- TSigI supplies the typical lifetime scale as a complement to the dispersion measured by TSI.
- The index detects stochastic fluctuations in time series that leave entropy unchanged.
- Translation invariance under lifetime shifts follows directly from the variance definition.
Where Pith is reading between the lines
- The algebraic link suggests that existing Rényi-entropy algorithms could be reused to compute variance summaries on barcodes without separate code paths.
- Hybrid descriptors that combine cvTSI with higher-order Rényi entropies might separate scale effects from distribution shape more cleanly than either family alone.
- Because the relation is exact, any theoretical guarantee proved for one summary transfers immediately to the other after the affine reparametrization.
Load-bearing premise
Normalizing the lifetimes to form a probability distribution does not erase the absolute-scale information that the original variance measure is meant to retain.
What would settle it
A set of bar lengths for which the computed cvTSI differs numerically from one minus the sum of squared normalized lengths.
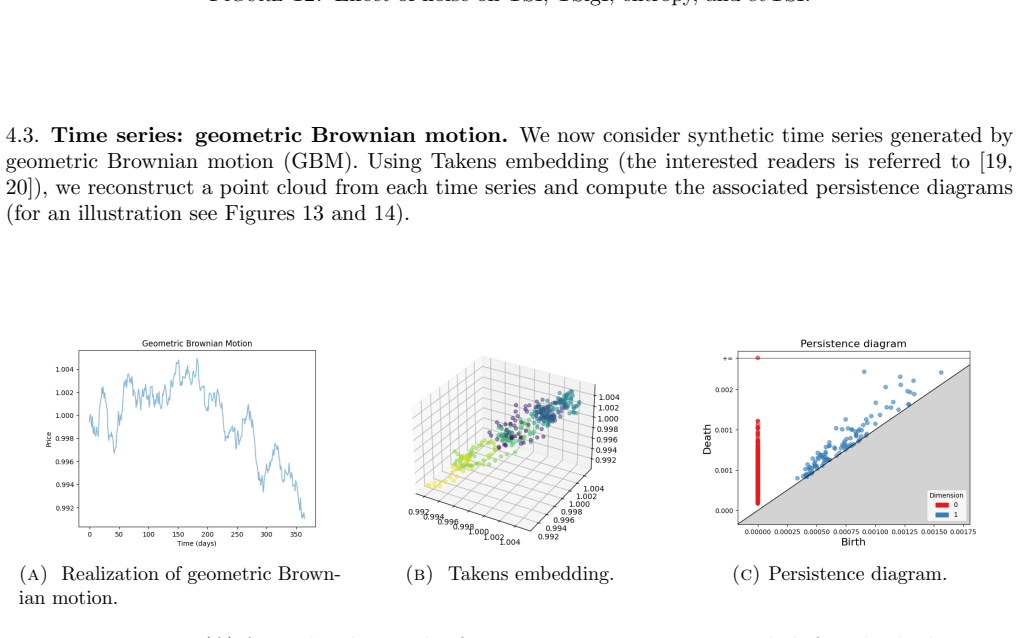
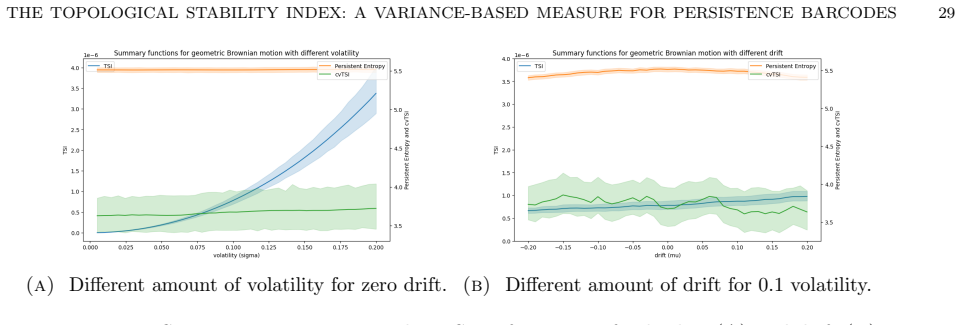
Figures
read the original abstract
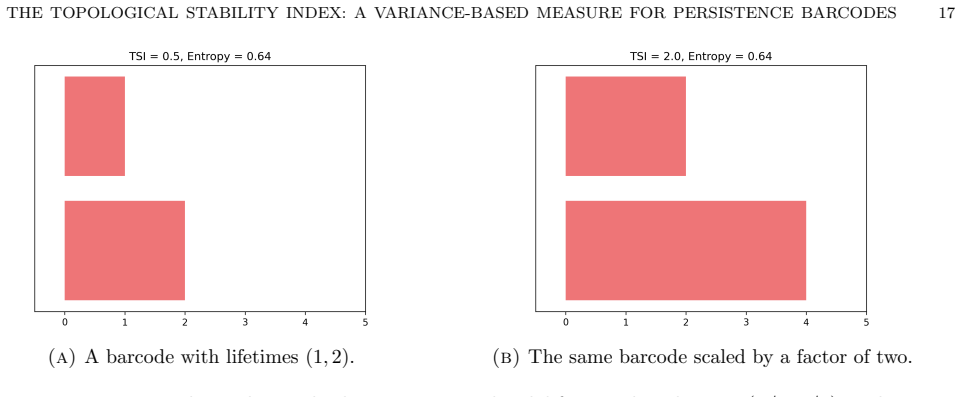
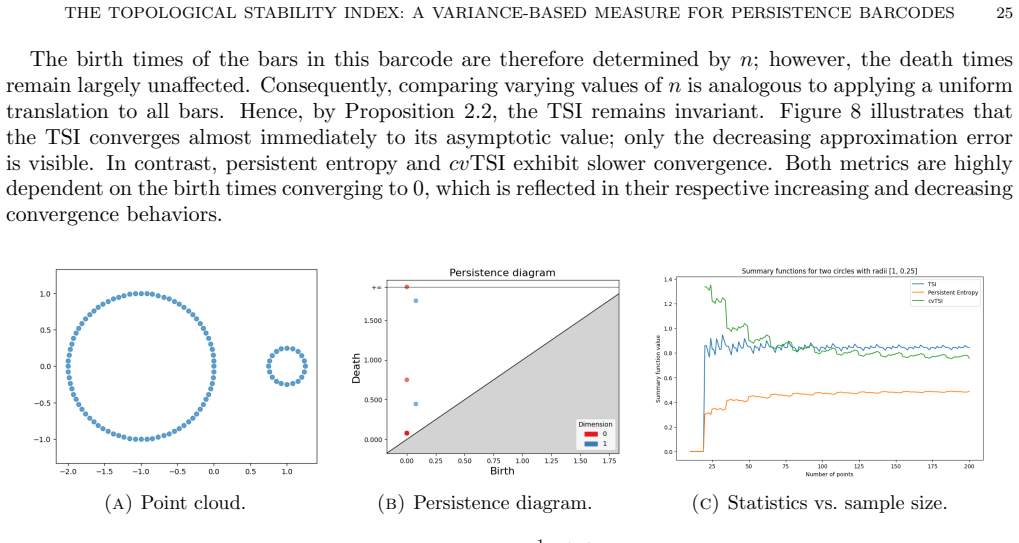
We introduce the \emph{Topological Stability Index} (TSI), a variance-based scalar measure for persistence barcodes that quantifies the dispersion of persistence lifetimes. Unlike persistent entropy, which depends only on normalized weights, the TSI captures absolute variability and is sensitive to heterogeneous feature scales. We establish fundamental properties of the TSI, including its scaling behavior, invariance under lifetime translation and explicit update formulas under insertion and deletion of bars. We also consider a complementary first-moment-type quantity, the Topological Signal Index (TSigI), which captures the typical scale of persistence lifetimes and provides additional interpretability alongside the TSI. We further introduce a normalized version, $cv\text{TSI}$, which is scale invariant and admits an explicit algebraic relation to the R\'enyi entropy of order two. In particular, $cv\text{TSI}$ is an affine function of the collision probability $\sum_i p_i^2$, and therefore a monotone reparametrization of the R\'enyi entropy, providing a direct link between variance-based and entropy-based summaries in topological data analysis. Numerical experiments on synthetic data and stochastic time series demonstrate that the TSI captures structural variability complementary to entropy: it is relatively insensitive to deterministic trends, while responding strongly to stochastic fluctuations and variations in persistence magnitude.
Editorial analysis
A structured set of objections, weighed in public.
Referee Report
Summary. The paper introduces the Topological Stability Index (TSI) as a variance-based scalar summary of persistence lifetimes in barcodes, claiming to establish its scaling behavior, translation invariance, and explicit update formulas under bar insertion/deletion. It also defines a complementary first-moment index (TSigI) and a normalized scale-invariant variant cvTSI, asserting that cvTSI is an affine function of the collision probability ∑p_i² and hence a monotone reparametrization of the Rényi entropy of order two. Numerical experiments on unspecified synthetic data and stochastic time series are presented to argue that TSI captures structural variability complementary to persistent entropy.
Significance. The explicit algebraic identity relating cvTSI to the collision probability (and thus to Rényi-2 entropy) is a direct, parameter-free link between variance-based and entropy-based topological summaries; this is a genuine strength if the supporting derivations are supplied. The claimed invariance and update formulas, if rigorously established, would make TSI practically useful for tracking topological changes in streaming or time-series data where absolute scale matters. The normalization step for cvTSI is intentional and does not undermine the entropy relation, contrary to the stress-test concern.
minor comments (2)
- The abstract asserts that fundamental properties, scaling behavior, invariance, and explicit update formulas are established, yet the provided text gives no indication of where the derivations appear (e.g., which section or proposition).
- Experimental claims rest on 'synthetic data and stochastic time series' whose generation procedures, barcode extraction methods, and quantitative comparison metrics are not described in the visible text.
Simulated Author's Rebuttal
We thank the referee for the positive assessment of the manuscript, the accurate summary of its contributions, and the recommendation of minor revision. The referee correctly identifies the algebraic link between cvTSI and the Rényi-2 collision probability as a key strength, along with the invariance and update formulas. No major comments appear in the report.
Circularity Check
No significant circularity identified
full rationale
The paper's central algebraic claim—that cvTSI equals an affine transformation of the collision probability ∑p_i²—follows immediately from the definition of cvTSI as the squared coefficient of variation of the lifetime vector after normalization (var(l)/mean(l)² = n∑p_i² − 1). This is an explicit identity derived from the variance formula and the change of variables p_i = l_i/S; it does not rely on fitting, self-citation, or any prior result that itself depends on the target relation. No other load-bearing steps in the provided abstract or description reduce by construction to their inputs. The derivation remains self-contained.
Axiom & Free-Parameter Ledger
axioms (1)
- domain assumption Persistence lifetimes admit a discrete probability distribution after normalization to unit sum.
Reference graph
Works this paper leans on
-
[1]
A Survey of Vectorization Methods in Topological Data Analysis
Dashti Ali et al. “A Survey of Vectorization Methods in Topological Data Analysis”. In:IEEE Trans- actions on Pattern Analysis and Machine Intelligence45.12 (Dec. 2023), pp. 14069–14080.issn: 1939-3539.doi:10.1109/TPAMI.2023.3308391.url:https://ieeexplore.ieee.org/abstract/ document/10235748
work page doi:10.1109/tpami.2023.3308391.url:https://ieeexplore.ieee.org/abstract/ 2023
-
[2]
Hirokazu Anai et al. “DTM-Based Filtrations”. en. In:Topological Data Analysis. Ed. by Nils A. Baas et al. Cham: Springer International Publishing, 2020, pp. 33–66.isbn: 978-3-030-43408-3.doi: 10.1007/978-3-030-43408-3_2
-
[3]
Persistent entropy for separating topo- logical features from noise in vietoris-rips complexes
Nieves Atienza, Rocio Gonzalez-Diaz, and Matteo Rucco. “Persistent entropy for separating topo- logical features from noise in vietoris-rips complexes”. en. In:Journal of Intelligent Information Systems52.3 (June 2019), pp. 637–655.issn: 1573-7675.doi:10.1007/s10844-017-0473-4.url: https://doi.org/10.1007/s10844-017-0473-4
-
[4]
On the stability of persistent entropy and new summary functions for topological data analysis
Nieves Atienza, Rocio Gonzalez-D´ ıaz, and Manuel Soriano-Trigueros. “On the stability of persistent entropy and new summary functions for topological data analysis”. In:Pattern Recognition107 (Nov. 2020), p. 107509.issn: 0031-3203.doi:10 . 1016 / j . patcog . 2020 . 107509.url:https : //www.sciencedirect.com/science/article/pii/S0031320320303125
2020
-
[5]
A Better Bound on the Variance
Rajendra Bhatia and Chandler Davis. “A Better Bound on the Variance”. In:The American Math- ematical Monthly107.4 (2000), pp. 353–357.issn: 0002-9890.doi:10.2307/2589180.url:https: //www.jstor.org/stable/2589180
-
[6]
Statistical Topological Data Analysis using Persistence Landscapes
Peter Bubenik. “Statistical Topological Data Analysis using Persistence Landscapes”. In:Journal of Machine Learning Research16.3 (2015), pp. 77–102.issn: 1533-7928.url:http://jmlr.org/ papers/v16/bubenik15a.html
2015
-
[7]
Robust Topological Inference: Distance To a Measure and Kernel Distance
Fr´ ed´ eric Chazal et al. “Robust Topological Inference: Distance To a Measure and Kernel Distance”. In:Journal of Machine Learning Research18.159 (2018), pp. 1–40.issn: 1533-7928.url:http : //jmlr.org/papers/v18/15-484.html
2018
-
[8]
Persistence Curves: A canonical framework for summarizing persistence diagrams
Yu-Min Chung and Austin Lawson. “Persistence Curves: A canonical framework for summarizing persistence diagrams”. en. In:Advances in Computational Mathematics48.1 (Jan. 2022), p. 6.issn: 1572-9044.doi:10.1007/s10444-021-09893-4.url:https://doi.org/10.1007/s10444- 021- 09893-4
work page doi:10.1007/s10444-021-09893-4.url:https://doi.org/10.1007/s10444- 2022
-
[9]
Stability of Persistence Diagrams
David Cohen-Steiner, Herbert Edelsbrunner, and John Harer. “Stability of Persistence Diagrams”. In:Discrete & Computational Geometry37.1 (2007), pp. 103–120.issn: 0179-5376.doi:10.1007/ s00454-006-1276-5.url:https://doi.org/10.1007/s00454-006-1276-5
-
[10]
Ioannis Diamantis. “The Shape of Data: Topology Meets Analytics A Practical Introduction to Topological Analytics and the Stability Index (TSI) in Business”. en. In: (2025). Preprint. arXiv: 2511.13503 [stat.ML]
arXiv 2025
-
[11]
Confidence sets for persistence diagrams
Brittany Terese Fasy et al. “Confidence sets for persistence diagrams”. In:The Annals of Statistics 42.6 (Dec. 2014), pp. 2301–2339.issn: 0090-5364, 2168-8966.doi:10.1214/14-AOS1252.url:https: //projecteuclid.org/journals/annals- of- statistics/volume- 42/issue- 6/Confidence- sets-for-persistence-diagrams/10.1214/14-AOS1252.full
-
[12]
Limit theorems for persistence diagrams
Yasuaki Hiraoka, Tomoyuki Shirai, and Khanh Duy Trinh. “Limit theorems for persistence diagrams”. In:The Annals of Applied Probability28.5 (Oct. 2018), pp. 2740–2780.issn: 1050-5164, 2168-8737. doi:10.1214/17-AAP1371.url:https://projecteuclid.org/journals/annals-of-applied- probability/volume-28/issue-5/Limit-theorems-for-persistence-diagrams/10.1214/17- ...
work page doi:10.1214/17-aap1371.url:https://projecteuclid.org/journals/annals-of-applied- 2018
-
[13]
D.H Lehmer. “On the compounding of certain means”. In:Journal of Mathematical Analysis and Applications36.1 (1971), pp. 183–200.issn: 0022-247X.doi:https://doi.org/10.1016/0022- 247X(71)90029-1.url:https://www.sciencedirect.com/science/article/pii/0022247X71900291. REFERENCES 31
-
[15]
Probability measures on the space of persistence diagrams
Yuriy Mileyko, Sayan Mukherjee, and John Harer. “Probability measures on the space of persistence diagrams”. en. In:Inverse Problems27.12 (Nov. 2011), p. 124007.issn: 0266-5611.doi:10.1088/ 0266-5611/27/12/124007.url:https://doi.org/10.1088/0266-5611/27/12/124007
-
[16]
On measures of entropy and information
Alfr´ ed R´ enyi. “On measures of entropy and information”. In:Proceedings of the Fourth Berkeley Symposium on Mathematical Statistics and Probability, Volume 1: Contributions to the Theory of Statistics. Berkeley, CA: University of California Press, 1961, pp. 547–561
1961
-
[17]
Hypothesis testing for topological data analysis
Andrew Robinson and Katharine Turner. “Hypothesis testing for topological data analysis”. en. In: Journal of Applied and Computational Topology1.2 (Dec. 2017), pp. 241–261.issn: 2367-1734.doi: 10.1007/s41468-017-0008-7.url:https://doi.org/10.1007/s41468-017-0008-7
work page doi:10.1007/s41468-017-0008-7.url:https://doi.org/10.1007/s41468-017-0008-7 2017
-
[18]
A Piecewise Rotation of the Circle, IPR Maps and Their Connection with Translation Surfaces
Matteo Rucco et al. “Characterisation of the Idiotypic Immune Network Through Persistent En- tropy”. en. In:Proceedings of ECCS 2014. Ed. by Stefano Battiston et al. Cham: Springer Interna- tional Publishing, 2016, pp. 117–128.isbn: 978-3-319-29228-1.doi:10.1007/978- 3- 319- 29228- 1_11
-
[19]
Walter de Gruyter GmbH & Co KG, 2014
Ren´ e L Schilling and Lothar Partzsch.Brownian motion: an introduction to stochastic processes. Walter de Gruyter GmbH & Co KG, 2014
2014
-
[20]
Topological Analysis of Recurrent Systems
Primoz Skraba, Vin de Silva, and Mikael Vejdemo-Johansson. “Topological Analysis of Recurrent Systems”. eng. In:NIPS 2012 Workshop on Algebraic Topology and Machine Learning. 2012, pp. 1– 5.url:https://urn.kb.se/resolve?urn=urn:nbn:se:kth:diva-107210
2012
-
[21]
Afra Zomorodian and Gunnar Carlsson. “Computing Persistent Homology”. en. In:Discrete & Com- putational Geometry33.2 (Feb. 2005), pp. 249–274.issn: 1432-0444.doi:10.1007/s00454- 004- 1146-y.url:https://doi.org/10.1007/s00454-004-1146-y. Department of Data Analytics and Digitalisation, Maastricht University, School of Business and Eco- nomics, P.O. Box 616...
discussion (0)
Sign in with ORCID, Apple, or X to comment. Anyone can read and Pith papers without signing in.