Detection of CO, H₂O, and OH in WASP-18b with JWST/NIRISS using Direct-Extracted Spectra and Cross-Correlation
Pith reviewed 2026-06-28 20:46 UTC · model grok-4.3
The pith
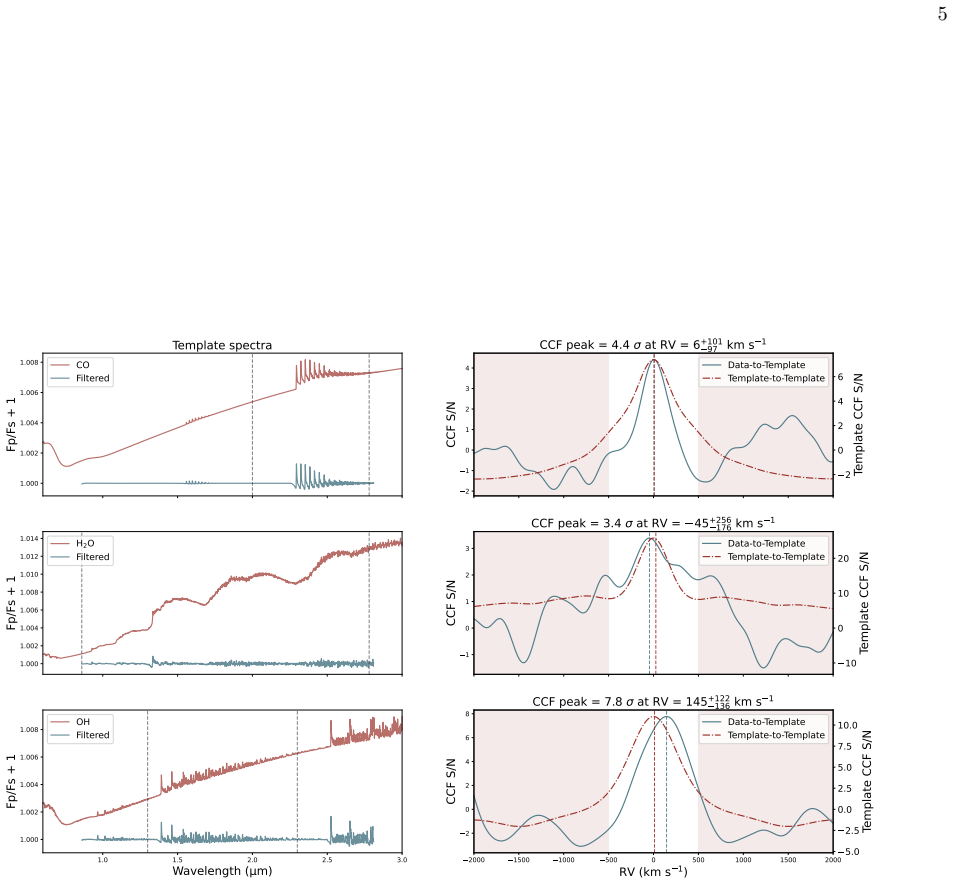
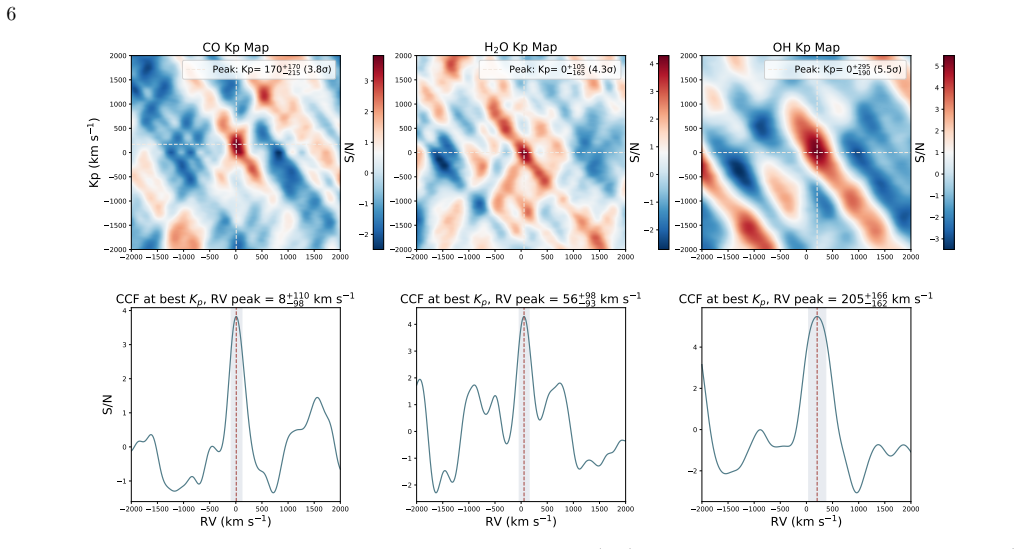
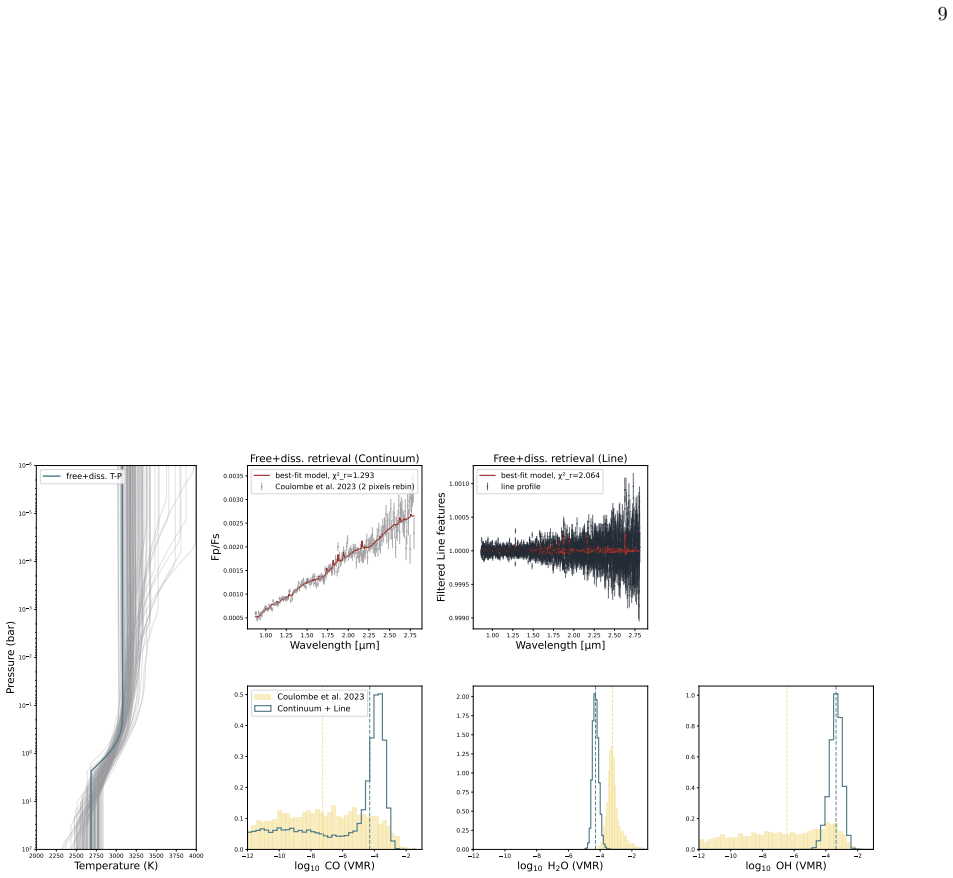
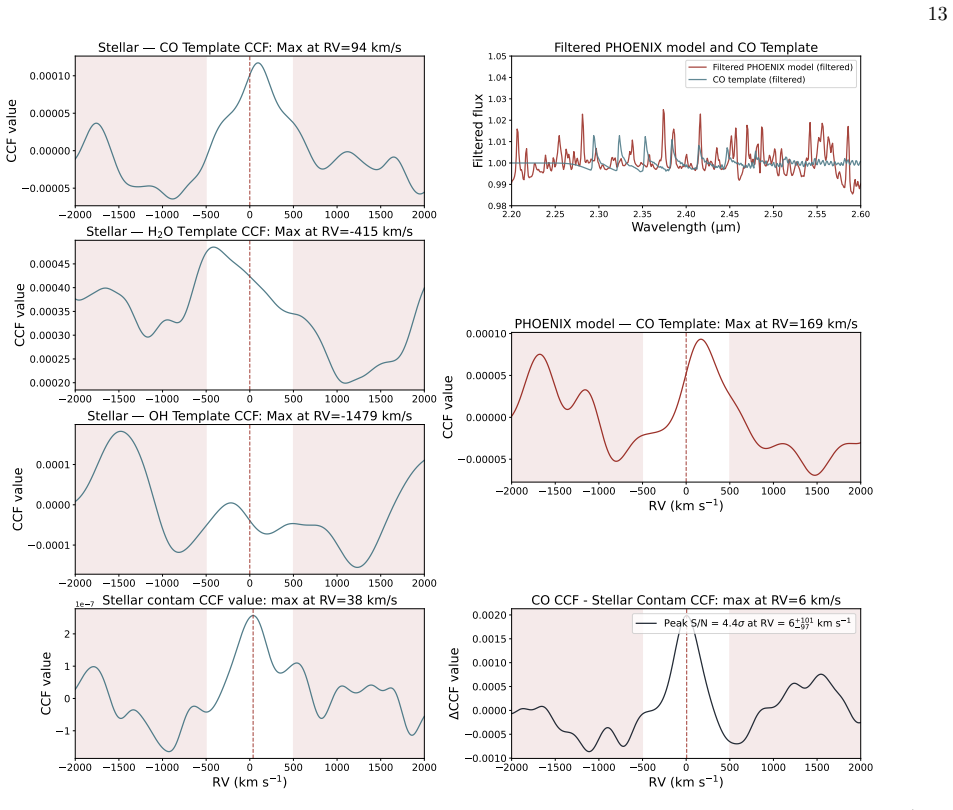
Direct extraction of JWST spectra detects CO, H2O and OH in WASP-18b at 4.4σ, 3.4σ and 7.8σ.
A machine-rendered reading of the paper's core claim, the machinery that carries it, and where it could break.
Core claim
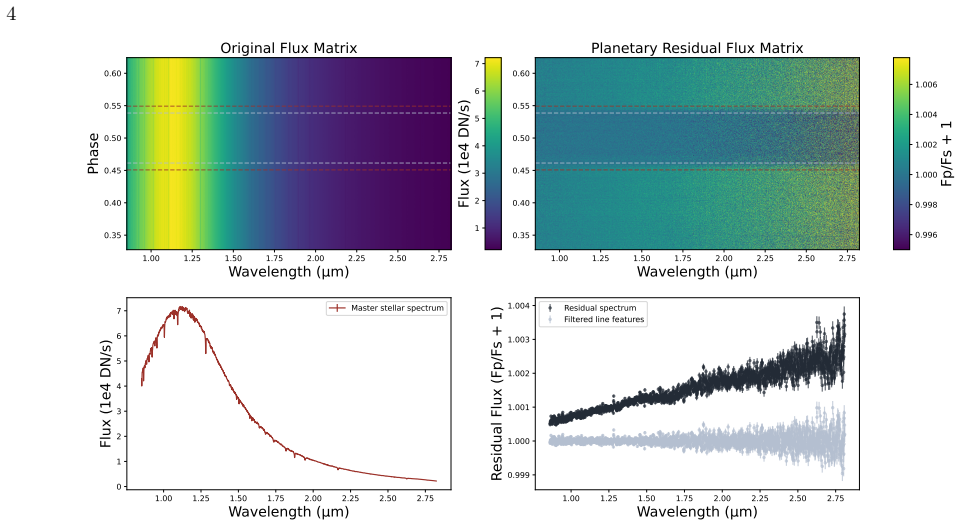
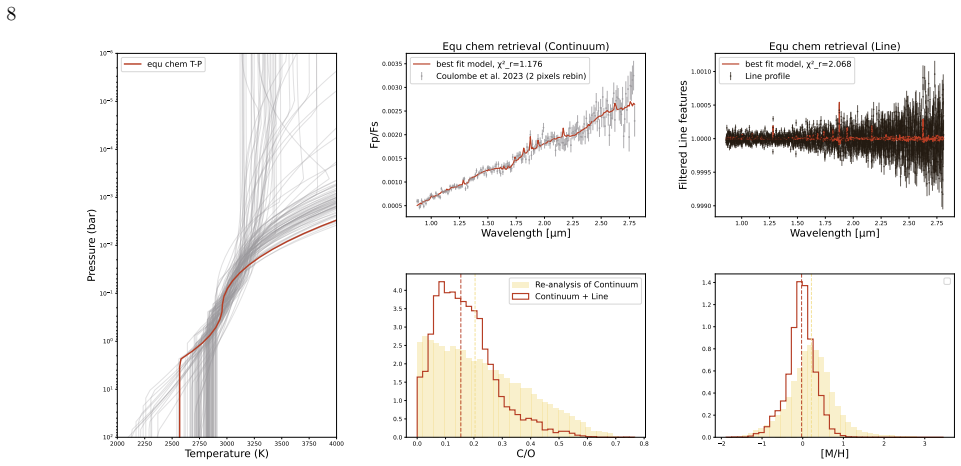
Applying direct extraction to the WASP-18b NIRISS/SOSS dataset preserves native instrumental resolution and enables cross-correlation, resulting in detections of CO at 4.4σ, H2O at 3.4σ and OH at 7.8σ; these signals then produce tighter posterior constraints on atmospheric abundances than previous reductions of the same data.
What carries the argument
Direct extraction method that retains pixel-level spectral information at native resolution for subsequent cross-correlation.
If this is right
- Cross-correlation becomes a standard tool for extracting molecular signals from medium-resolution JWST transit spectra.
- Atmospheric retrievals on the same data return narrower abundance posteriors once the new detections are included.
- Archival JWST observations can be revisited to build a more complete census of planetary atmospheric chemistry.
- Planetary metallicity and C/O ratio can be constrained more precisely from existing datasets.
Where Pith is reading between the lines
- The same direct-extraction plus cross-correlation pipeline could be tested on other JWST NIRISS or NIRSpec datasets where molecular signals were previously marginal.
- If the method scales, it may reduce the need for new observations to confirm certain species in hot-Jupiter atmospheres.
Load-bearing premise
The direct extraction step does not create spurious features that could mimic real molecular cross-correlation signals.
What would settle it
Re-reduction of the same WASP-18b NIRISS dataset with an independent extraction pipeline that yields no CO or OH cross-correlation peaks above 3σ.
Figures
read the original abstract
The James Webb Space Telescope (JWST) has revolutionized the characterization of exoplanetary atmospheres, offering unprecedented sensitivity to probe their chemical and physical properties. Recently, a growing trend has emerged to obtain atmospheric information directly from pixel-level planetary spectra. In this work, we re-analyzed the WASP-18b NIRISS/SOSS dataset by employing a direct extraction method. This new method preserves the spectral information at the native instrumental resolution, thereby enabling the application of cross-correlation techniques and providing atmospheric retrievals with enhanced precision and richer information content. With this methodology, we report detections of CO at $4.4\sigma$ significance, H$_2$O at $3.4\sigma$, and OH at $7.8\sigma$, where CO and OH were previously unseen. Building on these unambiguous detections, our subsequent retrieval analysis significantly improves the constraints on atmospheric abundances. Our results demonstrate that the cross-correlation technique effectively extracts molecular signals from medium-resolution JWST data, enhancing detection sensitivity. By revisiting JWST archival data with cross-correlation and retrieval analysis, we can achieve a more comprehensive survey of planetary atmospheric chemistry, thereby placing precise constraints on key parameters such as planetary metallicity and C/O ratio.
Editorial analysis
A structured set of objections, weighed in public.
Referee Report
Summary. The paper re-analyzes JWST/NIRISS/SOSS transit observations of WASP-18b with a direct-extraction pipeline that preserves native instrumental resolution. This enables cross-correlation function (CCF) analysis, yielding reported detections of CO at 4.4σ, H₂O at 3.4σ, and OH at 7.8σ (with CO and OH previously undetected), followed by atmospheric retrievals that tighten abundance constraints and improve constraints on metallicity and C/O ratio.
Significance. If the direct-extraction pipeline is shown to be free of template-correlated systematics, the work would demonstrate that CCF techniques can be applied productively to medium-resolution JWST data, recovering additional molecular species and sharpening retrieval posteriors on key atmospheric parameters.
major comments (2)
- [Abstract] Abstract (methodology paragraph): The central claim that the direct extraction 'preserves the spectral information at the native instrumental resolution' without generating artifacts that could produce false-positive CCF signals is load-bearing for the reported 4.4σ, 3.4σ, and 7.8σ detections. No quantitative null tests, injection-recovery statistics, or residual-fringing assessments against the CO/H₂O/OH templates are described.
- [Abstract] Abstract: The detection significances are stated without accompanying details on template construction, CCF normalization, or the precise definition of the noise model used to convert peak values to σ levels, preventing assessment of whether the quoted values are robust to post-hoc choices.
Simulated Author's Rebuttal
We thank the referee for their thoughtful review and constructive comments on our manuscript. We address each major comment below with clarifications from the full text and indicate where revisions will be made to improve clarity, particularly in the abstract.
read point-by-point responses
-
Referee: [Abstract] Abstract (methodology paragraph): The central claim that the direct extraction 'preserves the spectral information at the native instrumental resolution' without generating artifacts that could produce false-positive CCF signals is load-bearing for the reported 4.4σ, 3.4σ, and 7.8σ detections. No quantitative null tests, injection-recovery statistics, or residual-fringing assessments against the CO/H₂O/OH templates are described.
Authors: The full manuscript details the direct-extraction pipeline in Section 2 and presents quantitative validation in Section 4, including null tests (shuffled wavelength channels yielding no significant peaks), injection-recovery statistics (recovering injected signals at >3σ across the parameter space), and residual-fringing assessments (via comparison of extracted spectra before/after fringing correction against the molecular templates). These tests are shown in Figures 5–7. While the abstract does not summarize them, the claim is supported in the body. We will revise the abstract to include a brief clause referencing these validations. revision: partial
-
Referee: [Abstract] Abstract: The detection significances are stated without accompanying details on template construction, CCF normalization, or the precise definition of the noise model used to convert peak values to σ levels, preventing assessment of whether the quoted values are robust to post-hoc choices.
Authors: Template construction (using line lists from ExoMol and HITEMP with petitRADTRANS at native resolution), CCF normalization (subtracting the median and dividing by the standard deviation in the off-peak regions), and the noise model (empirical distribution from 1000 randomized template shifts, with σ defined as the peak value relative to the 1σ width of the null distribution) are fully specified in Sections 3.2–3.3. The quoted significances follow this procedure without post-hoc tuning. We agree the abstract would benefit from a short parenthetical note on the significance methodology and will add one. revision: yes
Circularity Check
No significant circularity in observational detection claims
full rationale
The paper reports molecular detections via cross-correlation of directly extracted JWST spectra against external template spectra. The significances are computed from standard CCF statistics on the observed data; they do not reduce by construction to any fitted parameter or self-defined quantity within the same dataset. No self-citation chains, uniqueness theorems, or ansatzes are invoked as load-bearing premises. The retrieval step is a subsequent analysis that uses the detections rather than re-deriving them tautologically. This is the expected non-finding for an observational pipeline anchored to external templates and instrument data.
Axiom & Free-Parameter Ledger
axioms (1)
- domain assumption Direct extraction from pixel-level data preserves native spectral resolution without introducing spurious features that mimic molecular cross-correlation signals.
Reference graph
Works this paper leans on
-
[1]
Ahrer, E.-M., Stevenson, K. B., Mansfield, M., et al. 2023, Nature, 614, 653, doi: 10.1038/s41586-022-05590-4
-
[2]
2023, PASP, 135, 075001, doi: 10.1088/1538-3873/acd7a3
Albert, L., Lafreni` ere, D., Ren´ e, D., et al. 2023, PASP, 135, 075001, doi: 10.1088/1538-3873/acd7a3
-
[3]
Alderson, L., Wakeford, H. R., Alam, M. K., et al. 2023, Nature, 614, 664, doi: 10.1038/s41586-022-05591-3 Astropy Collaboration, Robitaille, T. P., Tollerud, E. J., et al. 2013, A&A, 558, A33, doi: 10.1051/0004-6361/201322068 Astropy Collaboration, Price-Whelan, A. M., Sip˝ ocz, B. M., et al. 2018, AJ, 156, 123, doi: 10.3847/1538-3881/aabc4f Astropy Coll...
-
[4]
2024, arXiv e-prints, arXiv:2403.03325, doi: 10.48550/arXiv.2403.03325
Benneke, B., Roy, P.-A., Coulombe, L.-P., et al. 2024, arXiv e-prints, arXiv:2403.03325, doi: 10.48550/arXiv.2403.03325
-
[5]
Bernath, P. F. 2020, JQSRT, 240, 106687, doi: 10.1016/j.jqsrt.2019.106687
-
[6]
2024, The Journal of Open Source Software, 9, 7028, doi: 10.21105/joss.07028
Blain, D., Molli` ere, P., & Nasedkin, E. 2024, The Journal of Open Source Software, 9, 7028, doi: 10.21105/joss.07028
-
[7]
Brogi, M., Emeka-Okafor, V., Line, M. R., et al. 2023, AJ, 165, 91, doi: 10.3847/1538-3881/acaf5c
-
[8]
C., Weiner Mansfield, M., Cubillos, P
Challener, R. C., Weiner Mansfield, M., Cubillos, P. E., et al. 2025, arXiv e-prints, arXiv:2510.24708, doi: 10.48550/arXiv.2510.24708
-
[9]
Cont, D., Yan, F., Reiners, A., et al. 2022, A&A, 668, A53, doi: 10.1051/0004-6361/202244277 16 T able 1.The priors and posteriors of all parameters from our retrievals. Parameter Prior Posterior (Equilibrium Chemistry) Posterior (Free Chemistry) Tset (K)U[2,000,4,000] 2772 +79 −363 2678+91 −126 logP 1 (bar)U[−6,2]−4.11 +0.96 −0.69 −2.08+0.83 −1.64 logP 2...
-
[10]
2023, Nature, 620, 292, doi: 10.1038/s41586-023-06230-1
Coulombe, L.-P., Benneke, B., Challener, R., et al. 2023, Nature, 620, 292, doi: 10.1038/s41586-023-06230-1
-
[11]
P., et al
Czesla, S., Schr¨ oter, S., Schneider, C. P., et al. 2019, PyA: Python astronomy-related packages,, Astrophysics Source Code Library, record ascl:1906.010 http://ascl.net/1906.010
2019
-
[12]
Doyon, R., Willott, C. J., Hutchings, J. B., et al. 2023, PASP, 135, 098001, doi: 10.1088/1538-3873/acd41b
-
[13]
Esparza-Borges, E., L´ opez-Morales, M., Adams Redai, J. I., et al. 2023, ApJL, 955, L19, doi: 10.3847/2041-8213/acf27b
-
[14]
2025, MNRAS, 543, 3456, doi: 10.1093/mnras/staf1659
Esparza-Borges, E., L´ opez-Morales, M., Pall´ e, E., et al. 2025, MNRAS, 543, 3456, doi: 10.1093/mnras/staf1659
-
[15]
Espinoza, N., & Perrin, M. D. 2025, arXiv e-prints, arXiv:2505.20520, doi: 10.48550/arXiv.2505.20520 17 T able 2.The comparison of key parameters posteriors from this work and previous works. Parameter This work L.-P. Coulombe et al. (2023) a M. Brogi et al. (2023) b C/O 0.15 +0.11 −0.09 0.20+0.20 −0.14 <0.34 [M/H]−0.03 +0.30 −0.32 0.21+0.50 −0.52 0.48+0....
-
[16]
Evans-Soma, T. M., Sing, D. K., Barstow, J. K., et al. 2025, Nature Astronomy, 9, 845, doi: 10.1038/s41550-025-02513-x
-
[17]
D., Radica, M., Welbanks, L., et al
Feinstein, A. D., Radica, M., Welbanks, L., et al. 2023, Nature, 614, 670, doi: 10.1038/s41586-022-05674-1
-
[18]
Gapp, C., Evans-Soma, T. M., Barstow, J. K., et al. 2025, AJ, 169, 341, doi: 10.3847/1538-3881/ad9c6e
-
[19]
Grant, D., Lewis, N. K., Wakeford, H. R., et al. 2023, ApJL, 956, L32, doi: 10.3847/2041-8213/acfc3b10.3847/2041-8213/acfdab
work page doi:10.3847/2041-8213/acfc3b10.3847/2041-8213/acfdab 2023
-
[20]
Gray, D. F. 2008, The Observation and Analysis of Stellar Photospheres
2008
-
[21]
Gressier, A., Batalha, N. E., Wogan, N., et al. 2025, AJ, 170, 292, doi: 10.3847/1538-3881/ae0929
-
[22]
Harris, G. J., Tennyson, J., Kaminsky, B. M., Pavlenko, Y. V., & Jones, H. R. A. 2006, MNRAS, 367, 400, doi: 10.1111/j.1365-2966.2005.09960.x
-
[23]
R., Collier Cameron, A., et al
Hellier, C., Anderson, D. R., Collier Cameron, A., et al. 2009, Nature, 460, 1098, doi: 10.1038/nature08245
-
[24]
O., Wende-von Berg, S., Dreizler, S., et al
Husser, T.-O., Wende-von Berg, S., Dreizler, S., et al. 2013, A&A, 553, A6, doi: 10.1051/0004-6361/201219058
work page internal anchor Pith review doi:10.1051/0004-6361/201219058 2013
-
[25]
Inglis, J., Batalha, N. E., Lewis, N. K., et al. 2024, ApJL, 973, L41, doi: 10.3847/2041-8213/ad725e
-
[26]
2025, arXiv e-prints, arXiv:2506.05392, doi: 10.48550/arXiv.2506.05392
Kipping, D., & Benneke, B. 2025, arXiv e-prints, arXiv:2506.05392, doi: 10.48550/arXiv.2506.05392
-
[27]
Kitzmann, D., Stock, J. W., & Patzer, A. B. C. 2024, MNRAS, 527, 7263, doi: 10.1093/mnras/stad3515
-
[28]
2025, arXiv e-prints, arXiv:2505.20588, doi: 10.48550/arXiv.2505.20588
Krishnamurthy, V., Carteret, Y., Piaulet-Ghorayeb, C., et al. 2025, arXiv e-prints, arXiv:2505.20588, doi: 10.48550/arXiv.2505.20588
-
[29]
Kurucz, R. L. 2018, in Astronomical Society of the Pacific Conference Series, Vol. 515, Workshop on Astrophysical Opacities, 47
2018
-
[30]
Lustig-Yaeger, J., Sotzen, K. S., Stevenson, K. B., et al. 2025, ApJL, 994, L4, doi: 10.3847/2041-8213/ae17ae
-
[31]
2009, ApJ, 707, 24, doi: 10.1088/0004-637X/707/1/24
Madhusudhan, N., & Seager, S. 2009, ApJ, 707, 24, doi: 10.1088/0004-637X/707/1/24
-
[32]
Maxted, P. F. L., Anderson, D. R., Doyle, A. P., et al. 2013, MNRAS, 428, 2645, doi: 10.1093/mnras/sts231 Molli` ere, P., Wardenier, J. P., van Boekel, R., et al. 2019, A&A, 627, A67, doi: 10.1051/0004-6361/201935470 ¨Oberg, K. I., Murray-Clay, R., & Bergin, E. A. 2011, ApJL, 743, L16, doi: 10.1088/2041-8205/743/1/L16
-
[33]
Parmentier, V., Line, M. R., Bean, J. L., et al. 2018, A&A, 617, A110, doi: 10.1051/0004-6361/201833059
-
[34]
2026, A&A, 706, A2, doi: 10.1051/0004-6361/202556985
Pelletier, S., Coulombe, L.-P., Splinter, J., et al. 2026, A&A, 706, A2, doi: 10.1051/0004-6361/202556985
-
[35]
2022, Research Notes of the American Astronomical Society, 6, 155, doi: 10.3847/2515-5172/ac8676
Isaacson, H., & Rice, M. 2022, Research Notes of the American Astronomical Society, 6, 155, doi: 10.3847/2515-5172/ac8676
-
[36]
Polyansky, O. L., Kyuberis, A. A., Zobov, N. F., et al. 2018, MNRAS, 480, 2597, doi: 10.1093/mnras/sty1877
-
[37]
2024, The Journal of Open Source Software, 9, 6898, doi: 10.21105/joss.06898
Radica, M. 2024, The Journal of Open Source Software, 9, 6898, doi: 10.21105/joss.06898
-
[38]
2022, PASP, 134, 104502, doi: 10.1088/1538-3873/ac9430
Radica, M., Albert, L., Taylor, J., et al. 2022, PASP, 134, 104502, doi: 10.1088/1538-3873/ac9430
-
[39]
2023, MNRAS, 524, 835, doi: 10.1093/mnras/stad1762
Radica, M., Welbanks, L., Espinoza, N., et al. 2023, MNRAS, 524, 835, doi: 10.1093/mnras/stad1762
-
[40]
2023, PASP, 135, 048001, doi: 10.1088/1538-3873/acb293
Rigby, J., Perrin, M., McElwain, M., et al. 2023, PASP, 135, 048001, doi: 10.1088/1538-3873/acb293
-
[41]
2010, http://dx.doi.org/10.1016/j.jqsrt.2010.05.001 magenta Journal of Quant
Rothman, L. S., Gordon, I. E., Barber, R. J., et al. 2010, JQSRT, 111, 2139, doi: 10.1016/j.jqsrt.2010.05.001
-
[42]
2013, http://dx.doi.org/10.1016/j.jqsrt.2013.07.002 magenta Journal of Quant
Rothman, L. S., Gordon, I. E., Babikov, Y., et al. 2013, JQSRT, 130, 4, doi: 10.1016/j.jqsrt.2013.07.002
-
[43]
Rustamkulov, Z., Sing, D. K., Mukherjee, S., et al. 2023, Nature, 614, 659, doi: 10.1038/s41586-022-05677-y
-
[44]
Schleich, S., Boro Saikia, S., Changeˆ at, Q., et al. 2025, A&A, 704, A223, doi: 10.1051/0004-6361/202556553 18 Tset = 2677.95+90.84 126.44 Tset = 2772.43 +79.49 362.76 Tset log10 P1 log10 P2 log10 P3 1 2 C/O [M/H] AHS, cont Tset AHS, line 4.5 3.0 1.5 log10 P1 log10 P1 = 2.08+0.83 1.64 log10 P1 = -4.11 +0.96 0.69 log10 P1 4.5 3.0 1.5 0.0 log10 P2 log10 P2...
-
[45]
2004, in American Institute of Physics Conference Series, Vol
Skilling, J. 2004, in American Institute of Physics Conference Series, Vol. 735, Bayesian Inference and Maximum Entropy Methods in Science and Engineering: 24th International Workshop on Bayesian Inference and Maximum Entropy Methods in Science and Engineering, ed. R. Fischer, R. Preuss, & U. V. Toussaint (AIP), 395–405, doi: 10.1063/1.1835238
-
[46]
2010, Nature, 465, 1049, doi: 10.1038/nature09111
Albrecht, S. 2010, Nature, 465, 1049, doi: 10.1038/nature09111
-
[47]
Speagle, J. S. 2020, MNRAS, 493, 3132, doi: 10.1093/mnras/staa278
-
[48]
2023, MNRAS, 524, 817, doi: 10.1093/mnras/stad1547
Taylor, J., Radica, M., Welbanks, L., et al. 2023, MNRAS, 524, 817, doi: 10.1093/mnras/stad1547
-
[49]
Thorngren, D. P., Sing, D. K., & Mukherjee, S. 2025, arXiv e-prints, arXiv:2510.00169, doi: 10.48550/arXiv.2510.00169
-
[50]
Tsai, S.-M., Lee, E. K. H., Powell, D., et al. 2023, Nature, 617, 483, doi: 10.1038/s41586-023-05902-2
-
[51]
Virtanen, P., Gommers, R., Oliphant, T. E., et al. 2020, Nature Medicine, 17, 261, doi: 10.1038/s41592-019-0686-2 19 12 10 8 6 4 2 log10 VMR (H2O) 6 5 4 3 2 1 0 1 2 equ chem 12 10 8 6 4 2 log10 VMR (CO) 6 5 4 3 2 1 0 1 2 12 10 8 6 4 2 log10 VMR (CO2) 6 5 4 3 2 1 0 1 2 12 10 8 6 4 2 log10 VMR (HCN) 6 5 4 3 2 1 0 1 2 log10 Pressure (bar) 12 10 8 6 4 2 log10...
-
[52]
Welbanks, L., Nixon, M. C., McGill, P., et al. 2025, arXiv e-prints, arXiv:2504.21788, doi: 10.48550/arXiv.2504.21788
-
[53]
2022, A&A, 661, L6, doi: 10.1051/0004-6361/202243503
Yan, F., Pall´ e, E., Reiners, A., et al. 2022, A&A, 661, L6, doi: 10.1051/0004-6361/202243503
-
[54]
2023, A&A, 672, A107, doi: 10.1051/0004-6361/202245371
Yan, F., Nortmann, L., Reiners, A., et al. 2023, A&A, 672, A107, doi: 10.1051/0004-6361/202245371
-
[55]
Yurchenko, S. N., & Tennyson, J. 2014, MNRAS, 440, 1649, doi: 10.1093/mnras/stu326
-
[56]
Zhang, M., Beleznay, M., Brandt, T. D., et al. 2025, ApJL, 995, L64, doi: 10.3847/2041-8213/ae157c
discussion (0)
Sign in with ORCID, Apple, or X to comment. Anyone can read and Pith papers without signing in.