Samudra 2: Scaling Ocean Emulators across Resolutions
Pith reviewed 2026-06-29 23:30 UTC · model grok-4.3
The pith
Samudra 2 uses a wider U-Net and dynamic loss reweighting to scale ocean emulators to finer resolutions with stable multi-year rollouts.
A machine-rendered reading of the paper's core claim, the machinery that carries it, and where it could break.
Core claim
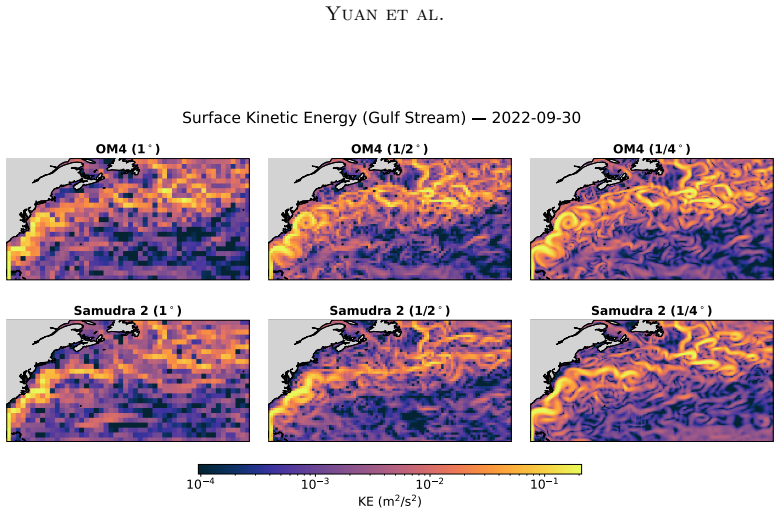
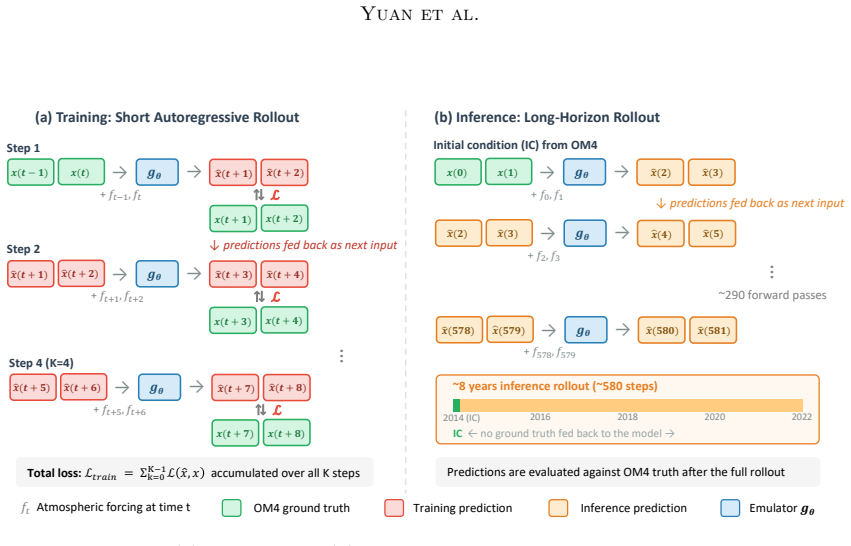
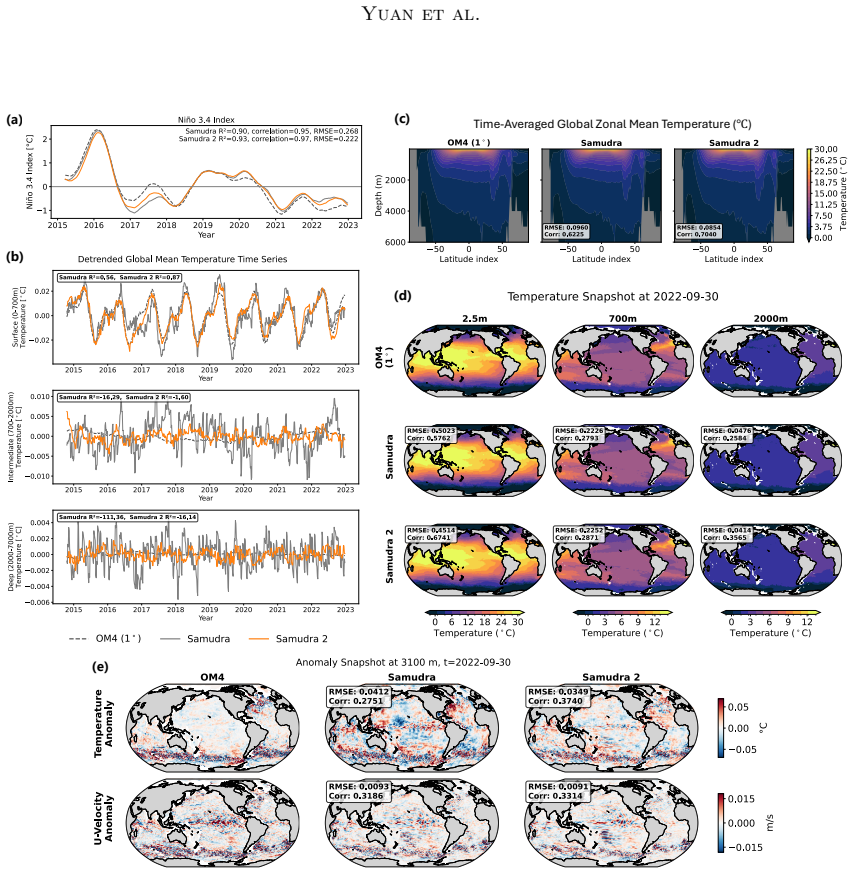
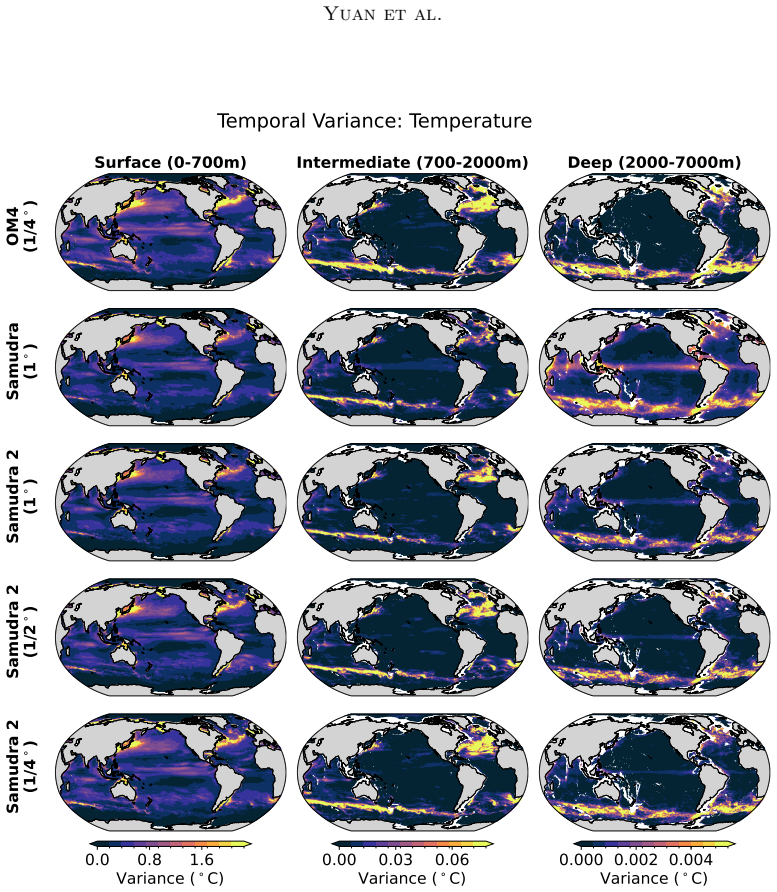
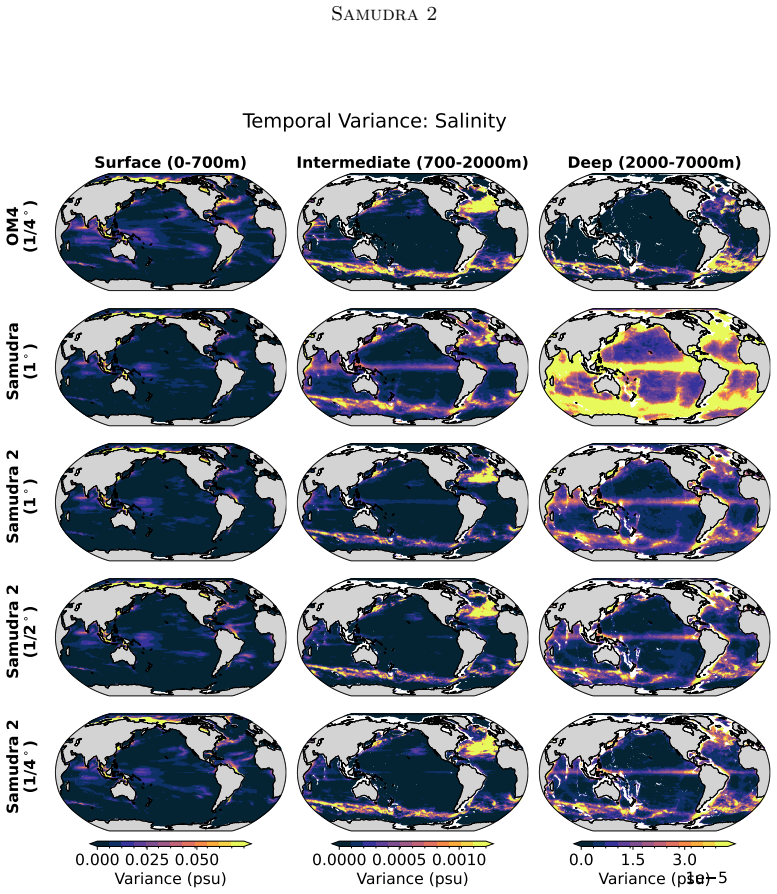
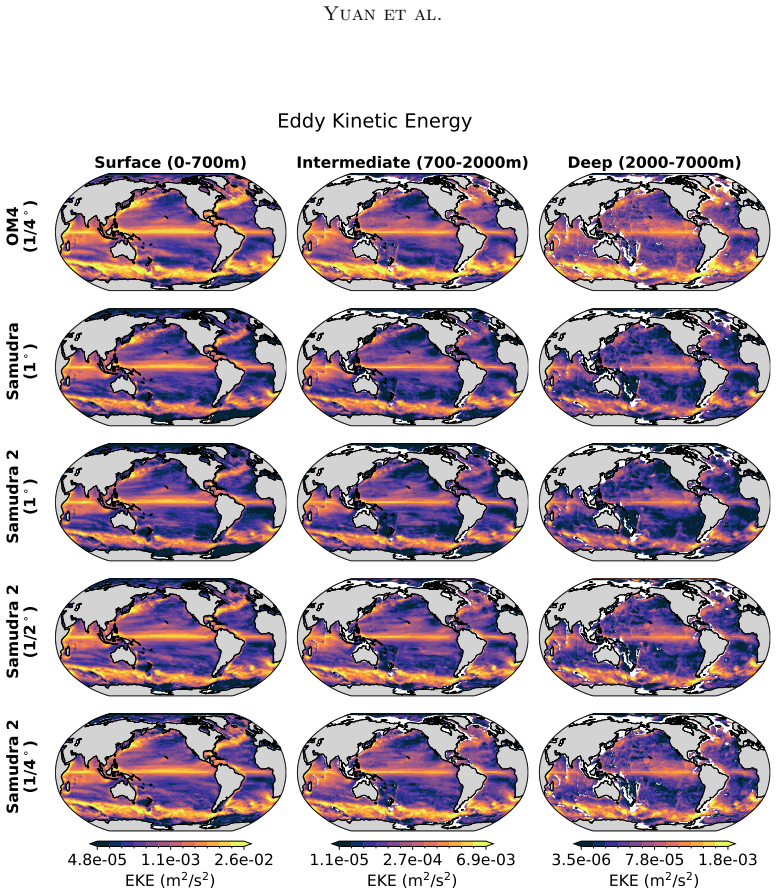
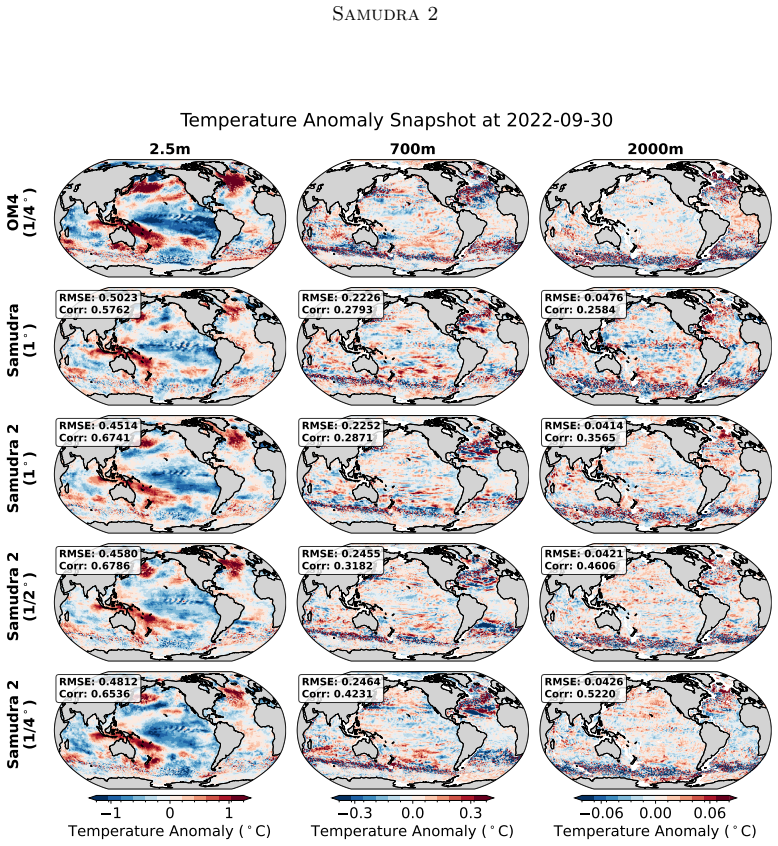
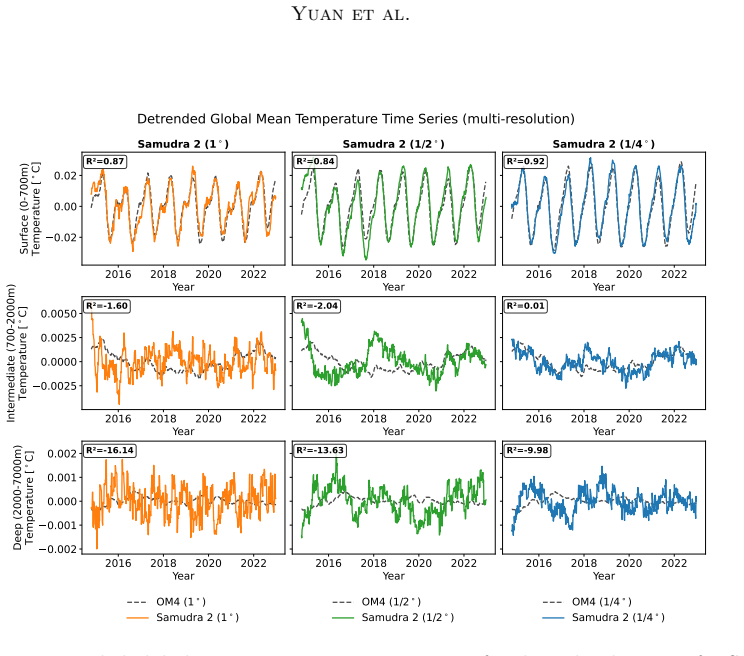
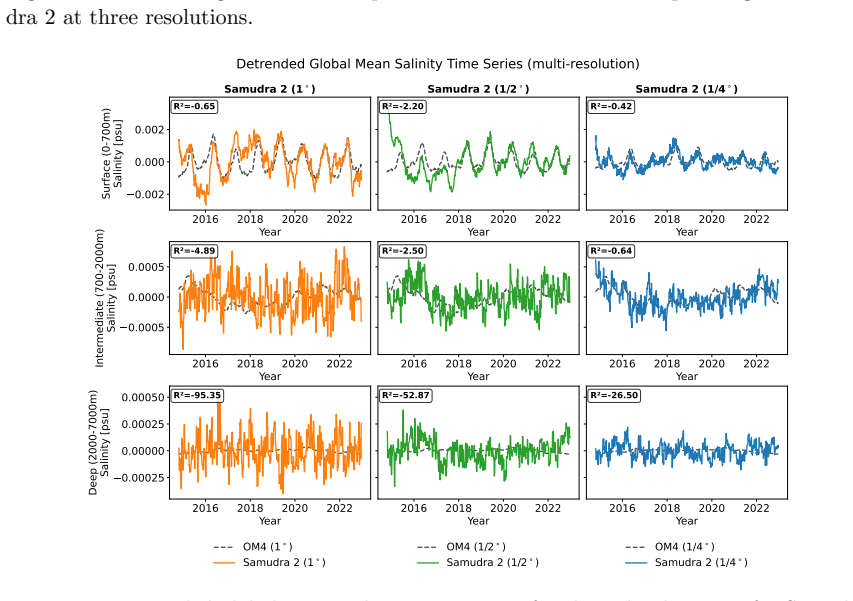
Samudra 2 demonstrates that a wider U-Net backbone with modified ConvNeXt-style blocks, reduced internal expansion factor, and dynamic loss reweighting that strengthens gradients for slow-evolving deep-ocean fields enables an autoregressive neural emulator to improve temperature predictions at 1° resolution and to scale stably to 1/2° and 1/4° resolutions, sustaining approximately 8-year global rollouts that recover mesoscale eddies and western boundary currents.
What carries the argument
Wider U-Net backbone with modified ConvNeXt-style blocks, reduced block-internal expansion factor, and dynamic loss reweighting that strengthens gradients for slow-evolving fields.
If this is right
- Single-GPU execution enables larger ensembles for sea-level projections, ocean heat uptake, and climate variability studies.
- The same architecture works across 1°, 1/2°, and 1/4° resolutions without resolution-specific retraining.
- Recovery of mesoscale eddies and sharp western boundary currents improves representation of ocean dynamics at finer grids.
- Stable multi-year rollouts become feasible for climate studies that previously required slower traditional models.
Where Pith is reading between the lines
- Faster emulation could lower the barrier to exploring many forcing scenarios in ensemble climate projections.
- Stable scaling across resolutions suggests the modifications may support even higher resolutions if additional compute is available.
- Public code and checkpoints allow direct testing on additional ocean variables or regional domains.
Load-bearing premise
The modifications to the U-Net backbone and the dynamic loss reweighting are the primary drivers of the accuracy gains and the ability to scale stably to finer resolutions.
What would settle it
An 8-year autoregressive rollout at 1/4° resolution that exhibits variance collapse or imprinting artifacts would show the scaling claim does not hold.
Figures
read the original abstract
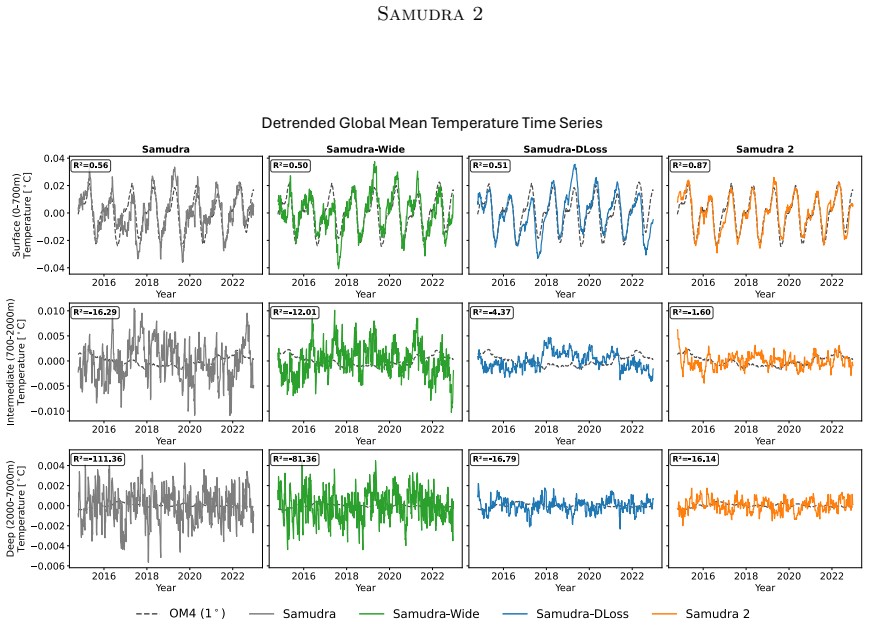
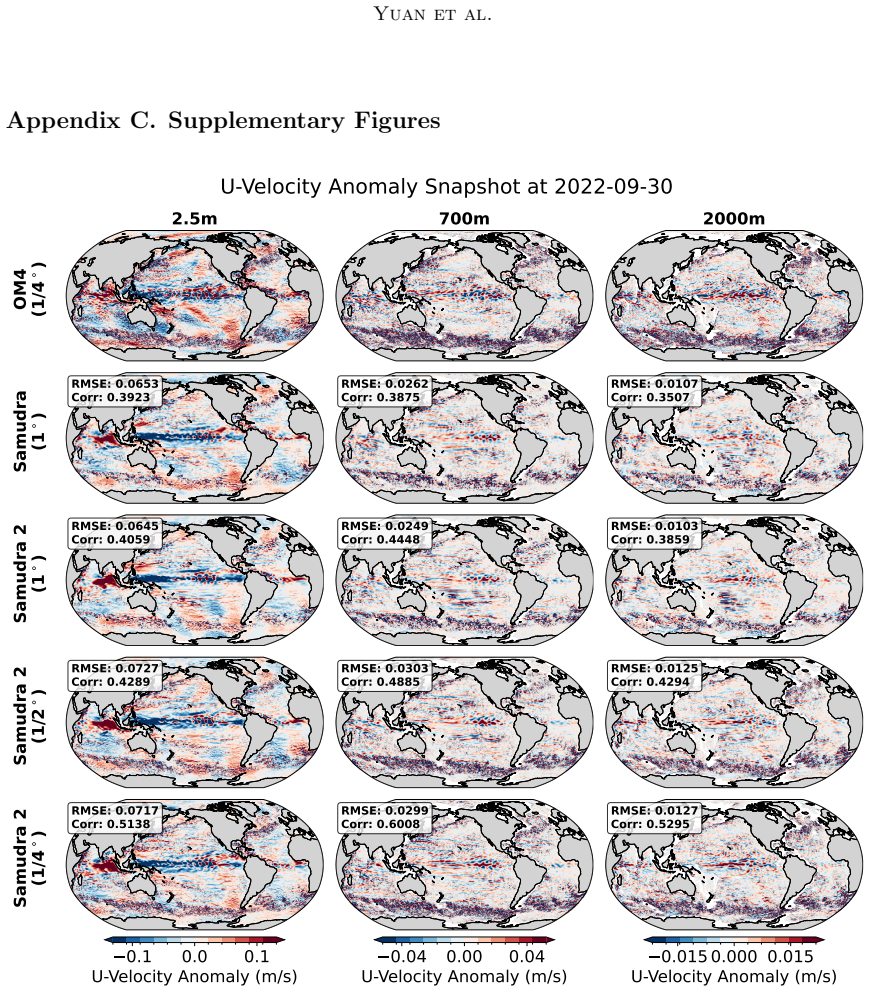
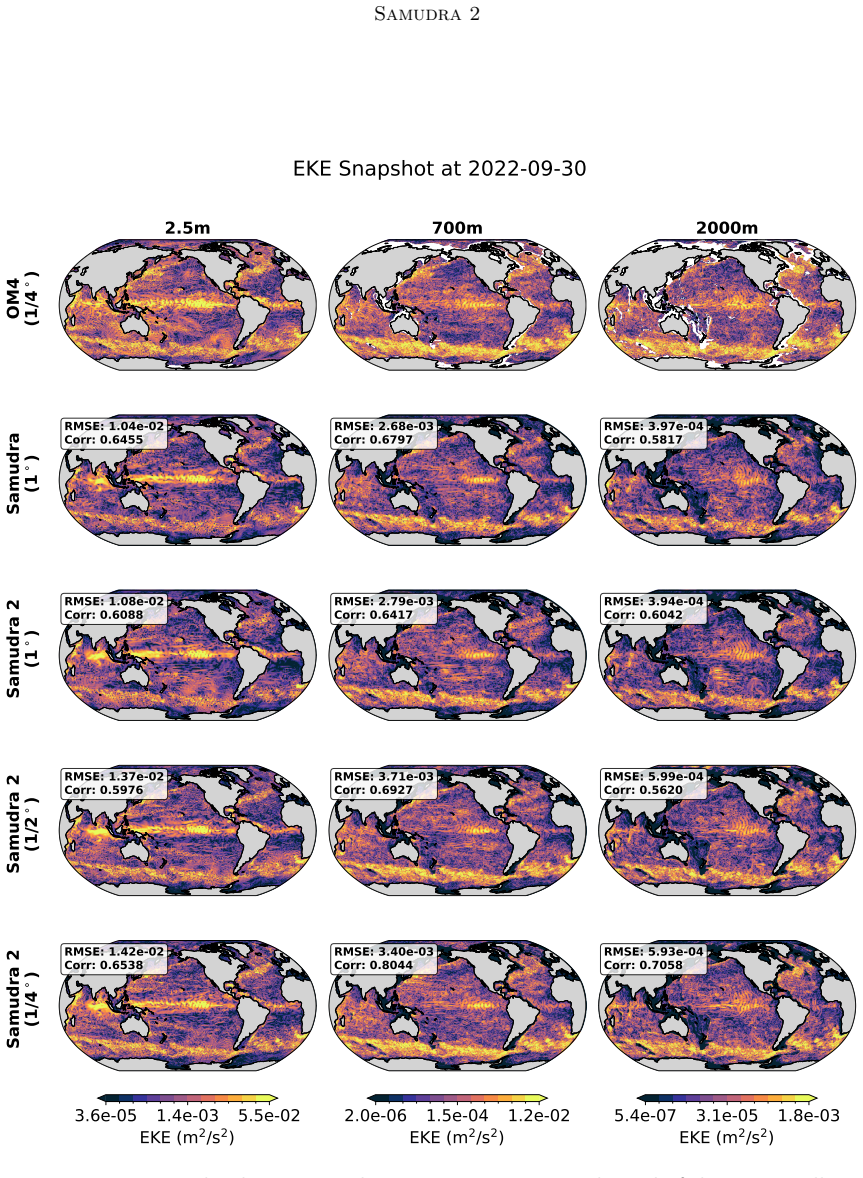
Ocean general circulation models (OGCMs) are essential to climate science but computationally expensive, limiting ensemble size and forcing scenarios. Neural emulators promise orders-of-magnitude speedups, yet existing ocean emulators have not combined fine spatial resolution with multi-year autoregressive rollouts. Samudra, the first autoregressive neural ocean emulator to produce multi-decade global rollouts, is limited to $1^\circ$ resolution and exhibits two long-horizon failure modes: \emph{variance collapse}, the loss of temporal variability, and \emph{imprinting artifacts}, in which velocity patterns leak into deep-ocean fields. We present Samudra 2, which introduces a wider U-Net backbone with modified ConvNeXt-style blocks and a reduced block-internal expansion factor, together with a dynamic loss that reweights output channels according to their prediction errors, strengthening gradients for slow-evolving deep-ocean fields. At $1^\circ$, Samudra 2 increases upper-ocean global-mean temperature $R^2$ from 0.56 to 0.87 and reduces deep-ocean temperature error by roughly sevenfold. The same architecture scales to $1/2^\circ$ and $1/4^\circ$ over approximately 8-year autoregressive rollouts, recovering mesoscale eddies and sharp western boundary currents. Running on a single GPU, Samudra 2 enables larger ensembles for sea-level projections, ocean heat uptake, and climate variability studies. All artifacts are publicly available: project page, code, checkpoints, documentation.
Editorial analysis
A structured set of objections, weighed in public.
Referee Report
Summary. The paper presents Samudra 2, an improved neural ocean emulator based on a wider U-Net backbone using modified ConvNeXt-style blocks with reduced expansion factor, plus a dynamic loss reweighting scheme that adjusts channel weights by prediction error. It claims this addresses variance collapse and imprinting, raising upper-ocean global-mean temperature R² from 0.56 to 0.87 at 1° while reducing deep-ocean temperature error by roughly sevenfold, and enabling stable scaling to ½° and ¼° resolutions over ~8-year autoregressive rollouts that recover mesoscale eddies and western boundary currents. All code, checkpoints, and documentation are released publicly.
Significance. If the quantitative gains and scaling behavior are confirmed, the work would be significant for climate applications by enabling single-GPU high-resolution ocean emulations that support larger ensembles for sea-level, heat uptake, and variability studies. The public release of artifacts is a clear strength that aids reproducibility and follow-on work.
major comments (2)
- [Results section] Results section: The central performance claims (R² increase from 0.56 to 0.87 and sevenfold deep-ocean error reduction at 1°) are reported without error bars, explicit training/validation splits, or controls for post-hoc tuning, which are required to substantiate the quantitative improvements over the prior Samudra model.
- [Methods and Results sections] Methods and Results sections: The manuscript attributes the gains and successful scaling to the wider U-Net (modified ConvNeXt blocks, reduced expansion factor) and dynamic loss reweighting, but supplies no ablation experiments isolating these changes from capacity increases or training schedule variations; this leaves the causal link to the listed modifications unverified and is load-bearing for the scaling claim.
minor comments (1)
- [Abstract] The abstract states 'approximately 8-year autoregressive rollouts' at finer resolutions; the main text should report the precise rollout lengths, ensemble sizes, and any resolution-specific training details for clarity.
Simulated Author's Rebuttal
Thank you for the referee's constructive comments. We address each major comment point by point below.
read point-by-point responses
-
Referee: [Results section] Results section: The central performance claims (R² increase from 0.56 to 0.87 and sevenfold deep-ocean error reduction at 1°) are reported without error bars, explicit training/validation splits, or controls for post-hoc tuning, which are required to substantiate the quantitative improvements over the prior Samudra model.
Authors: We agree that the quantitative claims would be strengthened by error bars, explicit split details, and tuning controls. The training/validation splits follow the protocol from the original Samudra paper and are described in Section 3, but we will expand this with a dedicated table for clarity. We will retrain with three random seeds to report means and standard deviations for the key R² and error metrics. We will also add a Methods paragraph detailing the hyperparameter search and validation-based selection process. These changes will be incorporated in the revision. revision: yes
-
Referee: [Methods and Results sections] Methods and Results sections: The manuscript attributes the gains and successful scaling to the wider U-Net (modified ConvNeXt blocks, reduced expansion factor) and dynamic loss reweighting, but supplies no ablation experiments isolating these changes from capacity increases or training schedule variations; this leaves the causal link to the listed modifications unverified and is load-bearing for the scaling claim.
Authors: We acknowledge that the lack of ablations leaves the individual contributions less isolated than ideal. The reported gains are shown via direct comparison to the prior Samudra baseline, which used a narrower architecture and static loss. In revision we will add targeted ablations at 1° resolution comparing (i) new backbone with original loss and (ii) original backbone with dynamic loss. Full factorial ablations across resolutions are computationally prohibitive, but these experiments will better support the attribution while we note the combined effect enables the observed scaling. revision: partial
Circularity Check
No circularity: empirical metrics are direct measurements on held-out data
full rationale
The paper reports measured R² values (0.56→0.87), error reductions, and rollout stability from training a modified U-Net on ocean simulation data and evaluating autoregressive performance on held-out periods. These quantities are obtained by direct comparison to reference OGCM output and do not reduce, by any equation or self-citation chain inside the paper, to quantities defined by the model's own fitted parameters or prior Samudra results. The reference to the original Samudra work supplies only baseline context and is not invoked to justify uniqueness or to derive the new performance numbers. No self-definitional, fitted-input-called-prediction, or ansatz-smuggling patterns appear in the derivation of the reported gains.
Axiom & Free-Parameter Ledger
Reference graph
Works this paper leans on
-
[1]
doi: 10.1029/2025MS004991. Early View. Boris Bonev, Thorsten Kurth, et al. FourCastNet 3: A geometric approach to probabilistic machine-learning weather forecasting at scale.arXiv preprint arXiv:2507.12144,
-
[2]
20 Samudra 2 Ashesh Chattopadhyay, Y
doi: 10.48550/arXiv.2507.12144. 20 Samudra 2 Ashesh Chattopadhyay, Y. Qiang Sun, and Pedram Hassanzadeh. Challenges of learning multi-scale dynamics with AI weather models: Implications for stability and one solution. arXiv preprint arXiv:2304.07029,
-
[3]
Zhao Chen, Vijay Badrinarayanan, Chen-Yu Lee, and Andrew Rabinovich
doi: 10.48550/arXiv.2304.07029. Zhao Chen, Vijay Badrinarayanan, Chen-Yu Lee, and Andrew Rabinovich. GradNorm: Gra- dient normalization for adaptive loss balancing in deep multitask networks. InProceedings of the 35th International Conference on Machine Learning (ICML), pages 794–803,
-
[4]
Surya Dheeshjith, Adam Subel, and others
doi: 10.1038/s41467-025-57389-2. Surya Dheeshjith, Adam Subel, and others. Transfer learning for emulating ocean climate variability across CO2 forcing.arXiv preprint arXiv:2405.18585,
-
[5]
doi: 10.1029/2024GL114318. James P. C. Duncan, Elynn Wu, et al. SamudrACE: Fast and accurate coupled climate modeling with 3D ocean and atmosphere emulators.arXiv preprint arXiv:2509.12490,
-
[6]
An evolving coupled model intercomparison project phase 7 (cmip7) and fast track in support of future climate assessment.EGUsphere, 2024:1–51,
John Patrick Dunne et al. An evolving coupled model intercomparison project phase 7 (cmip7) and fast track in support of future climate assessment.EGUsphere, 2024:1–51,
2024
-
[7]
Overview of the Coupled Model Intercomparison Project Phase 6 (CMIP6): Experimental design and organization.Geoscientific Model Development, 9(5):1937–1958,
Veronika Eyring, Sandrine Bony, et al. Overview of the Coupled Model Intercomparison Project Phase 6 (CMIP6): Experimental design and organization.Geoscientific Model Development, 9(5):1937–1958,
1937
-
[8]
Hugo Frezat, Julien Le Sommer, Ronan Fablet, Guillaume Balarac, and Redouane Lguen- sat
doi: 10.3389/fmars.2019.00065. Hugo Frezat, Julien Le Sommer, Ronan Fablet, Guillaume Balarac, and Redouane Lguen- sat. A posteriori learning for quasi-geostrophic turbulence parametrization.Journal of Advances in Modeling Earth Systems, 14(11):e2022MS003124,
-
[9]
doi: 10.1029/ 2022MS003124. Piyush Garg, Diana R. Gergel, Andrew E. Shao, and Galen J. Yacalis. The recipe matters more than the kitchen: Mathematical foundations of the AI weather prediction pipeline. arXiv preprint arXiv:2604.01215,
-
[10]
doi: 10.1016/j.jcp.2022.111090. Arthur P. Guillaumin and Laure Zanna. Stochastic-deep learning parameterization of ocean momentum forcing.Journal of Advances in Modeling Earth Systems, 13(9): e2021MS002534,
-
[11]
doi: 10.1029/2021MS002534. Zijie Guo, Pumeng Lyu, et al. Data-driven global ocean modeling for seasonal to decadal prediction.Science Advances, 11(33):eadu2488,
-
[12]
Mastering Diverse Domains through World Models
doi: 10.1126/sciadv.adu2488. Danijar Hafner, Jurgis Pasukonis, Jimmy Ba, and Timothy Lillicrap. Mastering diverse domains through world models.arXiv preprint arXiv:2301.04104,
work page internal anchor Pith review Pith/arXiv arXiv doi:10.1126/sciadv.adu2488
-
[13]
doi: 10.1016/j.ocemod.2013. 08.007. Yoo-Geun Ham, Jeong-Hwan Kim, and Jing-Jia Luo. Deep learning for multi-year ENSO forecasts.Nature, 573:568–572,
-
[14]
Forecasting global weather with graph neural networks.arXiv preprint arXiv:2202.07575,
Ryan Keisler. Forecasting global weather with graph neural networks.arXiv preprint arXiv:2202.07575,
-
[15]
Deep multi-scale video prediction beyond mean square error
doi: 10.1029/2024MS004883. Michael Mathieu, Camille Couprie, and Yann LeCun. Deep multi-scale video prediction beyond mean square error.arXiv preprint arXiv:1511.05440,
work page internal anchor Pith review Pith/arXiv arXiv doi:10.1029/2024ms004883
-
[16]
Jaideep Pathak, Shashank Subramanian, et al. FourCastNet: A global data-driven high- resolution weather forecasting model.arXiv preprint arXiv:2202.11214,
work page internal anchor Pith review Pith/arXiv arXiv
-
[17]
doi: 10.1029/2025GL117046. Boris T. Polyak and Anatoli B. Juditsky. Acceleration of stochastic approximation by averaging.SIAM Journal on Control and Optimization, 30(4):838–855,
-
[18]
Olaf Ronneberger, Philipp Fischer, and Thomas Brox
doi: 10.1038/s41586-021-03854-z. Olaf Ronneberger, Philipp Fischer, and Thomas Brox. U-net: Convolutional networks for biomedical image segmentation. InMedical Image Computing and Computer-Assisted Intervention (MICCAI), pages 234–241,
-
[19]
Shoaib Ahmed Siddiqui et al. Exploring the design space of deep-learning-based weather forecasting systems.arXiv preprint arXiv:2410.07472,
-
[20]
doi: 10.48550/arXiv.2410. 07472. Dmitry Ulyanov, Andrea Vedaldi, and Victor Lempitsky. Instance normalization: The missing ingredient for fast stylization.arXiv preprint arXiv:1607.08022,
work page internal anchor Pith review Pith/arXiv arXiv doi:10.48550/arxiv.2410
-
[21]
Guosong Wang, Min Hou, et al. Applications of deep learning parameterization of ocean momentum forcing.arXiv preprint arXiv:2406.03659,
-
[22]
doi: 10.48550/arXiv.2406. 03659. Sifan Wang, Yujun Teng, and Paris Perdikaris. Understanding and mitigating gradient flow pathologies in physics-informed neural networks.SIAM Journal on Scientific Computing, 43(5):A3055–A3081,
-
[23]
doi: 10.1137/20M1318043. 23 Yuan et al. Oliver Watt-Meyer, Gideon Dresdner, et al. ACE: A fast, skillful learned global atmospheric model for climate prediction.arXiv preprint arXiv:2310.02074,
-
[24]
Sergey Zagoruyko and Nikos Komodakis
doi: 10.1029/2023MS003915. Sergey Zagoruyko and Nikos Komodakis. Wide residual networks. InProceedings of the British Machine Vision Conference (BMVC),
-
[25]
doi: 10.5244/C.30.87. Laure Zanna and Thomas Bolton. Data-driven equation discovery of ocean mesoscale closures.Geophysical Research Letters, 47(17):e2020GL088376,
-
[26]
doi: 10.1093/nsr/ nwac044. 24 Samudra 2 Appendix A. Implementation Details This appendix summarizes implementation details, derived quantities, and evaluation met- rics. Unless otherwise noted, all quantities are computed on regular latitude-longitude grids after conservative regridding from the native OM4 tripolar output withxesmf. A.1 Training Setup and...
-
[27]
No weight decay or dropout is applied
over 70 epochs (no warmup), and gradient clipping at 1.0. No weight decay or dropout is applied. The final model is the last-epoch checkpoint rather than the one with the lowest validation loss, since single-step validation loss is not fully predictive of long-horizon rollout performance; in practice, we observed no significant overfitting over the 70-epo...
1992
-
[28]
These changes maintain training dynamics comparable to the 1◦ and 1/2◦ configurations
with instance norm (Ulyanov et al., 2016), accumulate gradients over 4 forward passes before each parameter update, and switch from float32 to bfloat16 to further reduce memory. These changes maintain training dynamics comparable to the 1◦ and 1/2◦ configurations. Training uses PyTorchDistributedDataParallelacross 8 A100 GPUs; Table 2 summarizes hardware ...
2016
-
[29]
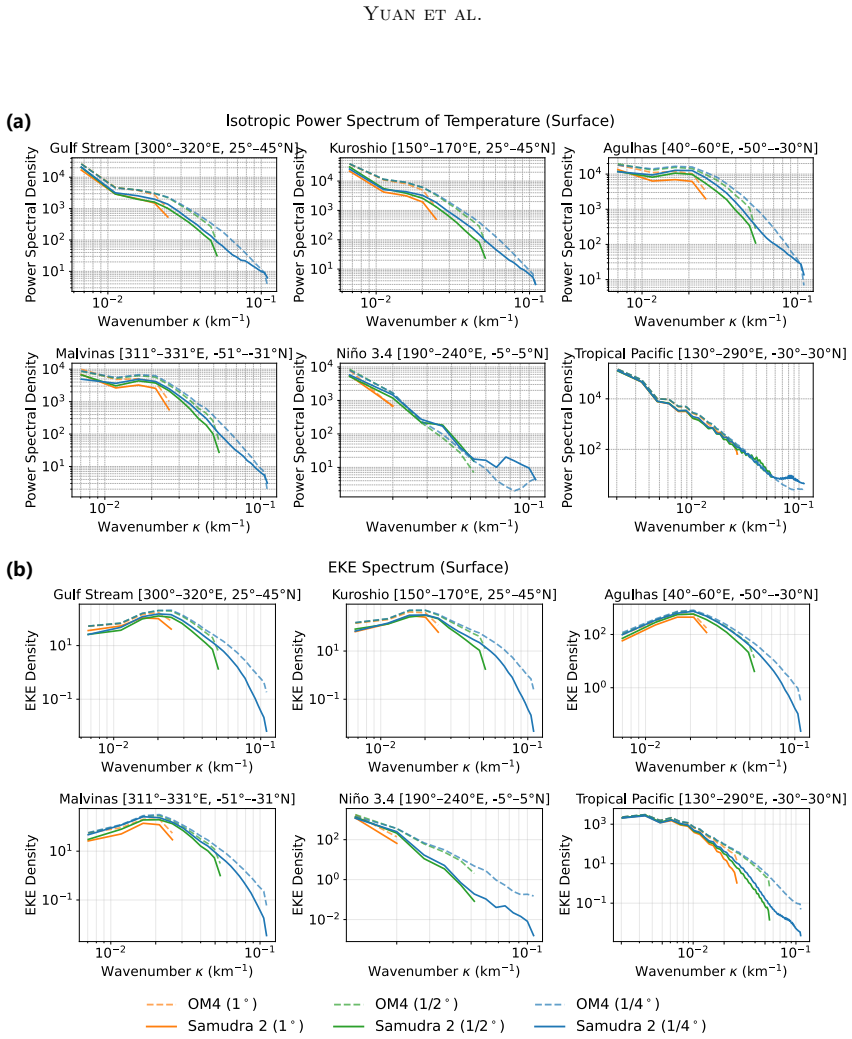
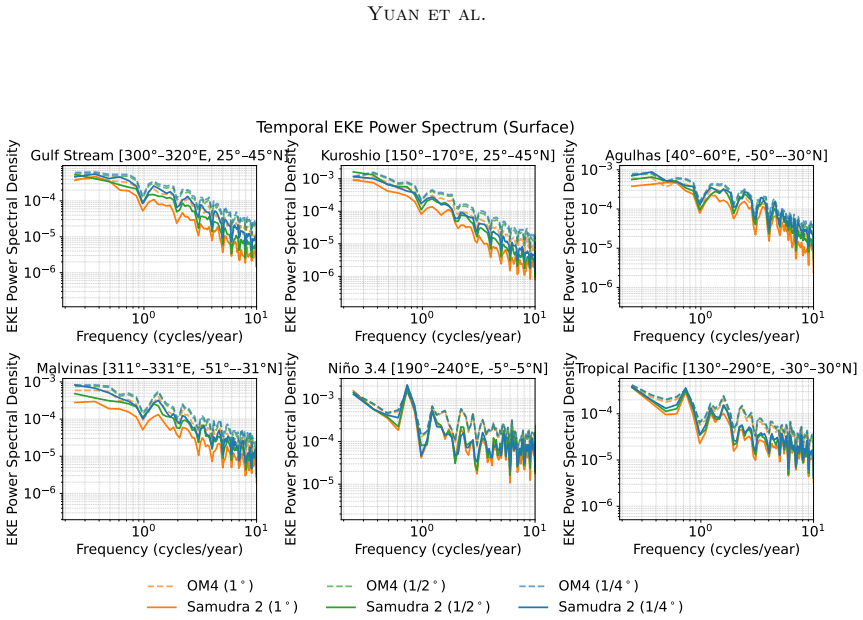
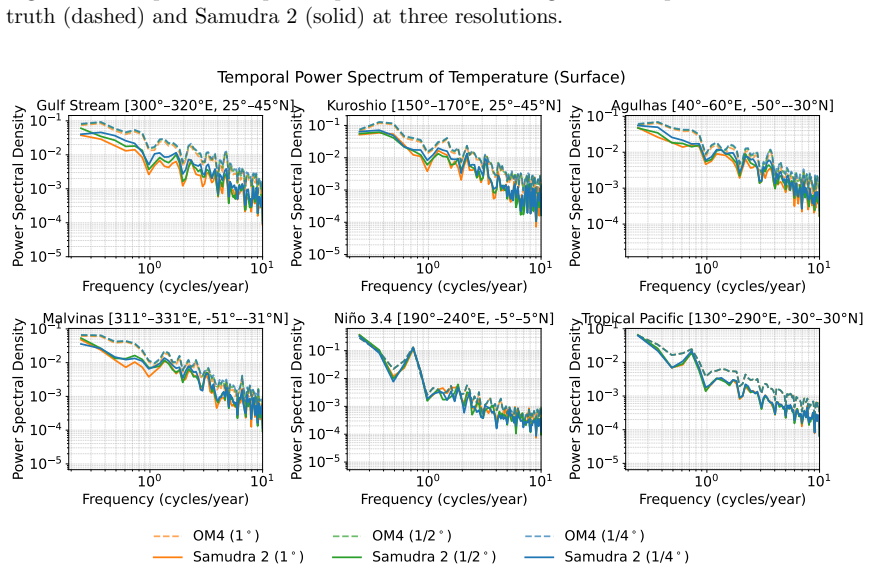
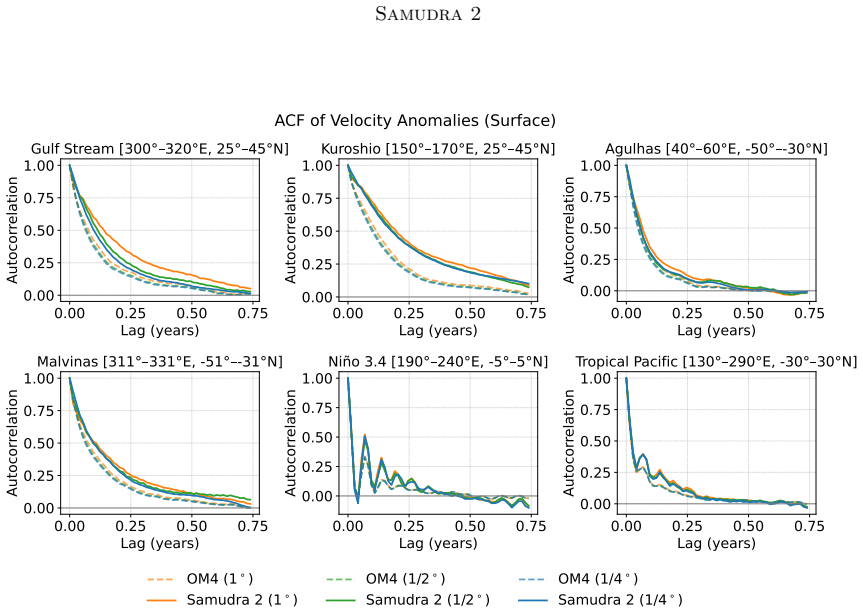
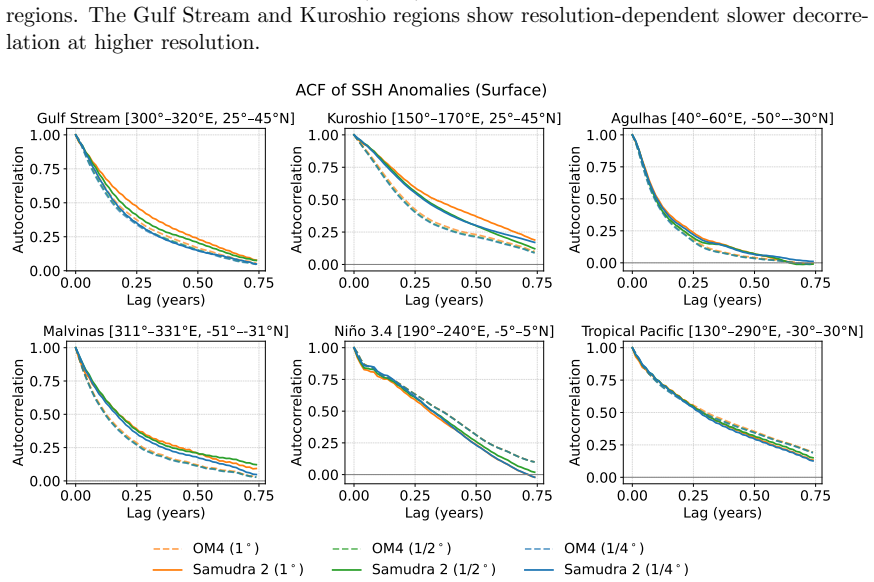
show a similar resolution dependence, with progressively finer spatial detail emerging at higher resolution. B.2 Spectral Analysis The isotropic temperature and EKE spatial spectra are presented in the main text (Fig- ure 9). Here we provide additional temporal spectra and autocorrelation diagnostics. The 28 Samudra 2 temporal EKE and temperature power sp...
discussion (0)
Sign in with ORCID, Apple, or X to comment. Anyone can read and Pith papers without signing in.