REVIEW 3 major objections 5 minor 28 references
Epidemiology of Model Collapse: Modeling Synthetic Data Contamination via Bilayer SIR Dynamics
T0 review · 3 major / 5 minor · reviewed 2026-07-12 · grok-4.5
Pith's one-line read AI data contamination behaves like an epidemic whose R0 is the geometric mean of data and model transmission rates; detection is the highest-leverage lever.
desk verdict Solid new-application paper: bilayer SIR/SIRS gives a clean geometric-mean R0 and intervention structure for ecosystem cross-contamination; GPT-2 work is only a qualitative single-chain bridge, not a test of the bilayer threshold. read the letter →
The pith
A machine-rendered reading of the paper's core claim, the machinery that carries it, and where it could break.
The reading
What carries the argument
The bilayer basic reproduction number R0 = sqrt(β_D β_M / [(γ_D + μ_D)(γ_M + μ_M)]), obtained by the Next Generation Matrix on the infected subsystem (I_D, I_M). Its geometric-mean structure encodes that a full contamination generation must traverse both layers, so interventions that raise either recovery rate or lower either transmission rate can drive the whole system subcritical.
What would settle it
Measure synthetic-text fractions and clean-retraining rates at ecosystem scale; if the resulting R0 estimate is stably below 1 while observed model quality and diversity continue to degrade under realistic mixed training, or if raising detection coverage fails to reduce measured contamination while other parameters stay fixed, the central claim fails.
Extended reading notes
Core claim
Synthetic-data cross-contamination in the AI ecosystem can be treated as a bilayer SIR/SIRS epidemic whose basic reproduction number is R0 = sqrt(β_D β_M / [(γ_D + μ_D)(γ_M + μ_M)]). Under three illustrative calibrations drawn from public AI-text prevalence data, R0 > 1; Sobol analysis identifies data detection γ_D as the highest-leverage parameter; and GPT-2 chains exhibit dose-response quality and diversity loss qualitatively consistent with the supercritical/near-critical regime.
Load-bearing premise
That continuous contamination levels can be split into binary clean/contaminated/recovered compartments by a fixed quality threshold without changing the qualitative threshold structure or the ranking of interventions.
Editorial analysis
A structured set of objections, weighed in public.
Referee Report
Summary. The paper proposes a bilayer coupled SIR/SIRS mean-field model of synthetic-data contamination in the AI ecosystem, treating data corpora and models as two interacting populations with cross-layer transmission. It derives R0 = sqrt(β_D β_M / [(γ_D+μ_D)(γ_M+μ_M)]) via the Next Generation Matrix, establishes standard DFE stability, endemic existence, and transcritical bifurcation results, and recommends the SIRS variant for immunity waning. Illustrative scenario calibrations from public AI-text prevalence data yield R0 > 1; Sobol analysis ranks data detection γ_D highest-leverage. An ABM on bipartite networks checks mean-field consistency for dense graphs. GPT-2 contamination chains (192 runs) show dose-response perplexity and diversity degradation; matched-budget multi-source experiments (1,088 runs) give borderline attenuation at α=1 that vanishes at α=0.5. Intervention analysis, under model assumptions, favors detection/filtering and herd immunity.
Significance. If the framing holds, the paper supplies a usable epidemic vocabulary (R0, herd immunity, cross-layer leverage) for ecosystem-level synthetic-data contamination, going beyond single-chain model-collapse analyses. Strengths include a clean, algebraically correct NGM derivation with explicit cancellation of cross-population ratios; numerical verification of threshold/bifurcation claims on large random ensembles; transparent labeling of calibration as illustrative; an ABM consistency check with quantified breakdown under heterogeneity; and a large, matched-budget GPT-2 experimental suite with pre-specified one-sided tests. The geometric-mean R0 structure and the intervention ranking that follows from it are the main conceptual contributions. The work is phenomenological applied theory rather than a fitted ecosystem measurement, which limits policy weight but does not erase the value of the framework.
major comments (3)
- [Section 6 / Abstract] Section 6.4 maps α to transmission intensity and (1−α) to recovery, and the abstract/intro package the GPT-2 results as “qualitatively consistent with the threshold picture.” The experiments are single-lineage recursive fine-tunes (or fixed-pool multi-source mixes) that never instantiate two interacting populations, never measure S/I/R compartment fractions, and never estimate β or γ rates. Dose-response and Distinct-2 collapse are already predicted by single-chain collapse theory (Shumailov et al., Dohmatob et al.). The only bilayer-specific empirical claim—source diversity K via β_eff_M(K)=β_M/f(K)—is borderline at α=1 (one-sided p=0.047, ~2 PPL) and null at α=0.5. The manuscript should either (a) reframe Section 6 as an empirical bridge to recursive degradation only, not to bilayer R0 supercriticality, or (b) add an analysis that actually probes cross-layer structure (e.g., separate d
- [Section 4.2–4.3, Section 7, Table 2] Section 4 and Table 2 present three scenarios with R0 ∈ {1.10, 2.62, 6.63} and P(R0>1)=98.2% from Sobol sampling, then Section 7 ranks interventions that drive R0 below 1. The paper correctly labels calibration as illustrative, but the intervention conclusions (watermark+filtering and herd immunity as sole single strategies achieving R0<1; γ_D as highest leverage) inherit the assumed ranges and the algebraic form of R0 rather than measured elasticities. The load-bearing claim for readers is that detection is the practical lever; this needs a sharper separation between “model-conditional ranking under assumed ranges” and any claim about the real ecosystem. A short sensitivity table showing how the ranking changes under alternative prior ranges (especially γ_D coverage and β_D growth) would make the conditionality operational.
- [Section 3.1] Section 3.1 operationalizes continuous contamination via a threshold τ into binary S/I/R states, noting that R0 is independent of τ. That algebraic independence is correct, but all empirical mapping (α as contamination fraction) and intervention interpretation rest on the partition remaining meaningful for quality degradation. The manuscript does not show that intervention rankings or endemic levels are robust to alternative τ choices or to a continuous-state formulation. A brief continuous-state or multi-compartment sensitivity (or an explicit statement that intervention rankings are conditional on the binary partition) is needed before the herd-immunity and filtering recommendations can be treated as more than structural consequences of the ODE.
minor comments (5)
- [Section 3.4, Appendix I] Theorem/Proposition numbering is inconsistent in the main text (Theorem 3 vs. Proposition 3 for endemic equilibrium; Appendix I maps code names differently). Unify labels between main text, appendix, and verification code.
- [Figure 5] Figure 5 right panel labels pairwise comparisons “n.s.” while the text reports one-sided p=0.047 for K=1 vs K=5. Align figure annotations with the pre-specified one-sided tests and report effect sizes on the figure.
- [Introduction / Section E] The 74% AI-text prevalence figure is flagged as projected (Section E); the abstract and introduction still lead with it. Soften the lead sentence or move the projection caveat earlier.
- [Section 3.3, Appendix A.1] Eq. (7)–(8) and the implementation note correctly state that cross-population ratios cancel; a one-line remark in the main text that the code uses the simplified F would help reproducibility readers.
- [Table 3] Table 3 Shakespeare rows omit growth-rate and AIC columns without a clear reason in the caption; either compute them or state why they are omitted.
Circularity Check
No significant circularity: R0 is standard NGM spectral radius on the bilayer infected subsystem (cross-ratios cancel algebraically), calibration is openly illustrative/scenario-based from external prevalence data, and GPT-2 runs are independent qualitative checks that do not feed parameters back into the derivation.
full rationale
The load-bearing mathematical claim is Theorem 1 / Eq. (8): R0 = sqrt(βD βM / [(γD+μD)(γM+μM)]), obtained as ρ(FV^{-1}) for the linearized infected subsystem (ID, IM). The off-diagonal product of F V^{-1} cancels the cross-population ratios exactly, yielding the geometric mean; this is ordinary Next-Generation-Matrix algebra applied to the six ODEs and does not depend on any fitted value, prevalence number, or experimental outcome. Theorems 2–4 (DFE stability, endemic existence, transcritical bifurcation) are likewise standard epidemic results verified numerically on random parameter draws, not on data. Calibration (Section 4) is explicitly labeled “illustrative scenario-based” and uses external public AI-text prevalence points only to set three example (β,γ) triples; those triples are never re-inserted into the R0 derivation or used to “predict” the same prevalence. Sobol indices are pure algebraic sensitivity of the closed-form R0. The GPT-2 chains (192 + 1 088 runs) are presented only as a “qualitative bridge” / “phenomenological analogy” that never measures compartment fractions, never estimates β or γ, and never fits the ODE; dose-response and Distinct-2 collapse are therefore independent empirical observations, not circular predictions. The sole auxiliary construct β_eff_M(K)=βM/f(K) is openly labeled a modeling hypothesis motivated by heterogeneous mixing and is tested (not assumed) by the matched-budget ablation; its weak, non-monotonic result is reported as such. No self-citations exist (single-author paper), no uniqueness theorem is imported, and no known empirical pattern is merely renamed. The derivation chain is therefore self-contained against its own inputs.
Assumptions & free parameters
free parameters (4)
- β_D (data contamination rate) =
0.216 month^-1 (baseline)
- γ_D (detection/removal rate) =
0.099 month^-1
- β_M, γ_M, μ_D, μ_M, Λ_D, Λ_M =
β_M=0.340, γ_M=0.060, μ_D=0.02, μ_M=0.03, Λ_D=5, Λ_M=3
- f(K) diversity attenuation factor =
unspecified functional form (e.g. 1+c log K)
assumptions (4)
- domain assumption Homogeneous mixing within each layer and mass-action cross-layer incidence
- ad hoc to paper Continuous contamination can be thresholded into binary S/I/R states without altering qualitative R0 structure
- standard math Next-generation-matrix spectral radius correctly gives the invasion threshold for the bilayer system
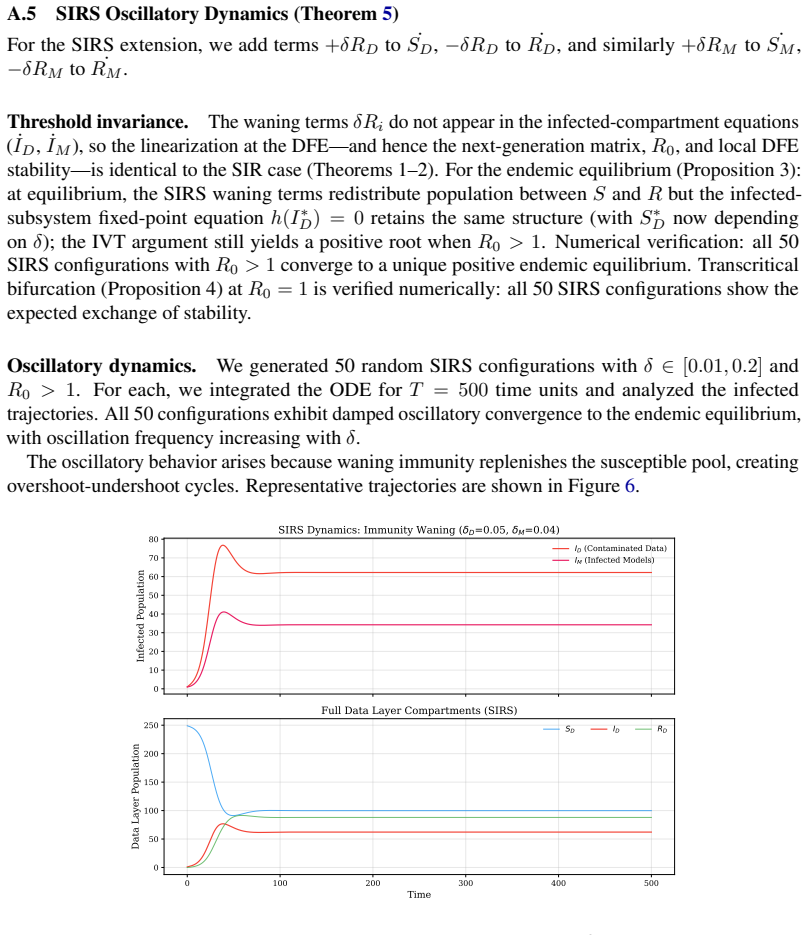
- standard math Waning-immunity rate δ leaves the infected-subsystem linearization (hence R0) unchanged
invented entities (2)
-
Bilayer data-corpora / AI-models S/I/R populations with cross-layer transmission
-
Source-diversity attenuation factor f(K)
Cite this review
Pith. "Pith review of Epidemiology of Model Collapse: Modeling Synthetic Data Contamination via Bilayer SIR Dynamics." pith.science (2026). https://pith.science/paper/7N4ELI7M
@misc{pith2026260605168,
  author       = {Pith},
  title        = {Pith review of: Epidemiology of Model Collapse: Modeling Synthetic Data Contamination via Bilayer SIR Dynamics},
  year         = {2026},
  howpublished = {\url{https://pith.science/paper/7N4ELI7M}},
  note         = {Machine review of arXiv:2606.05168}
}
abstract
Training on synthetic data causes model collapse, but existing analyses treat this as single-chain degradation. In reality, the AI ecosystem involves cross-contamination: models ingest synthetic data from other models, produce new synthetic text, and contaminate shared corpora. We propose a bilayer coupled SIR/SIRS framework -- a phenomenological mean-field model treating data corpora and AI models as two interacting populations, each with susceptible, infected, and recovered compartments linked by cross-layer transmission. The SIRS variant (our primary recommendation) incorporates immunity waning, reflecting that filtered corpora and retrained models remain susceptible to re-contamination. We derive the basic reproduction number $R_0 = \sqrt{\beta_D \beta_M / [(\gamma_D+\mu_D)(\gamma_M+\mu_M)]}$ via the Next Generation Matrix and apply standard epidemic threshold results to the bilayer system. Illustrative scenario-based calibration from public AI text prevalence data yields supercritical dynamics ($R_0 > 1$) across three scenarios; Sobol sensitivity analysis identifies synthetic-text detection as the highest-leverage parameter. A bipartite-network agent-based model confirms mean-field consistency ($R^2 > 0.96$) for dense networks but degrades under heterogeneity. GPT-2 contamination chain experiments (192 runs across WikiText and Shakespeare) show dose-response degradation and diversity loss qualitatively consistent with the threshold picture. Matched-budget source-diversity experiments (1,088 runs) provide suggestive evidence that multi-source mixing modestly attenuates collapse, but the effect vanishes at lower contamination fractions. Intervention analysis identifies detection-based filtering and herd immunity as the highest-leverage strategies.
Figures


Figures from the paper (13 more)




Reference graph
Works this paper leans on
-
[1]
Self-Consuming Generative Models Go MAD
Sina Alemohammad, Josue Casco-Rodriguez, Lorenzo Luzi, Ahmed Imtiaz Humayun, Hossein Babaei, Daniel LeJeune, and Richard G Baraniuk. Self-Consuming Generative Models Go MAD. InProceedings of the International Conference on Learning Representations (ICLR), 2024
2024
-
[2]
Dynamical Models of Tuberculosis and Their Applications.Mathematical Biosciences and Engineering, volume 1, pp
Carlos Castillo-Chavez and Baojun Song. Dynamical Models of Tuberculosis and Their Applications.Mathematical Biosciences and Engineering, volume 1, pp. 361–404, 2004. 11
2004
-
[3]
Odo Diekmann, J A P Heesterbeek, and Johan A J Metz. On the Definition and the Computation of the Basic Reproduction Ratio R0 in Models for Infectious Diseases in Heterogeneous Populations.Journal of Mathematical Biology, volume 28, pp. 365–382, 1990
1990
-
[4]
Strong Model Collapse
Elvis Dohmatob, Yunzhen Feng, Arjun Subramonian, and Horia Mania. Strong Model Collapse. InProceedings of the International Conference on Learning Representations (ICLR), 2025
2025
-
[5]
Matthias Gerstgrasser, Rylan Schaeffer, Apratim Dey, Rafael Rafailov, Henry Sleight, John Hughes, Tomasz Korbak, Rajashree Agrawal, Dhruv Pai, Andrey Gromov, et al. Is Model Collapse Inevitable? Breaking the Curse of Recursion by Accumulating Real and Synthetic Data.arXiv preprint arXiv:2404.01413, 2024
arXiv 2024
-
[6]
The Mathematics of Infectious Diseases.SIAM Review, volume 42, pp
Herbert W Hethcote. The Mathematics of Infectious Diseases.SIAM Review, volume 42, pp. 599–653, 2000
2000
-
[7]
Epidemiologi- cal Modeling of News and Rumors on Twitter.Proceedings of the Workshop on Social Network Mining and Analysis, pp
Fang Jin, Edward Dougherty, Parang Saraf, Yang Cao, and Naren Ramakrishnan. Epidemiologi- cal Modeling of News and Rumors on Twitter.Proceedings of the Workshop on Social Network Mining and Analysis, pp. 1–9, 2013
2013
-
[8]
Measuring and Modeling Computer Virus Prevalence
Jeffrey O Kephart and Steve R White. Measuring and Modeling Computer Virus Prevalence. Proceedings of the IEEE Symposium on Security and Privacy, pp. 2–15, 1993
1993
Show all 28 references
-
[9]
A Contribution to the Mathematical Theory of Epidemics.Proceedings of the Royal Society of London
William Ogilvy Kermack and Anderson G McKendrick. A Contribution to the Mathematical Theory of Epidemics.Proceedings of the Royal Society of London. Series A, volume 115, pp. 700–721, 1927
1927
-
[10]
A Watermark for Large Language Models
John Kirchenbauer, Jonas Geiping, Yuxin Wen, Jonathan Katz, Ian Miers, and Tom Goldstein. A Watermark for Large Language Models. InProceedings of the International Conference on Machine Learning (ICML), 2023
2023
-
[11]
Monitoring AI- Modified Content at Scale
Weixin Liang, Mert Yuksekgonul, Yining Mao, Eric Wu, and James Zou. Monitoring AI- Modified Content at Scale. 2024
2024
-
[12]
A Pretrainer’s Guide to Training Data: Measuring the Effects of Data Age, Domain Coverage, Quality, and Toxicity.arXiv preprint arXiv:2305.13169, 2024
Shayne Longpre, Robert Mahari, Anthony Chen, Naana Obeid, Damien Chan, Andrea Madotto, Colin Raffel, and Harm de Vries. A Pretrainer’s Guide to Training Data: Measuring the Effects of Data Age, Domain Coverage, Quality, and Toxicity.arXiv preprint arXiv:2305.13169, 2024
2024 arXiv
-
[13]
Pointer Sentinel Mixture Models.arXiv preprint arXiv:1609.07843, 2016
Stephen Merity, Caiming Xiong, James Bradbury, and Richard Socher. Pointer Sentinel Mixture Models.arXiv preprint arXiv:1609.07843, 2016
2016 arXiv
-
[14]
Model Cards for Model Reporting
Margaret Mitchell, Simone Wu, Andrew Zaldivar, Parker Barnes, Lucy Vasserman, Ben Hutchin- son, Elena Spitzer, Inioluwa Deborah Raji, and Timnit Gebru. Model Cards for Model Reporting. InProceedings of the Conference on Fairness, Accountability, and Transparency (FAT*), pp. 22...
2019
-
[15]
Epidemic Processes in Complex Networks.Reviews of Modern Physics, volume 87, pp
Romualdo Pastor-Satorras, Claudio Castellano, Piet Van Mieghem, and Alessandro Vespignani. Epidemic Processes in Complex Networks.Reviews of Modern Physics, volume 87, pp. 925–979, 2015
2015
-
[16]
Lawrence Perko.Differential Equations and Dynamical Systems, Springer, 2001
2001
-
[17]
Language Models are Unsupervised Multitask Learners.OpenAI Blog, 2019
Alec Radford, Jeffrey Wu, Rewon Child, David Luan, Dario Amodei, and Ilya Sutskever. Language Models are Unsupervised Multitask Learners.OpenAI Blog, 2019
2019
-
[18]
Variance Based Sensitivity Analysis of Model Output
Andrea Saltelli, Paola Annoni, Ivano Azzini, Francesca Campolongo, Marco Ratto, and Stefano Tarantola. Variance Based Sensitivity Analysis of Model Output. Design and Estimator for the Total Sensitivity Index.Computer Physics Communications, volume 181, pp. 259–270, 2010. 12
2010
-
[19]
How Bad is Training on Synthetic Data? A Statistical Analysis
Mohamed El Amine Seddik, Suei-Hai Chen, Soufiane Hayou, Pierre Youssef, and Merouane Debbah. How Bad is Training on Synthetic Data? A Statistical Analysis. InProceedings of the International Conference on Machine Learning (ICML), 2024
2024
-
[20]
AI models collapse when trained on recursively generated data.Nature, volume 631, pp
Ilia Shumailov, Zakhar Shumaylov, Yiren Zhao, Nicolas Papernot, Ross Anderson, and Yarin Gal. AI models collapse when trained on recursively generated data.Nature, volume 631, pp. 755–759, 2024
2024
-
[21]
The Science of Detecting LLM-Generated Text
Ruixiang Tang, Yu-Neng Chuang, and Xia Hu. The Science of Detecting LLM-Generated Text. Communications of the ACM, volume 67, pp. 81–90, 2024
2024
-
[22]
AI-Generated Content Prevalence in Web Corpora
Neil C Thompson and Shuning Ge. AI-Generated Content Prevalence in Web Corpora. 2024
2024
-
[23]
Reproduction Numbers and Sub-threshold Endemic Equilibria for Compartmental Models of Disease Transmission.Mathematical Bio- sciences, volume 180, pp
Pauline van den Driessche and James Watmough. Reproduction Numbers and Sub-threshold Endemic Equilibria for Compartmental Models of Disease Transmission.Mathematical Bio- sciences, volume 180, pp. 29–48, 2002
2002
-
[24]
The Spread of True and False News Online
Soroush V osoughi, Deb Roy, and Sinan Aral. The Spread of True and False News Online. Science, volume 359, pp. 1146–1151, 2018. 13 A Proof Sketches and Numerical Evidence A.1 Proof of Theorem 1: Basic Reproduction Number We apply the Next Generation Matrix (NGM) method of van ...
2018
-
[25]
Infection occurs with probabilityp(Bernoulli trial)
Infection (data nodes): For each susceptible data node, infection pressure is the traffic- weighted fraction of infected model neighbors: p=β D ·(P infected traffic)/(P all traffic). Infection occurs with probabilityp(Bernoulli trial)
-
[26]
3.Recovery: Each infected node recovers with probabilityγ i per step
Infection (model nodes): For each susceptible model node, infection pressure is the fraction of infected data neighbors: p=β M ·k I /k, where kI is the number of infected data neighbors andkis the total. 3.Recovery: Each infected node recovers with probabilityγ i per step. 4.T...
-
[27]
Superspreaders: If enabled, a configurable fraction of model nodes have 10× traffic weight, amplifying their infection pressure on data nodes
-
[28]
20 realizations are run per configuration for 50 time steps (default)
Detectors: If enabled, detector nodes scan assigned neighbors and recover each infected neighbor with probability precision×coverage per step. 20 realizations are run per configuration for 50 time steps (default). Ensemble means and standard deviations are computed at each tim...
Reviewed July 12, 2026 · model on record in the stance chip above.
Discussion (0). Sign in to comment.