Early Results from GLASS-JWST. XXVI. Spatially Resolved Star Formation and Balmer Decrements at 1.1<z<2.3 from NIRISS Slitless Spectroscopy
Pith reviewed 2026-06-28 00:53 UTC · model grok-4.3
The pith
Radial dust attenuation gradients in galaxies vary with stellar mass and redshift between 1.1 and 2.3.
A machine-rendered reading of the paper's core claim, the machinery that carries it, and where it could break.
Core claim
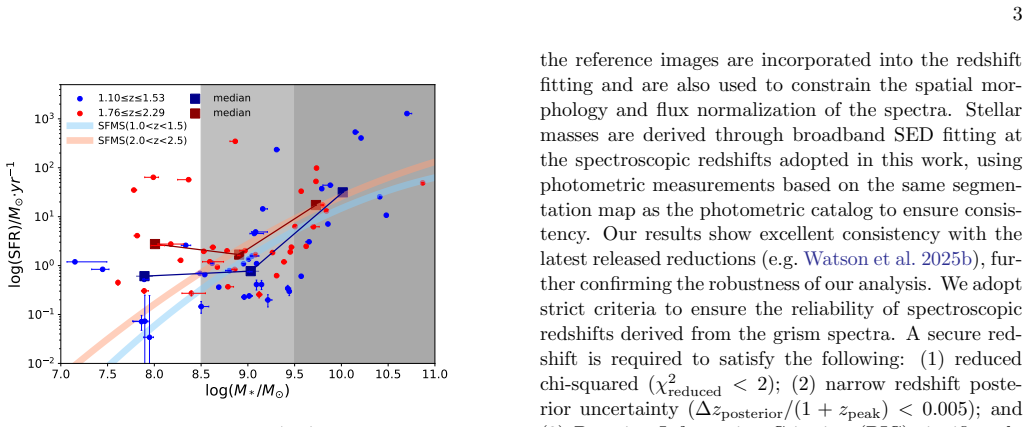
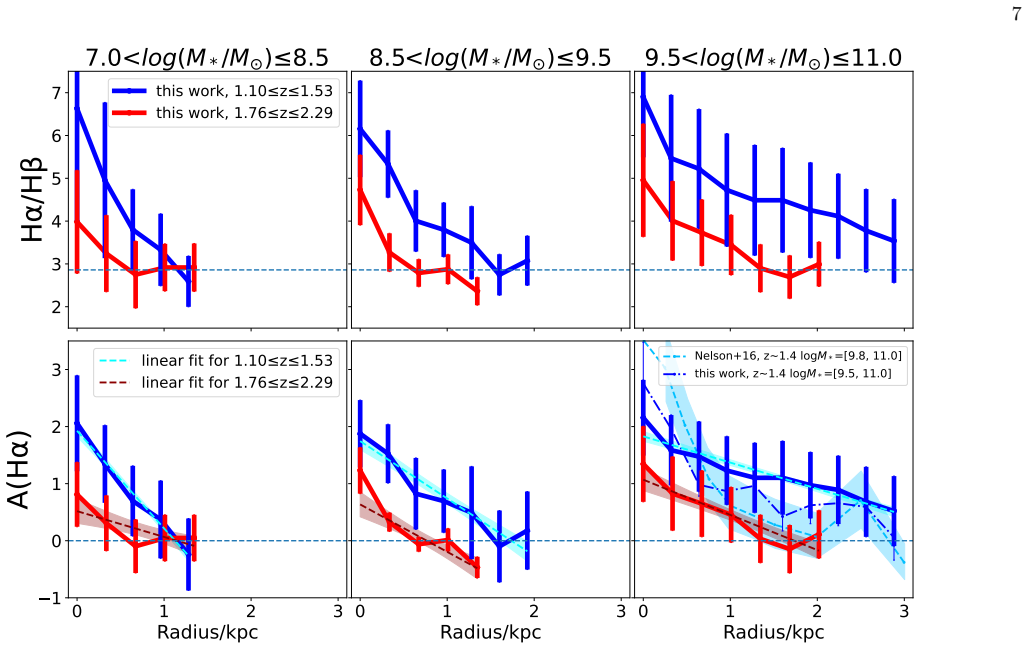
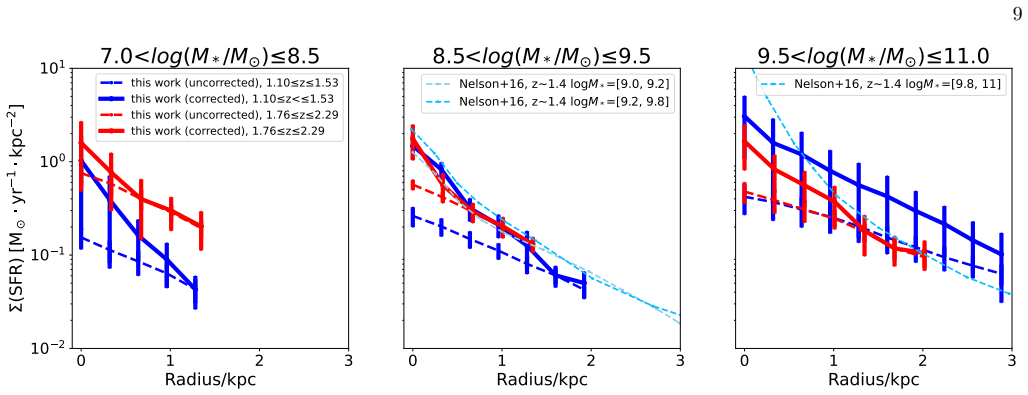
By stacking the emission maps in stellar-mass and redshift bins after lensing correction, the analysis finds that A(Hα) gradients vary with both redshift and stellar mass: low-mass galaxies at z = 1.10–1.53 show steeper gradients than higher-mass galaxies, the latter retaining attenuation to larger radii, while galaxies at z = 1.76–2.29 exhibit lower overall attenuation levels. At fixed radius, attenuation is higher in the lower-redshift bin. Dust-corrected SFR profiles in massive systems are more spatially extended at lower redshifts, supporting inside-out disk growth at z ≲ 1.5.
What carries the argument
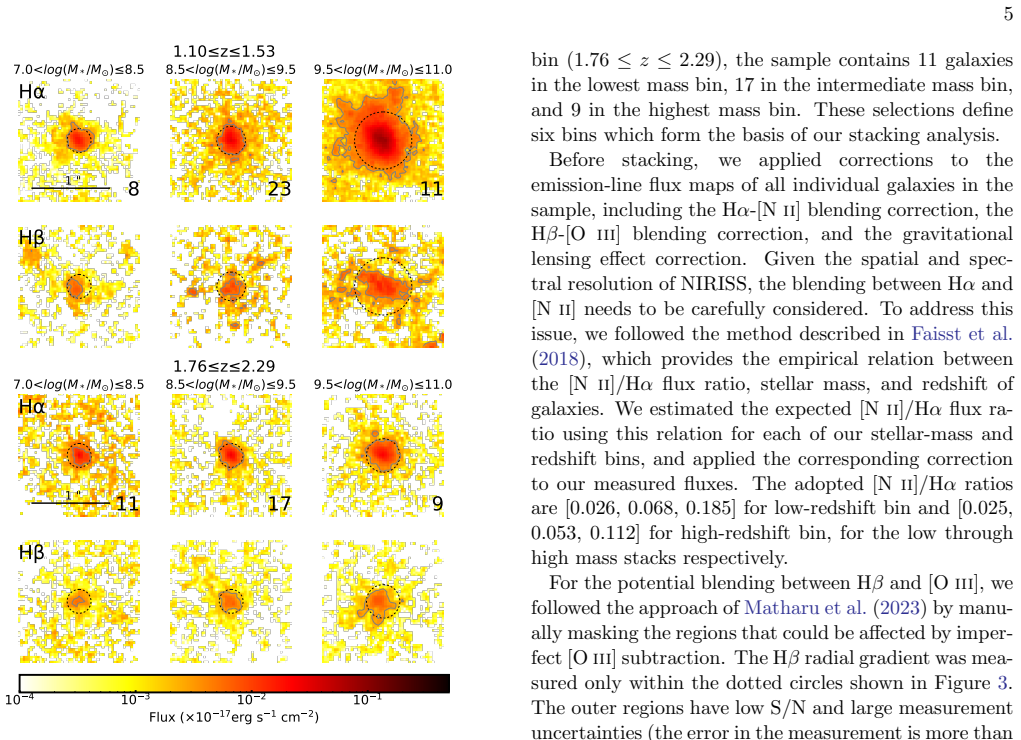
Stacking of Hα and Hβ emission maps from NIRISS slitless spectroscopy in mass and redshift bins, after gravitational-lensing correction, to obtain average radial profiles of the Balmer decrement and dust-corrected SFR.
If this is right
- Low-mass galaxies develop steeper central dust concentrations at z ~ 1.3 than high-mass galaxies do.
- Nebular dust content increases between z ~ 2.3 and z ~ 1.1 across the sampled mass range.
- Dust-corrected star formation in massive galaxies spreads to larger radii as redshift decreases below 1.5.
- These trends are consistent with inside-out growth of galactic disks at z ≲ 1.5.
Where Pith is reading between the lines
- The mass dependence could reflect different dust-production or retention efficiencies tied to galaxy assembly history.
- Future larger samples without lensing could test whether the same gradient patterns appear in field galaxies.
- Extending the same stacking approach to z > 3 might reveal when the observed rise in attenuation begins.
Load-bearing premise
Stacking the emission maps in chosen stellar-mass and redshift bins after lensing correction produces representative radial profiles without dominant systematics from magnification variations or source reconstruction uncertainties.
What would settle it
Re-deriving the profiles with per-galaxy magnification corrections or alternate binning that erases the reported differences in A(Hα) gradient steepness between low-mass and high-mass bins at low versus high redshift would undermine the evidence for mass- and redshift-dependent attenuation.
Figures
read the original abstract
Using JWST/NIRISS slitless spectroscopy, we present spatially resolved Balmer decrement measurements for 79 galaxies at $1.1 < z < 2.3$, which are gravitationally lensed by the foreground cluster Abell 2744. By stacking $\mathrm{H}\alpha$ and $\mathrm{H}\beta$ emission maps in bins of stellar mass and redshift, we derive radial profiles of nebular dust attenuation and dust-corrected star formation rate (SFR). We find tentative evidence that the radial gradients of dust attenuation toward $\mathrm{H}\alpha$ ($\rm A(\mathrm{H}\alpha)$) vary with both redshift and stellar mass. At lower redshifts ($z = 1.10$--$1.53$), low-mass galaxies ($\rm 7.0<log(M_*/M_\odot)\leq8.5$) exhibit steeper $\rm A(H\alpha)$ gradients than higher-mass galaxies ($\rm 9.5<log(M_*/M_\odot)\leq11.0$), while the latter maintain detectable dust attenuation out to larger galactocentric radii. Galaxies at higher redshifts ($z = 1.76$--$2.29$) show lower attenuation levels. At fixed galactocentric radius, galaxies in the low-redshift bin generally exhibit higher dust attenuation than those at high redshifts, consistent with an increase in dust content toward later cosmic times. Dust-corrected SFR profiles in massive systems at lower redshifts are more spatially extended than those at higher redshifts, consistent with inside-out disk growth at $z\lesssim1.5$. These results suggest possible differences in attenuation properties across stellar mass and redshift bins, and demonstrate the power of gravitational lensing to probe internal structures in faint galaxies at sub-kiloparsec resolution.
Editorial analysis
A structured set of objections, weighed in public.
Referee Report
Summary. The manuscript uses JWST/NIRISS slitless spectroscopy to measure spatially resolved Balmer decrements for 79 gravitationally lensed galaxies at 1.1<z<2.3. Stacking Hα and Hβ emission maps in four stellar-mass and redshift bins yields radial profiles of nebular dust attenuation A(Hα) and dust-corrected SFR; the authors report tentative evidence that A(Hα) gradients vary with both redshift and mass (steeper in low-mass, low-z systems), that attenuation is lower at higher z, and that dust-corrected SFR profiles are more extended in low-z massive galaxies, consistent with inside-out growth at z≲1.5.
Significance. If the stacked profiles prove robust, the work supplies direct observational constraints on the spatial distribution of dust and star formation at sub-kpc scales in faint high-z galaxies, exploiting lensing magnification. The strength lies in the empirical, model-independent derivation of radial attenuation and SFR profiles from slitless spectroscopy rather than from SED fitting or simulations.
major comments (2)
- [Methods (stacking and lensing correction)] The central claim of redshift- and mass-dependent A(Hα) gradients rests on stacked radial profiles derived from only 79 galaxies total. The manuscript must demonstrate, via explicit tests (e.g., magnification-weighted stacks, jackknife resampling across the critical curve, or comparison of source-plane vs. image-plane profiles), that position-dependent magnification variations and reconstruction uncertainties do not systematically bias the reported differences in gradient steepness or radial extent between bins.
- [Abstract and Results] The abstract states that findings are tentative yet supplies no quantitative uncertainties, bootstrap errors, or significance tests on the measured gradient slopes or the radial extent of detectable attenuation. Without these, it is difficult to evaluate whether the claimed variations exceed the combined statistical and systematic uncertainties.
minor comments (2)
- [Abstract] The stellar-mass and redshift bin boundaries are specified, but the number of galaxies contributing to each stacked profile should be stated explicitly, together with the typical magnification range per bin.
- [Throughout] Notation for A(Hα) and the conversion from Balmer decrement to attenuation should be defined once in the text with a reference to the adopted extinction curve.
Simulated Author's Rebuttal
We thank the referee for their constructive comments, which have helped improve the clarity and robustness of the manuscript. We address each major comment below and indicate the revisions made.
read point-by-point responses
-
Referee: [Methods (stacking and lensing correction)] The central claim of redshift- and mass-dependent A(Hα) gradients rests on stacked radial profiles derived from only 79 galaxies total. The manuscript must demonstrate, via explicit tests (e.g., magnification-weighted stacks, jackknife resampling across the critical curve, or comparison of source-plane vs. image-plane profiles), that position-dependent magnification variations and reconstruction uncertainties do not systematically bias the reported differences in gradient steepness or radial extent between bins.
Authors: We agree that explicit robustness tests against lensing effects are necessary given the sample size and the central role of the stacked profiles. In the revised manuscript we have added jackknife resampling by systematically excluding galaxies near the critical curve and recomputing the binned profiles; we also include a direct comparison of image-plane versus source-plane radial profiles for the subset of sources with reliable lens models. Magnification-weighted stacking was tested but yielded unstable results owing to the small number of objects per bin and the strong variation in magnification; we therefore retain unweighted stacks but now explicitly discuss the associated caveats and potential biases in a new subsection. These additions address the primary concern while acknowledging the practical limitations of the current dataset. revision: partial
-
Referee: [Abstract and Results] The abstract states that findings are tentative yet supplies no quantitative uncertainties, bootstrap errors, or significance tests on the measured gradient slopes or the radial extent of detectable attenuation. Without these, it is difficult to evaluate whether the claimed variations exceed the combined statistical and systematic uncertainties.
Authors: We accept that quantitative uncertainties should be reported even when results are described as tentative. The revised abstract now includes bootstrap-derived uncertainties on the measured A(Hα) gradient slopes and on the radial extent of detectable attenuation, together with a brief statement of the significance of the differences between mass and redshift bins. The body of the paper has been updated with the corresponding error bars on all stacked profiles. The evidence remains tentative because the uncertainties are comparable to the reported differences, but the added numbers allow readers to assess the strength of the claims directly. revision: yes
Circularity Check
No significant circularity: direct observational derivation from JWST data
full rationale
The paper reports empirical radial profiles of A(Hα) and dust-corrected SFR obtained by stacking NIRISS slitless spectroscopy maps of 79 lensed galaxies in four mass/redshift bins, then computing Balmer decrements on the stacked images. No step reduces a claimed gradient or inside-out growth signal to a fitted parameter from the same dataset, a self-citation chain, or an ansatz smuggled via prior work by the same authors. The derivation chain consists of standard data reduction, lensing correction, binning, and ratio measurements; each output quantity is computed from the observed line fluxes rather than being defined in terms of itself. This is the most common honest non-finding for purely observational papers.
Axiom & Free-Parameter Ledger
free parameters (2)
- stellar mass bin boundaries
- redshift bin boundaries
axioms (1)
- domain assumption The observed Hα/Hβ line ratio reliably traces nebular dust attenuation after standard corrections
Reference graph
Works this paper leans on
-
[1]
Acharyya, A., Watson, P. J., Vulcani, B., et al. 2025, arXiv preprint arXiv:2508.05335
Pith/arXiv arXiv 2025
-
[2]
Adamo, A., Bradley, L. D., Vanzella, E., et al. 2024, Nature, 632, 513, doi: 10.1038/s41586-024-07703-7
-
[3]
2023, ApJ, 952, 84, doi: 10.3847/1538-4357/acd643 Bouch´ e, N., Dekel, A., Genzel, R., et al
Bergamini, P., Acebron, A., Grillo, C., et al. 2023, ApJ, 952, 84, doi: 10.3847/1538-4357/acd643 Bouch´ e, N., Dekel, A., Genzel, R., et al. 2010, ApJ, 718, 1001, doi: 10.1088/0004-637X/718/2/1001
-
[4]
2022, ApJL, 940, L52, doi: 10.3847/2041-8213/ac9f17
Boyett, K., Mascia, S., Pentericci, L., et al. 2022, ApJL, 940, L52, doi: 10.3847/2041-8213/ac9f17
-
[5]
1997, AJ, 113, 162, doi: 10.1086/118242
Calzetti, D. 1997, AJ, 113, 162, doi: 10.1086/118242
-
[6]
The Dust Content and Opacity of Actively Star-Forming Galaxies
Calzetti, D., Armus, L., Bohlin, R. C., et al. 2000, ApJ, 533, 682, doi: 10.1086/308692
work page internal anchor Pith review doi:10.1086/308692 2000
-
[7]
Carnall, A. C., McLure, R. J., Dunlop, J. S., & Dav´ e, R. 2018, MNRAS, 480, 4379, doi: 10.1093/mnras/sty2169
work page internal anchor Pith review doi:10.1093/mnras/sty2169 2018
-
[8]
Carnall, A. C., Begley, R., McLeod, D. J., et al. 2023, MNRAS, 518, L45, doi: 10.1093/mnrasl/slac136
-
[9]
2003, PASP, 115, 763, doi: 10.1086/376392
Chabrier, G. 2003, PASP, 115, 763, doi: 10.1086/376392
work page internal anchor Pith review doi:10.1086/376392 2003
-
[10]
2025, MNRAS, 537, 2535, doi: 10.1093/mnras/staf058
Claeyssens, A., Adamo, A., Messa, M., et al. 2025, MNRAS, 537, 2535, doi: 10.1093/mnras/staf058
-
[11]
2023, MNRAS, 520, 2180, doi: 10.1093/mnras/stac3791
Claeyssens, A., Adamo, A., Richard, J., et al. 2023, MNRAS, 520, 2180, doi: 10.1093/mnras/stac3791
-
[12]
L., Masters, D., Wang, Y., et al
Faisst, A. L., Masters, D., Wang, Y., et al. 2018, The Astrophysical Journal, 855, 132 Faucher-Gigu` ere, C.-A. 2018, Monthly Notices of the Royal Astronomical Society, 473, 3717
2018
-
[13]
2023, ApJL, 947, L25, doi: 10.3847/2041-8213/acba8b
Glazebrook, K., Nanayakkara, T., Jacobs, C., et al. 2023, ApJL, 947, L25, doi: 10.3847/2041-8213/acba8b
-
[14]
Hao, C.-N., Kennicutt, R. C., Johnson, B. D., et al. 2011, ApJ, 741, 124, doi: 10.1088/0004-637X/741/2/124
-
[15]
2024, ApJL, 960, L13, doi: 10.3847/2041-8213/ad12cd
He, X., Wang, X., Jones, T., et al. 2024, ApJL, 960, L13, doi: 10.3847/2041-8213/ad12cd
-
[16]
2015, ApJ, 814, 46, doi: 10.1088/0004-637X/814/1/46
Hemmati, S., Mobasher, B., Darvish, B., et al. 2015, ApJ, 814, 46, doi: 10.1088/0004-637X/814/1/46
-
[17]
Inami, H., Algera, H. S. B., Schouws, S., et al. 2022, MNRAS, 515, 3126, doi: 10.1093/mnras/stac1779
-
[18]
2025, Astronomy & Astrophysics, 693, A190
Jolly, J.-B., Knudsen, K., Laporte, N., et al. 2025, Astronomy & Astrophysics, 693, A190
2025
-
[19]
Stark, D. P. 2010, MNRAS, 404, 1247, doi: 10.1111/j.1365-2966.2010.16378.x
-
[20]
2025, ApJL, 978, L39, doi: 10.3847/2041-8213/ada150
Ju, M., Wang, X., Jones, T., et al. 2025, ApJL, 978, L39, doi: 10.3847/2041-8213/ada150
-
[21]
Kennicutt, R. C., & Evans, N. J. 2012, ARA&A, 50, 531, doi: 10.1146/annurev-astro-081811-125610 11
work page internal anchor Pith review doi:10.1146/annurev-astro-081811-125610 2012
-
[22]
Kennicutt, Jr., R. C. 1998, ARA&A, 36, 189, doi: 10.1146/annurev.astro.36.1.189
work page internal anchor Pith review doi:10.1146/annurev.astro.36.1.189 1998
-
[23]
Larson, R. B. 1992, MNRAS, 256, 641, doi: 10.1093/mnras/256.3.641
-
[24]
Law, D. R., Steidel, C. C., Erb, D. K., et al. 2009, ApJ, 697, 2057, doi: 10.1088/0004-637X/697/2/2057
-
[25]
2025, ApJ, 980, 69, doi: 10.3847/1538-4357/ada937
Liu, Z., Kodama, T., Morishita, T., et al. 2025, ApJ, 980, 69, doi: 10.3847/1538-4357/ada937
-
[26]
Livermore, R. C., Jones, T. A., Richard, J., et al. 2015, MNRAS, 450, 1812, doi: 10.1093/mnras/stv686
-
[27]
J., D’Eugenio, F., Maiolino, R., et al
Looser, T. J., D’Eugenio, F., Maiolino, R., et al. 2023, arXiv preprint arXiv:2306.02470
arXiv 2023
-
[28]
2014, ARA&A, 52, 415, doi: 10.1146/annurev-astro-081811-125615
Madau, P., & Dickinson, M. 2014, ARA&A, 52, 415, doi: 10.1146/annurev-astro-081811-125615
work page internal anchor Pith review doi:10.1146/annurev-astro-081811-125615 2014
-
[29]
Matharu, J., Muzzin, A., Brammer, G. B., et al. 2021, ApJ, 923, 222, doi: 10.3847/1538-4357/ac26c3
-
[30]
Matharu, J., Papovich, C., Simons, R. C., et al. 2022, ApJ, 937, 16, doi: 10.3847/1538-4357/ac8471
-
[31]
Matharu, J., Muzzin, A., Sarrouh, G. T. E., et al. 2023, ApJL, 949, L11, doi: 10.3847/2041-8213/acd1db
-
[32]
Messa, M., Vanzella, E., Loiacono, F., et al. 2025, A&A, 694, A59, doi: 10.1051/0004-6361/202451695 Meˇ stri´ c, U., Vanzella, E., Zanella, A., et al. 2022, MNRAS, 516, 3532, doi: 10.1093/mnras/stac2309
-
[33]
Momcheva, I. G., Lee, J. C., Ly, C., et al. 2013, AJ, 145, 47, doi: 10.1088/0004-6256/145/2/47
-
[34]
P., Matthee, J., Kramarenko, I., et al
Naidu, R. P., Matthee, J., Kramarenko, I., et al. 2024, arXiv e-prints, arXiv:2410.01874, doi: 10.48550/arXiv.2410.01874
-
[35]
Nelson, E. J., van Dokkum, P. G., Brammer, G., et al. 2012, ApJL, 747, L28, doi: 10.1088/2041-8205/747/2/L28
-
[36]
Nelson, E. J., van Dokkum, P. G., Momcheva, I., et al. 2013, ApJL, 763, L16, doi: 10.1088/2041-8205/763/1/L16
-
[37]
Nelson, E. J., van Dokkum, P. G., Momcheva, I. G., et al. 2016a, ApJL, 817, L9, doi: 10.3847/2041-8205/817/1/L9
-
[38]
Nelson, E. J., van Dokkum, P. G., F¨ orster Schreiber, N. M., et al. 2016b, ApJ, 828, 27, doi: 10.3847/0004-637X/828/1/27
-
[39]
J., Van Dokkum, P
Nelson, E. J., Van Dokkum, P. G., Schreiber, N. M. F., et al. 2016, The Astrophysical Journal, 828, 27
2016
-
[40]
Nelson, E. J., Suess, K. A., Bezanson, R., et al. 2023, ApJL, 948, L18, doi: 10.3847/2041-8213/acc1e1
-
[41]
E., & Ferland, G
Osterbrock, D. E., & Ferland, G. J. 2006, Astrophysics of gaseous nebulae and active galactic nuclei
2006
-
[42]
2023, ApJ, 952, 20, doi: 10.3847/1538-4357/acda8a
Paris, D., Merlin, E., Fontana, A., et al. 2023, ApJ, 952, 20, doi: 10.3847/1538-4357/acda8a
-
[43]
Y., Ho, L
Peng, C. Y., Ho, L. C., Impey, C. D., & Rix, H.-W. 2010, The Astronomical Journal, 139, 2097
2010
-
[44]
Price, S. H., Kriek, M., Brammer, G. B., et al. 2014, ApJ, 788, 86, doi: 10.1088/0004-637X/788/1/86
-
[45]
Reddy, N. A., Topping, M. W., Sanders, R. L., Shapley, A. E., & Brammer, G. 2023, ApJ, 948, 83, doi: 10.3847/1538-4357/acc869
-
[46]
Reddy, N. A., Kriek, M., Shapley, A. E., et al. 2015, ApJ, 806, 259, doi: 10.1088/0004-637X/806/2/259
-
[47]
A., Topping, M
Rezaee, S., Reddy, N. A., Topping, M. W., et al. 2023, Monthly Notices of the Royal Astronomical Society, 526, 1512
2023
-
[48]
2023, PASP, 135, 048001, doi: 10.1088/1538-3873/acb293
Rigby, J., Perrin, M., McElwain, M., et al. 2023, PASP, 135, 048001, doi: 10.1088/1538-3873/acb293
-
[49]
Sanders, R. L., Shapley, A. E., Reddy, N. A., et al. 2020, MNRAS, 491, 1427, doi: 10.1093/mnras/stz3032
-
[50]
2024, A&A, 691, A305, doi: 10.1051/0004-6361/202347119
Sandles, L., D’Eugenio, F., Maiolino, R., et al. 2024, A&A, 691, A305, doi: 10.1051/0004-6361/202347119
-
[51]
Shapley, A. E., Sanders, R. L., Reddy, N. A., Topping, M. W., & Brammer, G. B. 2023, ApJ, 954, 157, doi: 10.3847/1538-4357/acea5a
-
[52]
Shapley, A. E., Sanders, R. L., Salim, S., et al. 2022, ApJ, 926, 145, doi: 10.3847/1538-4357/ac4742
-
[53]
2020, ApJ, 899, 117, doi: 10.3847/1538-4357/aba35e
Shivaei, I., Reddy, N., Rieke, G., et al. 2020, ApJ, 899, 117, doi: 10.3847/1538-4357/aba35e
-
[54]
2022, MNRAS, 513, 3122, doi: 10.1093/mnras/stac302
Sommovigo, L., Ferrara, A., Pallottini, A., et al. 2022, MNRAS, 513, 3122, doi: 10.1093/mnras/stac302
-
[55]
C., Feldmann, R., et al
Sparre, M., Hayward, C. C., Feldmann, R., et al. 2017, Monthly Notices of the Royal Astronomical Society, 466, 88
2017
-
[56]
G., et al
Szomoru, D., Franx, M., van Dokkum, P. G., et al. 2013, The Astrophysical Journal, 763, 73
2013
-
[57]
Tacchella, S., Carollo, C. M., Renzini, A., et al. 2015, Science, 348, 314, doi: 10.1126/science.1261094
-
[58]
2022, ApJ, 935, 110, doi: 10.3847/1538-4357/ac8158
Treu, T., Roberts-Borsani, G., Bradac, M., et al. 2022, ApJ, 935, 110, doi: 10.3847/1538-4357/ac8158
-
[59]
Vulcani, B., Treu, T., Schmidt, K. B., et al. 2015, ApJ, 814, 161, doi: 10.1088/0004-637X/814/2/161 —. 2016, ApJ, 833, 178, doi: 10.3847/1538-4357/833/2/178
-
[60]
2017, ApJ, 837, 126, doi: 10.3847/1538-4357/aa618b
Vulcani, B., Treu, T., Nipoti, C., et al. 2017, ApJ, 837, 126, doi: 10.3847/1538-4357/aa618b
-
[61]
Wang, X., Jones, T. A., Treu, T., et al. 2017, ApJ, 837, 89, doi: 10.3847/1538-4357/aa603c —. 2019, ApJ, 882, 94, doi: 10.3847/1538-4357/ab3861 —. 2020, ApJ, 900, 183, doi: 10.3847/1538-4357/abacce
-
[62]
2022, The Astrophysical Journal, 926, 70, doi: 10.3847/1538-4357/ac3974
Wang, X., Li, Z., Cai, Z., et al. 2022, The Astrophysical Journal, 926, 70, doi: 10.3847/1538-4357/ac3974
-
[63]
2022, ApJL, 938, L16, doi: 10.3847/2041-8213/ac959e
Wang, X., Jones, T., Vulcani, B., et al. 2022, ApJL, 938, L16, doi: 10.3847/2041-8213/ac959e
-
[64]
E., Franx, M., Leja, J., et al
Whitaker, K. E., Franx, M., Leja, J., et al. 2014, The Astrophysical Journal, 795, 104
2014
-
[65]
Wild, V., Charlot, S., Brinchmann, J., et al. 2011, MNRAS, 417, 1760, doi: 10.1111/j.1365-2966.2011.19367.x
-
[66]
J., Doyon, R., Albert, L., et al
Willott, C. J., Doyon, R., Albert, L., et al. 2022, PASP, 134, 025002, doi: 10.1088/1538-3873/ac5158
-
[67]
Wuyts, S., F¨ orster Schreiber, N. M., Nelson, E. J., et al. 2013, ApJ, 779, 135, doi: 10.1088/0004-637X/779/2/135
discussion (0)
Sign in with ORCID, Apple, or X to comment. Anyone can read and Pith papers without signing in.