SC3: The Multi-Solvent Solubility Challenge and Benchmark
Pith reviewed 2026-06-28 04:09 UTC · model grok-4.3
The pith
Current multi-solvent solubility models fall short of the experimental noise limit by a factor of five.
A machine-rendered reading of the paper's core claim, the machinery that carries it, and where it could break.
Core claim
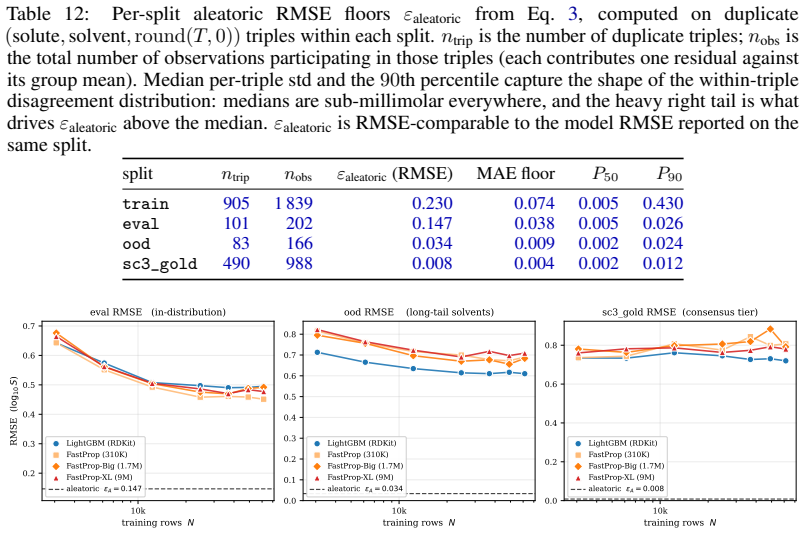
The central claim is that multi-solvent solubility prediction has a genuine performance gap, as evidenced by the SC3 benchmark where the best model's PS-RMSE is five times the recalibrated aleatoric floor of 0.106 log S, and deep learning alternatives do not close it.
What carries the argument
The SC3 benchmark with its Gold, Silver, and Bronze consensus tiers, per-point standard deviations, leakage-checked splits, and the PS-RMSE and Z-RMSE metrics.
If this is right
- Calibrated per-point uncertainty estimates serve as infrastructure for diagnosing model performance beyond point predictions.
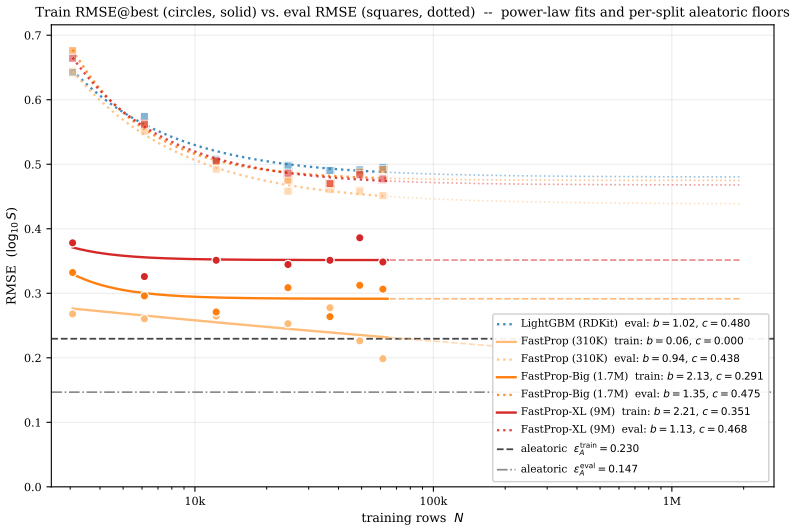
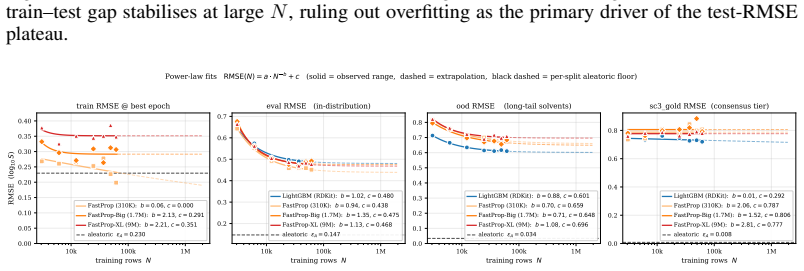
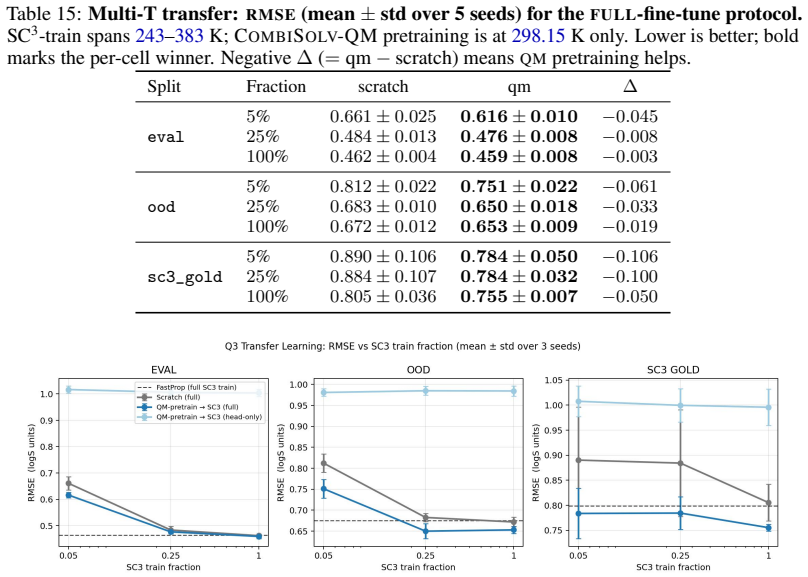
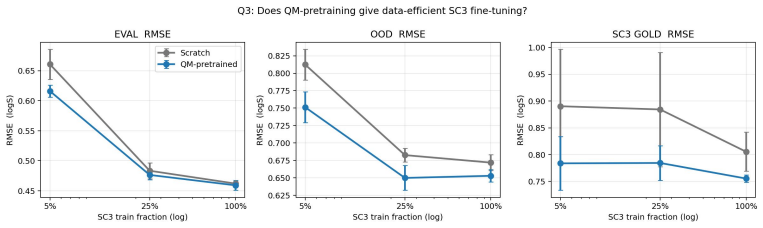
- Analyses of data scaling and transfer from quantum-chemistry solvation energies become possible on a consistent dataset.
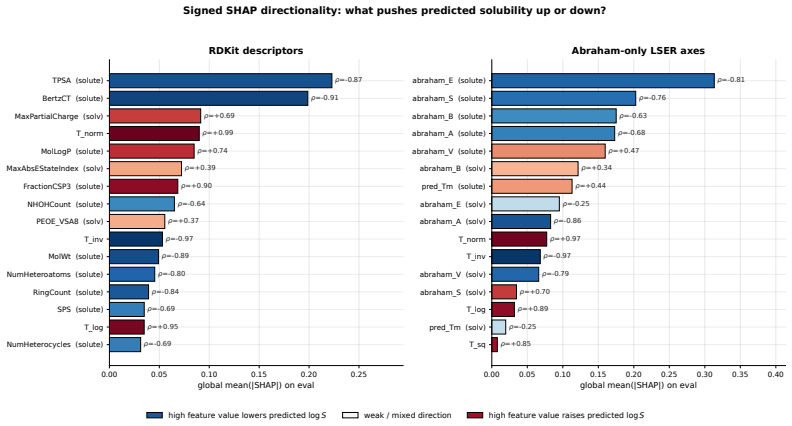
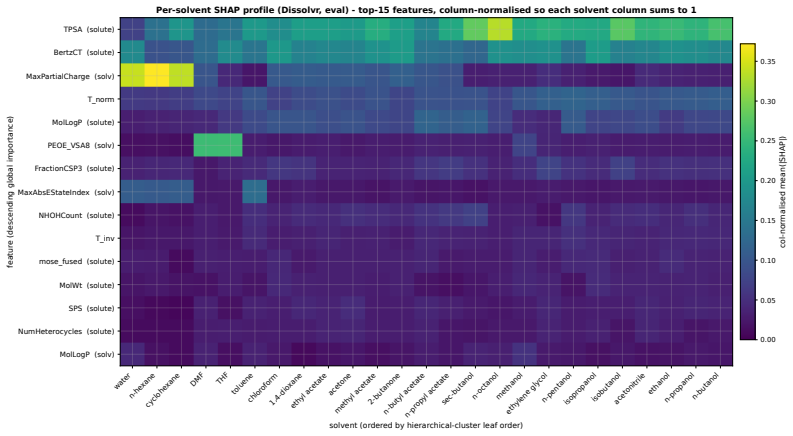
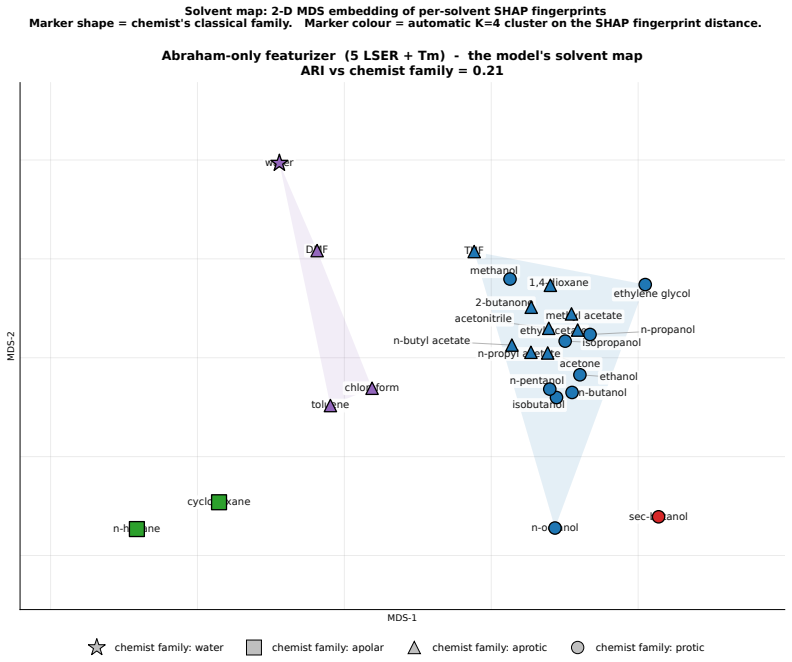
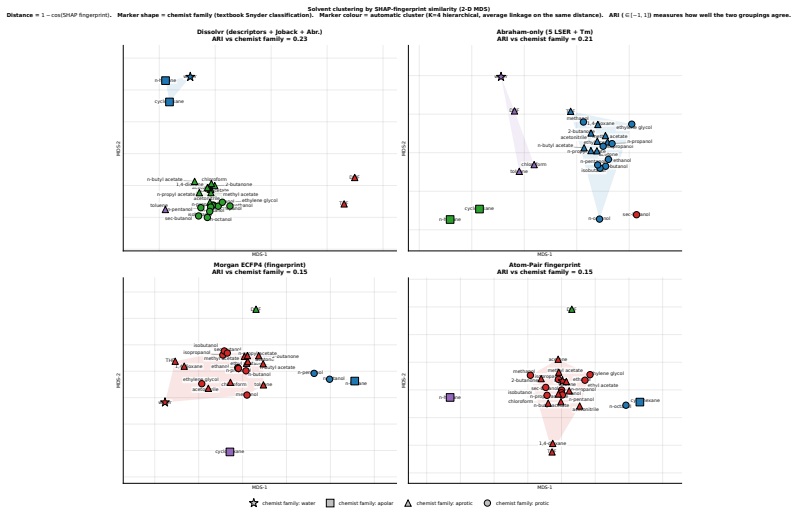
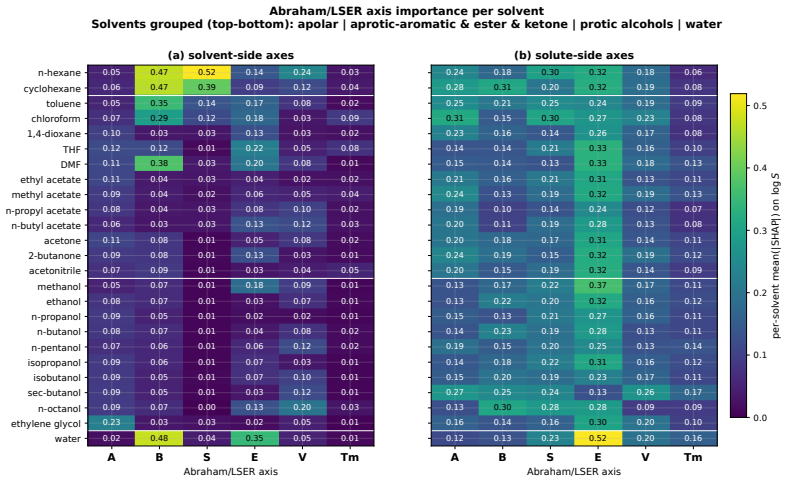
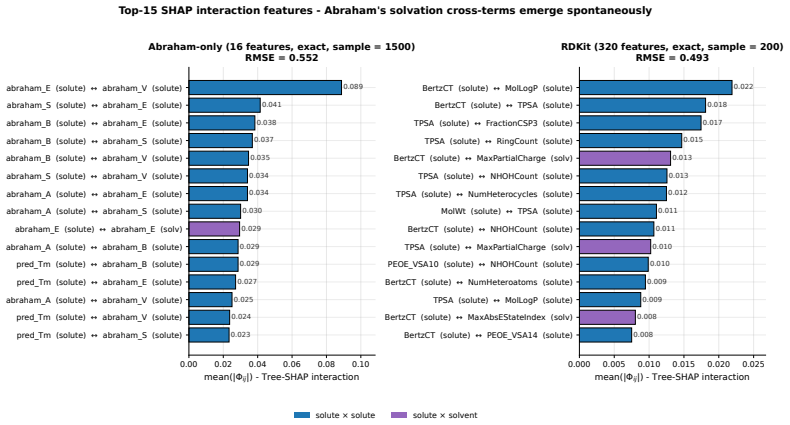
- Feature-level attribution can identify key factors in solubility predictions when uncertainty is accounted for.
Where Pith is reading between the lines
- The approach of tiered consensus data with uncertainty could be applied to other molecular property predictions where experimental variability matters.
- If the gap remains after more models are tested, it may point to limitations in how current methods represent solvent-solute interactions.
- Extending the benchmark to include more diverse solvents or solutes could test generalizability further.
Load-bearing premise
The curation pipeline produces an unbiased set of measurements whose consensus standard deviations accurately reflect the true aleatoric experimental variability without introducing selection or measurement bias.
What would settle it
Independent replication of solubility measurements for multiple solute-solvent pairs to check if the observed variability matches the consensus standard deviations in the benchmark.
Figures
read the original abstract
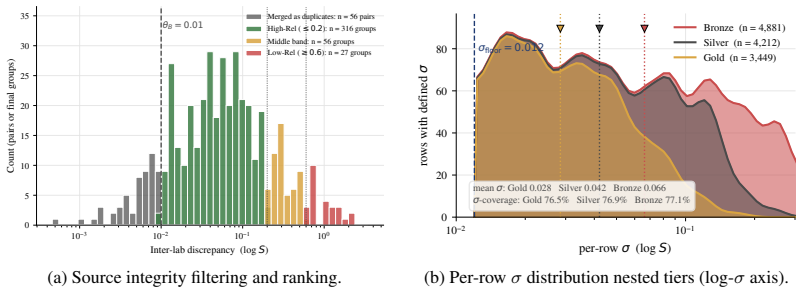
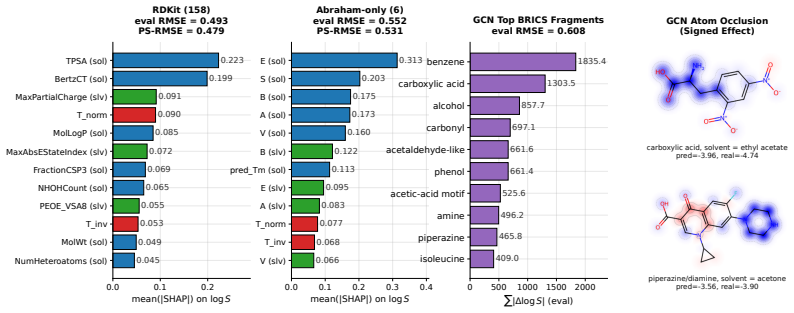
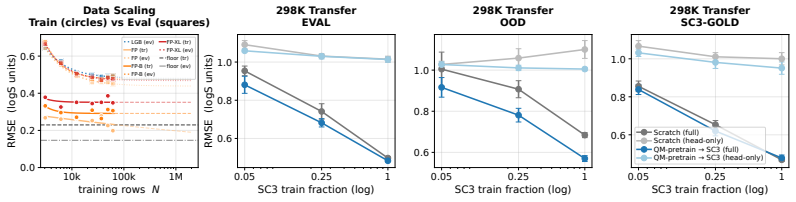
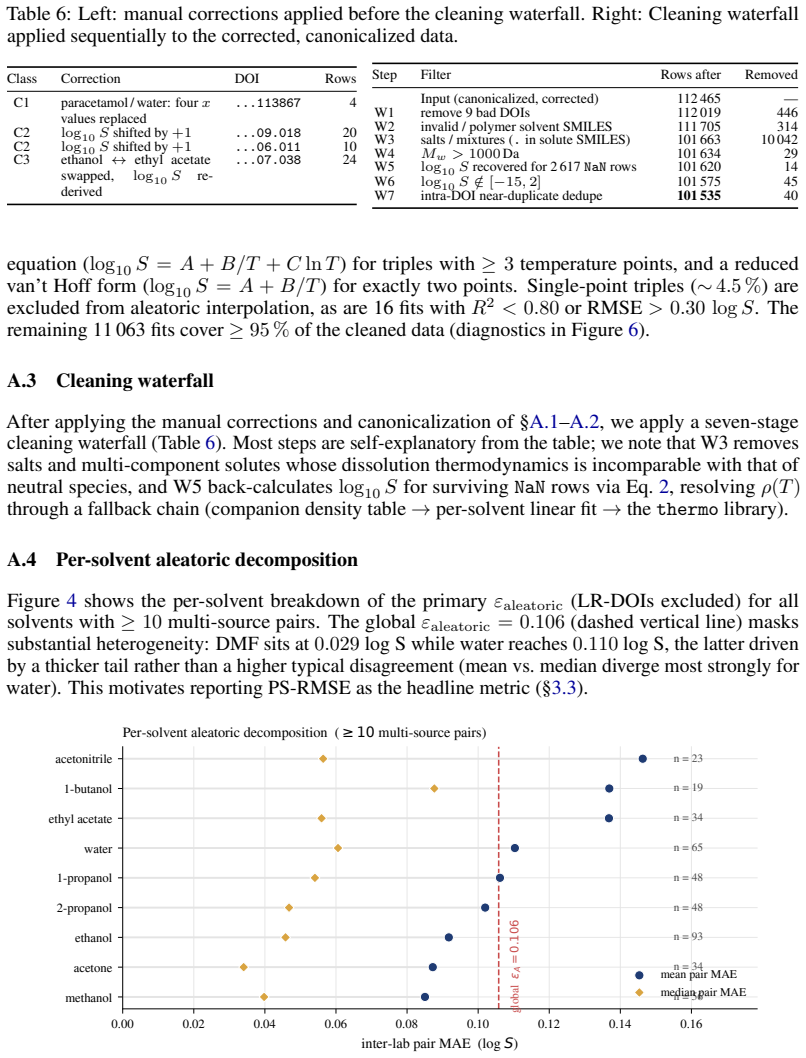
Solubility prediction is a standard benchmark in computational chemistry, yet multi-solvent models which reportedly approach the experimental-noise ceiling (i.e. the aleatoric limit) are not yet reliable enough to be deployed. We argue that this gap is partly artefactual: published benchmarks differ in curation policies, evaluate on count-weighted RMSE that hides failure on tail-heavy solvent distributions, and treat the widely cited 0.6-0.8 log S inter-laboratory figure as the aleatoric ceiling even though it reflects worst-case, not expected, disagreement. We introduce SC3, a multi-solvent solubility benchmark built on BigSolDB v2.1 with three contributions: (i) a reproducible curation pipeline yielding 101,535 measurements over 1,327 solutes and 206 solvents, with a recalibrated aleatoric floor of 0.106 log S-roughly 6 times tighter than the conventional figure; (ii) nested Gold/Silver/Bronze consensus tiers with per-point standard deviation, three leakage-checked splits, and a multi-solvent metric suite (PS-RMSE, Z-RMSE); and (iii) a 31-model benchmark across six families, whose best Bronze PS-RMSE sits at 5 times the aleatoric limit, and we observe this is a gap unclosed by any deep alternative tested. We perform three follow-on analyses: data scaling, transfer from quantum-chemistry solvation energies, and feature-level attribution, which demonstrates that calibrated per-point uncertainty is a reusable infrastructure for diagnosis beyond point prediction.
Editorial analysis
A structured set of objections, weighed in public.
Referee Report
Summary. The paper presents SC3, a new multi-solvent solubility benchmark derived from BigSolDB v2.1 via a reproducible curation pipeline that yields 101,535 measurements across 1,327 solutes and 206 solvents. It introduces nested Gold/Silver/Bronze consensus tiers with per-point standard deviations, three leakage-checked splits, and a metric suite (PS-RMSE, Z-RMSE). The central claims are a recalibrated aleatoric floor of 0.106 log S (roughly 6× tighter than the conventional 0.6-0.8 figure) and that the best of 31 tested models achieves a Bronze PS-RMSE 5× this floor, a gap not closed by deep alternatives; follow-on analyses cover data scaling, quantum-chemistry transfer, and feature attribution.
Significance. If the curation and consensus-SD computation hold, SC3 supplies a substantially tighter, publicly reproducible benchmark and uncertainty infrastructure that could shift solubility modeling practice away from worst-case inter-lab figures toward expected aleatoric limits. The 31-model evaluation across six families, together with the scaling and attribution studies, provides concrete evidence on current model limitations and reusable diagnostic tools. The work explicitly ships a reproducible pipeline and multi-tier consensus data, which are strengths.
major comments (2)
- [Abstract / curation pipeline] Abstract and § on curation pipeline: the recalibrated aleatoric floor of 0.106 log S is computed from per-point consensus standard deviations on the final 101,535 measurements; the manuscript must supply the exact aggregation formula (e.g., how replicates are identified and weighted, handling of solvent/solute filters) because any post-hoc retention of high-consensus entries would systematically lower the reported floor and inflate the claimed 5× gap.
- [Benchmark results] Benchmark results section: the headline claim that the best Bronze PS-RMSE is 5× the aleatoric limit and unclosed by deep models rests on the 0.106 value being an unbiased estimate of experimental variability; without an explicit check that the curation does not truncate tail variability or select for independent replicates, the factor-of-5 result cannot be verified as load-bearing.
minor comments (2)
- [Methods] Clarify the precise definition of the three leakage-checked splits and how solvent/solute overlap is quantified across tiers.
- [Figures] Figure captions for the model-comparison plots should state the exact number of models per family and whether PS-RMSE is count-weighted or solvent-weighted.
Simulated Author's Rebuttal
We thank the referee for the careful and constructive review, which highlights important points for improving the clarity of our curation details and the robustness of the aleatoric floor claim. We address each major comment below and will revise the manuscript to incorporate the requested explicit details and checks.
read point-by-point responses
-
Referee: [Abstract / curation pipeline] Abstract and § on curation pipeline: the recalibrated aleatoric floor of 0.106 log S is computed from per-point consensus standard deviations on the final 101,535 measurements; the manuscript must supply the exact aggregation formula (e.g., how replicates are identified and weighted, handling of solvent/solute filters) because any post-hoc retention of high-consensus entries would systematically lower the reported floor and inflate the claimed 5× gap.
Authors: We agree that an explicit formula is necessary for full reproducibility and to rule out any perception of post-hoc selection. The current Methods section outlines the pipeline at a high level but does not spell out the aggregation step in equation form. In the revision we will add a dedicated paragraph (and pseudocode) stating: replicates are defined as measurements sharing the same solute canonical SMILES, solvent name, and temperature within ±1 K; for each such group the per-point consensus SD is the ordinary sample standard deviation of the log10(S) values (equal weight, no trimming); the aleatoric floor is then the root-mean-square of these SDs over the entire retained set. No filter based on the magnitude of the SD itself is applied at any stage; all points passing the initial solute/solvent validity, temperature range, and numerical checks are kept. This addition will make the 0.106 value directly verifiable from the released code and data. revision: yes
-
Referee: [Benchmark results] Benchmark results section: the headline claim that the best Bronze PS-RMSE is 5× the aleatoric limit and unclosed by deep models rests on the 0.106 value being an unbiased estimate of experimental variability; without an explicit check that the curation does not truncate tail variability or select for independent replicates, the factor-of-5 result cannot be verified as load-bearing.
Authors: The concern is valid: an explicit diagnostic is required to confirm that the curation pipeline preserves the full variability distribution. We will therefore add, in the revised Supplementary Information, (i) a histogram of per-point SDs before and after each curation filter, (ii) a table of the fraction of high-SD (>0.3 log S) points retained at every step, and (iii) a statement that the pipeline aggregates every available replicate without any independence or variability-based subsampling. These diagnostics will show that tail variability is not truncated and that the RMS-based 0.106 figure remains an unbiased estimator of expected experimental scatter. With these additions the 5× gap claim will rest on documented evidence rather than the pipeline description alone. revision: yes
Circularity Check
No significant circularity; benchmark derived from external public database
full rationale
The paper constructs SC3 as an external benchmark from BigSolDB v2.1 via a curation pipeline that produces 101,535 measurements and computes the aleatoric floor (0.106 log S) directly from per-point consensus standard deviations in that data. No derivation chain reduces a claimed prediction or result to its own inputs by construction, no fitted parameters are relabeled as predictions, and no load-bearing claims rest on self-citations or imported uniqueness theorems. The performance gap (best Bronze PS-RMSE at 5× aleatoric limit) is evaluated on the curated splits and is therefore independent of the paper's own equations.
Axiom & Free-Parameter Ledger
free parameters (1)
- aleatoric floor =
0.106
axioms (2)
- domain assumption BigSolDB v2.1 is a suitable and unbiased source for multi-solvent solubility measurements
- domain assumption Consensus standard deviation across repeated measurements accurately captures aleatoric noise
Reference graph
Works this paper leans on
-
[1]
SolECOs: a data-driven platform for sustainable and comprehensive solvent selection in pharmaceutical manufacturing , url =
Ma, Yiming and Gao, Shang and Mehta, Neel and Fu, Qinqing and Li, Wei and Benyahia, Brahim , doi =. SolECOs: a data-driven platform for sustainable and comprehensive solvent selection in pharmaceutical manufacturing , url =. Green Chem. , pages =. 2025 , bdsk-url-1 =
2025
-
[2]
, title =
Bolla, Geetha and Sarma, Bipul and Nangia, Ashwini K. , title =. Chemical Reviews , volume =. 2022 , doi =
2022
-
[3]
2011 , isbn =
Reichardt, Christian and Welton, Thomas , title =. 2011 , isbn =
2011
-
[4]
and Hose, David R
Diorazio, Louis J. and Hose, David R. J. and Adlington, Neil K. , title =. Organic Process Research & Development , volume =. 2016 , doi =
2016
-
[5]
and Fong, Mun Hong and Roh, Jihye and Levin, Itai and Yu, Kevin and Joung, Joonyoung F
Tu, Zhengkai and Choure, Sourabh J. and Fong, Mun Hong and Roh, Jihye and Levin, Itai and Yu, Kevin and Joung, Joonyoung F. and Morgan, Nathan and Li, Shih-Cheng and Sun, Xiaoqi and Lin, Huiqian and Murnin, Mark and Liles, Jordan P. and Struble, Thomas J. and Fortunato, Michael E. and Liu, Mengjie and Green, William H. and Jensen, Klavs F. and Coley, Conn...
2025
-
[6]
Industrial & Engineering Chemistry Research , volume =
Sheikholeslamzadeh, Ehsan and Chen, Chau-Chyun and Rohani, Sohrab , title =. Industrial & Engineering Chemistry Research , volume =. 2012 , doi =
2012
-
[7]
Industrial & Engineering Chemistry Research , volume =
Mendis, Nethrue Pramuditha and Wang, Jiayuan and Lakerveld, Richard , title =. Industrial & Engineering Chemistry Research , volume =. 2022 , doi =
2022
-
[8]
Scientific Data , volume =
Sorkun, Murat Cihan and Khetan, Abhishek and Er, S. Scientific Data , volume =. 2019 , doi =
2019
-
[9]
and Sosnin, Sergey and Bezzubov, Stanislav , title =
Krasnov, Lev and Malikov, Dmitry and Kiseleva, Marina and Tatarin, Sergei V. and Sosnin, Sergey and Bezzubov, Stanislav , title =. Scientific Data , volume =. 2025 , doi =
2025
-
[10]
Malikov, Dmitry and Krasnov, Lev and Kiseleva, Marina and Meshcheriakova, Elizaveta and Kuznetsov, Fedor and Elistratov, Vladimir and Vasiyarov, Matvei and Tatarin, Sergei and Bezzubov, Stanislav , title =. Scientific Data , year =. doi:10.1038/s41597-026-07047-z , note =
-
[11]
Boobier, Samuel and Hose, David R. J. and Blacker, A. John and Nguyen, Bao N. , title =. Nature Communications , volume =. 2020 , doi =
2020
-
[12]
and Doyle, Patrick S
Attia, Lucas and Burns, Jackson W. and Doyle, Patrick S. and Green, William H. , title =. Nature Communications , volume =. 2025 , doi =
2025
-
[13]
Accurately Predicting Solubility Curves via a Thermodynamic Cycle, Machine Learning, and Solvent Ensembles , journal =
Al Ibrahim, Emad and Morgan, Nathan and M. Accurately Predicting Solubility Curves via a Thermodynamic Cycle, Machine Learning, and Solvent Ensembles , journal =. 2025 , doi =
2025
-
[14]
and Kumar, Sabari and P
Jung, Hojin and Stubbs, Christopher D. and Kumar, Sabari and P. Enhancing predictive models for solubility in multicomponent solvent systems using semi-supervised graph neural networks , journal =. 2025 , doi =
2025
-
[15]
and Connaughton, Benedict J
Fowles, Daniel J. and Connaughton, Benedict J. and Carter, James W. and Mitchell, John B. O. and Palmer, David S. , title =. Chemical Reviews , volume =. 2025 , doi =
2025
-
[16]
Scientific Data , volume =
Llompart, Pierre and Minoletti, Claire and Baybekov, Shamkhal and Horvath, Dragos and Marcou, Gilles and Varnek, Alexandre , title =. Scientific Data , volume =. 2024 , doi =
2024
-
[17]
and Mitchell, John B
Palmer, David S. and Mitchell, John B. O. , title =. Molecular Pharmaceutics , volume =. 2014 , doi =
2014
-
[18]
and Green, William H
Vermeire, Florence H. and Green, William H. , title =. Chemical Engineering Journal , volume =. 2021 , doi =
2021
-
[19]
and Valvani, Shri C
Yalkowsky, Samuel H. and Valvani, Shri C. , title =. Journal of Pharmaceutical Sciences , volume =. 1980 , doi =
1980
-
[20]
and Prausnitz, John M
Fredenslund, Aage and Jones, Russell L. and Prausnitz, John M. , title =. AIChE Journal , volume =. 1975 , doi =
1975
-
[21]
, title =
Abraham, Michael H. , title =. Chemical Society Reviews , volume =. 1993 , doi =
1993
-
[22]
, title =
Delaney, John S. , title =. Journal of Chemical Information and Computer Sciences , volume =. 2004 , doi =
2004
-
[23]
Machine Learning , volume =
Breiman, Leo , title =. Machine Learning , volume =. 2001 , doi =
2001
-
[24]
Proceedings of the 22nd ACM SIGKDD International Conference on Knowledge Discovery and Data Mining (KDD '16) , pages =
Chen, Tianqi and Guestrin, Carlos , title =. Proceedings of the 22nd ACM SIGKDD International Conference on Knowledge Discovery and Data Mining (KDD '16) , pages =. 2016 , publisher =
2016
-
[25]
Advances in Neural Information Processing Systems 30 (NeurIPS 2017) , pages =
Ke, Guolin and Meng, Qi and Finley, Thomas and Wang, Taifeng and Chen, Wei and Ma, Weidong and Ye, Qiwei and Liu, Tie-Yan , title =. Advances in Neural Information Processing Systems 30 (NeurIPS 2017) , pages =
2017
-
[26]
Advances in Neural Information Processing Systems 31 (NeurIPS 2018) , year =
Prokhorenkova, Liudmila and Gusev, Gleb and Vorobev, Aleksandr and Dorogush, Anna Veronika and Gulin, Andrey , title =. Advances in Neural Information Processing Systems 31 (NeurIPS 2018) , year =
2018
-
[27]
and Rabiei, Zeinab and Yu, Xue and Ismail, Nadhem and Talukder, Musabbir J
Tayyebi, Arash and Alshami, Ali S. and Rabiei, Zeinab and Yu, Xue and Ismail, Nadhem and Talukder, Musabbir J. and Power, Jason , title =. Journal of Cheminformatics , volume =. 2023 , doi =
2023
-
[28]
Journal of Chemical Information and Modeling , volume =
Rogers, David and Hahn, Mathew , title =. Journal of Chemical Information and Modeling , volume =. 2010 , doi =
2010
-
[29]
and Saigo, Hiroto and Baldi, Pierre , title =
Ralaivola, Liva and Swamidass, Sanjay J. and Saigo, Hiroto and Baldi, Pierre , title =. Neural Networks , volume =. 2005 , doi =
2005
-
[30]
and Green, William H
Burns, Jackson W. and Green, William H. , title =. Journal of Cheminformatics , volume =. 2025 , doi =
2025
-
[31]
and Welling, Max , title =
Kipf, Thomas N. and Welling, Max , title =. Proceedings of the 5th International Conference on Learning Representations (ICLR 2017) , year =
2017
-
[32]
Graph Attention Networks , booktitle =
Veli. Graph Attention Networks , booktitle =. 2018 , url =
2018
-
[33]
Proceedings of the 7th International Conference on Learning Representations (ICLR 2019) , year =
Xu, Keyulu and Hu, Weihua and Leskovec, Jure and Jegelka, Stefanie , title =. Proceedings of the 7th International Conference on Learning Representations (ICLR 2019) , year =
2019
-
[34]
Journal of Chemical Information and Modeling , volume =
Yang, Kevin and Swanson, Kyle and Jin, Wengong and Coley, Connor and Eiden, Philipp and Gao, Hua and Guzman-Perez, Angel and Hopper, Timothy and Kelley, Brian and Mathea, Miriam and Palmer, Andrew and Settels, Volker and Jaakkola, Tommi and Jensen, Klavs and Barzilay, Regina , title =. Journal of Chemical Information and Modeling , volume =. 2019 , doi =
2019
-
[35]
and Chung, Yunsie and Li, Shih-Cheng and Graff, David E
Heid, Esther and Greenman, Kevin P. and Chung, Yunsie and Li, Shih-Cheng and Graff, David E. and Vermeire, Florence H. and Wu, Haoyang and Green, William H. and McGill, Charles J. , title =. Journal of Chemical Information and Modeling , volume =. 2024 , doi =
2024
-
[36]
Deva , title =
Pathak, Yashaswi and Mehta, Sarvesh and Priyakumar, U. Deva , title =. Journal of Chemical Information and Modeling , volume =. 2021 , doi =
2021
-
[37]
Journal of Chemical Theory and Computation , volume =
Ramani, Vansh and Karmakar, Tarak , title =. Journal of Chemical Theory and Computation , volume =. 2024 , doi =
2024
-
[38]
2025 , eprint =
Broadbent, Jonathan and Bailey, Michael and Li, Mingxuan and Paul, Abhishek and De Lescure, Louis and Chauvin, Paul and Kogler-Anele, Lorenzo and Jangjou, Yasser and Jager, Sven , title =. 2025 , eprint =
2025
-
[39]
Artificial Intelligence Chemistry , volume =
Chen, Qiufen and Zhang, Yuewei and Gao, Peng and Zhang, Jun , title =. Artificial Intelligence Chemistry , volume =. 2023 , doi =
2023
-
[40]
and Koes, David R
Francoeur, Paul G. and Koes, David R. , title =. Journal of Chemical Information and Modeling , volume =. 2021 , doi =
2021
-
[41]
Ramani, Vansh and Arora, Ashish and Kuchhal, Dhairya and Ranu, Sayan and Karmakar, Tarak , title =. ChemRxiv , year =. doi:10.26434/chemrxiv.15000014/v2 , note =
-
[42]
Advances in Neural Information Processing Systems 37 (NeurIPS 2024) , year =
Ji, Xiaohong and Wang, Zhen and Gao, Zhifeng and Zheng, Hang and Zhang, Linfeng and Ke, Guolin and E, Weinan , title =. Advances in Neural Information Processing Systems 37 (NeurIPS 2024) , year =. 2406.14969 , archivePrefix =
arXiv 2024
-
[43]
Communications Chemistry , year =
Cai, Feiyang and Zacour, Katelin and Zhu, Tianyu and Tzeng, Tzuen-Rong and Duan, Yongping and Liu, Ling and Pilla, Srikanth and Li, Gang and Luo, Feng , title =. Communications Chemistry , year =. doi:10.1038/s42004-025-01793-8 , note =
-
[44]
and Lee, Su-In , title =
Lundberg, Scott M. and Lee, Su-In , title =. Advances in Neural Information Processing Systems 30 (NIPS 2017) , year =
2017
discussion (0)
Sign in with ORCID, Apple, or X to comment. Anyone can read and Pith papers without signing in.