Statistical-Uncertainty-Driven Selection of Evaluation Frequency for Time-Dependent Sensing Calibration: A Demonstration with KAGRA Data
Pith reviewed 2026-06-27 11:58 UTC · model grok-4.3
The pith
A statistical method selects 244 Hz to minimize calibration uncertainty in KAGRA sensing data
A machine-rendered reading of the paper's core claim, the machinery that carries it, and where it could break.
Core claim
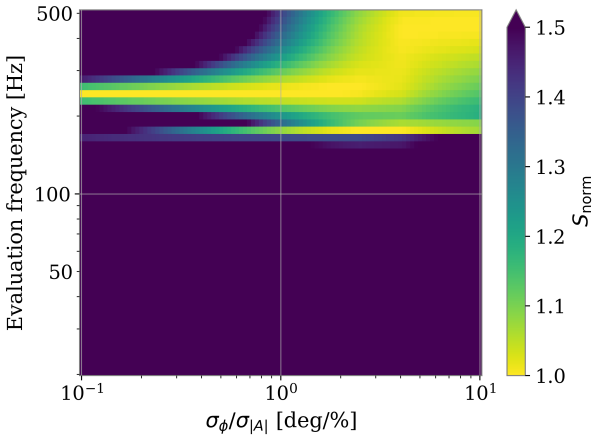
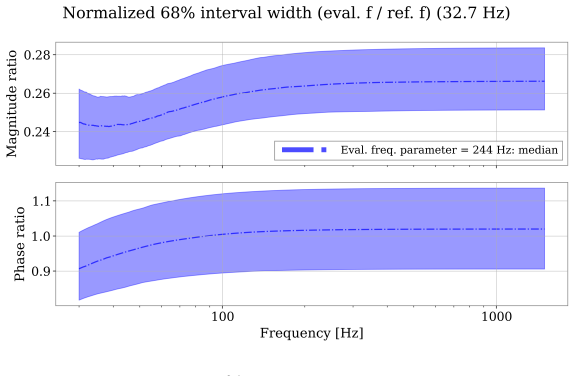
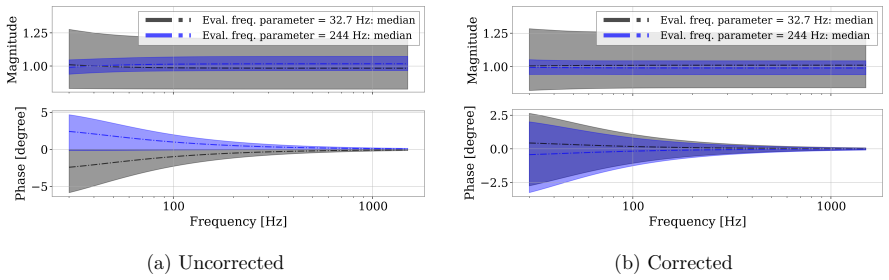
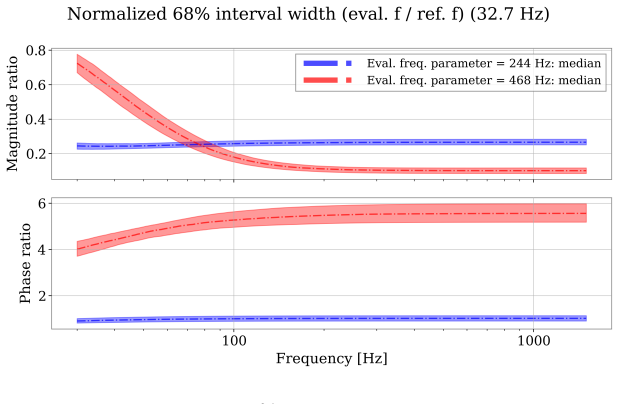
When a 1% amplitude interval width and a 1 degree phase interval width are weighted equally, 244 Hz is selected in all 4096 s analysis segments throughout the analyzed period. Relative to the reference frequency of 32.7 Hz, the amplitude interval width is reduced to about one quarter over a broad frequency range, while the phase interval width remains broadly comparable.
What carries the argument
A ranking score that combines the widths of amplitude and phase uncertainty intervals, where the uncertainties are obtained from empirical percentiles of the sample distribution in each analysis segment.
If this is right
- The selected frequency can replace or supplement the reference line for tracking sensing variations in ongoing runs.
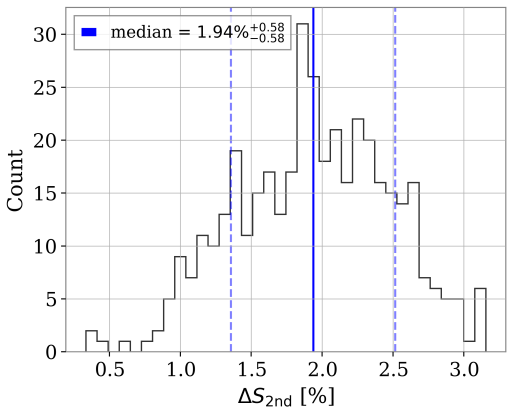
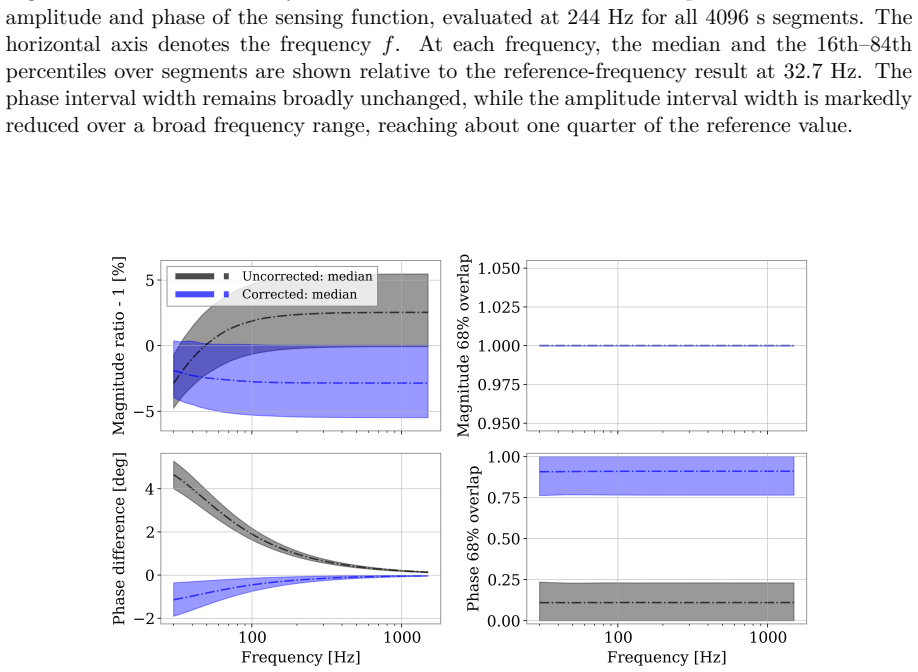
- The separate assessment of frequency-translation discrepancy provides a way to correct for any offset introduced by moving the evaluation point.
- The same percentile-based scoring can be applied to other detectors that face injection-frequency constraints.
- Segment-by-segment re-ranking allows the chosen frequency to adapt if data properties change over longer periods.
Where Pith is reading between the lines
- The percentile method could be tested against bootstrap or analytic variance estimates to check robustness when sample sizes vary.
- Integrating the ranking into automated calibration pipelines would allow dynamic frequency choice without manual intervention.
- The framework may generalize to other time-varying transfer functions in precision instruments where direct measurement at optimal points is blocked.
Load-bearing premise
The segment-wise statistical uncertainty is quantified from empirical percentiles of the sample distribution and that this measure accurately reflects the true variability in the sensing function parameters without unaccounted biases from data properties or model assumptions.
What would settle it
An independent end-to-end simulation or separate calibration measurement that injects known signals and directly compares the recovered sensing parameters at 244 Hz versus 32.7 Hz; if the actual errors at 244 Hz are not smaller by the predicted factor, the selection is falsified.
Figures
read the original abstract
Accurate calibration of the gravitational-wave strain h(t) is essential for both detection and astrophysical inference. In operating detectors, slow temporal variations in the sensing response are tracked using calibration lines, but practical constraints can prevent those lines from being injected at frequencies that are favorable for precise estimation of sensing-side parameters. We present a statistical framework for preselecting evaluation frequencies under such constraints. We apply this framework to KAGRA data from the first part of the fourth LIGO-Virgo-KAGRA Observing Run, for which the nominal cavity-pole frequency was about 18 Hz, while the sensing-side calibration line used in practice was injected at 32.7 Hz. For each candidate evaluation frequency, we construct the sensing function, quantify its segment-wise statistical uncertainty from empirical percentiles of the sample distribution, and rank the candidates using a score that combines the interval widths of the amplitude and phase. When a 1% amplitude interval width and a 1 degree phase interval width are weighted equally, 244 Hz is selected in all 4096 s analysis segments throughout the analyzed period. Relative to the reference frequency of 32.7 Hz, the amplitude interval width is reduced to about one quarter over a broad frequency range, while the phase interval width remains broadly comparable. We also assess the discrepancy introduced by frequency translation separately. These results suggest that the proposed method provides a useful statistical preselection framework for evaluation frequencies under practical operational constraints.
Editorial analysis
A structured set of objections, weighed in public.
Referee Report
Summary. The manuscript presents a statistical framework for preselecting evaluation frequencies for time-dependent sensing calibration in gravitational-wave detectors under operational constraints. Applied to KAGRA O4 data (nominal cavity pole ~18 Hz, reference line at 32.7 Hz), it constructs the sensing function at candidate frequencies, quantifies segment-wise statistical uncertainty via empirical percentiles of the sample distribution for amplitude and phase, and ranks candidates by a combined score. When 1% amplitude and 1° phase interval widths are weighted equally, 244 Hz is selected in every 4096 s segment; relative to 32.7 Hz the amplitude width is reduced by a factor of ~4 over a broad range while phase width remains comparable. Frequency-translation discrepancy is assessed separately.
Significance. If the percentile-based uncertainties prove reliable, the framework offers a practical, data-driven tool for optimizing calibration-line placement, which could tighten strain calibration and thereby improve both detection statistics and astrophysical inference in operating detectors.
major comments (2)
- [Statistical uncertainty quantification and results sections] The central claim (consistent selection of 244 Hz and factor-of-four amplitude improvement) rests on the premise that segment-wise empirical percentiles accurately capture true parameter variability. The manuscript assesses frequency-translation discrepancy separately but does not appear to include direct tests (e.g., injection-recovery simulations or comparison against known stationary segments) for systematic offsets arising from non-stationary noise, finite-sample effects, or sensing-function model assumptions; this validation gap is load-bearing for the reliability of the ranking.
- [Results on frequency selection] The statement that 244 Hz is selected “in all 4096 s analysis segments throughout the analyzed period” is presented without reporting the total number of segments, the distribution of scores across segments, or any measure of consistency (e.g., fraction of segments or variance of the selected frequency); this weakens the strength of the “all segments” claim.
minor comments (2)
- [Abstract and methods] The specific numerical thresholds (1 % amplitude, 1° phase) used for equal weighting are stated but lack an explicit justification or sensitivity study showing how the selected frequency changes with modest variations in these values.
- [Introduction] The relevance of the nominal cavity-pole frequency (~18 Hz) to the sensing-function construction and to the choice of candidate evaluation frequencies could be stated more explicitly for readers outside the KAGRA collaboration.
Simulated Author's Rebuttal
We thank the referee for the constructive and detailed review. We address each major comment below and indicate the revisions that will be made to the manuscript.
read point-by-point responses
-
Referee: [Statistical uncertainty quantification and results sections] The central claim (consistent selection of 244 Hz and factor-of-four amplitude improvement) rests on the premise that segment-wise empirical percentiles accurately capture true parameter variability. The manuscript assesses frequency-translation discrepancy separately but does not appear to include direct tests (e.g., injection-recovery simulations or comparison against known stationary segments) for systematic offsets arising from non-stationary noise, finite-sample effects, or sensing-function model assumptions; this validation gap is load-bearing for the reliability of the ranking.
Authors: The empirical-percentile method is deliberately non-parametric and extracts uncertainty directly from the observed sample distribution within each data segment, thereby incorporating the effects of any non-stationarities that are actually present. The separate frequency-translation assessment already quantifies one class of model-related discrepancy. We nevertheless agree that explicit cross-checks against stationary segments or injection-recovery tests would further support the reliability of the ranking. In the revised manuscript we will add a dedicated validation subsection that performs such checks on the available KAGRA segments and discusses the remaining limitations. revision: yes
-
Referee: [Results on frequency selection] The statement that 244 Hz is selected “in all 4096 s analysis segments throughout the analyzed period” is presented without reporting the total number of segments, the distribution of scores across segments, or any measure of consistency (e.g., fraction of segments or variance of the selected frequency); this weakens the strength of the “all segments” claim.
Authors: We agree that the consistency claim should be quantified. The revised manuscript will state the exact number of 4096 s segments analyzed, report summary statistics (mean, median, and standard deviation) of the combined scores across those segments, and explicitly give the fraction of segments in which 244 Hz received the highest score. revision: yes
Circularity Check
No circularity: empirical percentile ranking is self-contained data processing
full rationale
The paper's core procedure constructs the sensing function per segment, extracts amplitude and phase interval widths directly from empirical percentiles of the observed sample distribution, and ranks candidate frequencies by a weighted score on those widths. No parameter is fitted to a subset and then re-predicted; no self-citation supplies a uniqueness theorem or ansatz; the selection of 244 Hz follows immediately from applying the percentile-derived widths to the KAGRA data segments. The method therefore reduces to straightforward statistical summarization of the input time series rather than any definitional or fitted-input loop.
Axiom & Free-Parameter Ledger
free parameters (1)
- relative weighting of amplitude and phase interval widths
axioms (1)
- domain assumption Empirical percentiles of the sample distribution provide an accurate quantification of statistical uncertainty in the sensing function parameters.
Reference graph
Works this paper leans on
-
[1]
Effect of calibration errors on Bayesian parameter estimation for gravitational wave signals from inspiral binary systems in the advanced detectors era
Salvatore Vitale et al. “Effect of calibration errors on Bayesian parameter estimation for gravitational wave signals from inspiral binary systems in the advanced detectors era”. In: Phys. Rev. D85 (6 Mar. 2012), p. 064034.url:https://link.aps.org/doi/10.1103/ PhysRevD.85.064034
2012
-
[2]
Impact of calibration uncertainties on Hubble constant measurements from gravitational-wave sources
Yiwen Huang et al. “Impact of calibration uncertainties on Hubble constant measurements from gravitational-wave sources”. In:Phys. Rev. D111 (6 Mar. 2025), p. 063034.url: https://link.aps.org/doi/10.1103/PhysRevD.111.063034
-
[3]
Evan D Hall et al. “Systematic calibration error requirements for gravitational-wave detec- tors via the Cramér–Rao bound”. In:Classical and Quantum Gravity36.20 (Sept. 2019), p. 205006.url:https://doi.org/10.1088/1361-6382/ab368c. 10
-
[4]
2021 a , Progress of Theoretical and Experimental Physics, 2021, 05A101, 10.1093/ptep/ptaa125
T Akutsu et al. “Overview of KAGRA: Detector design and construction history”. In: Progress of Theoretical and Experimental Physics2021.5 (Aug. 2020), 05A101.issn: 2050- 3911.url:https://doi.org/10.1093/ptep/ptaa125
-
[5]
The LIGO Scientific Collaboration et al. “Advanced LIGO”. In:Classical and Quantum Gravity32.7 (Mar. 2015), p. 074001.url:https://doi.org/10.1088/0264-9381/32/7/ 074001
-
[6]
2015, Classical and Quantum Gravity, 32, 024001, 10.1088/0264-9381/32/2/024001
F Acernese et al. “Advanced Virgo: a second-generation interferometric gravitational wave detector”. In:Classical and Quantum Gravity32.2 (Dec. 2014), p. 024001.url:https: //doi.org/10.1088/0264-9381/32/2/024001
-
[7]
2025 c , , 995, L18, 10.3847/2041-8213/ae0c06
A. G. Abac et al. “GWTC-4.0: An Introduction to Version 4.0 of the Gravitational-Wave Transient Catalog”. In:The Astrophysical Journal Letters995.1 (Dec. 2025), p. L18.url: https://doi.org/10.3847/2041-8213/ae0c06
-
[8]
Improving LIGO calibration accuracy by tracking and compensat- ing for slow temporal variations
D Tuyenbayev et al. “Improving LIGO calibration accuracy by tracking and compensat- ing for slow temporal variations”. In:Classical and Quantum Gravity34.1 (Dec. 2016), p. 015002.url:https://doi.org/10.1088/0264-9381/34/1/015002
-
[9]
M Wade et al. “Improving LIGO calibration accuracy by using time-dependent filters to compensate for temporal variations”. In:Classical and Quantum Gravity40.3 (Jan. 2023), p. 035001.url:https://doi.org/10.1088/1361-6382/acabf6
-
[10]
(Accessed: 2026- 04-27)
Yamamoto Takahiro.Candidate of new frequencies for calibration lines. (Accessed: 2026- 04-27). 2023.url:https://klog.icrr.u-tokyo.ac.jp/osl/?r=25235
2026
-
[11]
A D Viets et al. “Reconstructing the calibrated strain signal in the Advanced LIGO de- tectors”. In:Classical and Quantum Gravity35.9 (Apr. 2018), p. 095015.url:https : //doi.org/10.1088/1361-6382/aab658
-
[12]
2021 b , Progress of Theoretical and Experimental Physics, 2021, 05A102, 10.1093/ptep/ptab018
T Akutsu et al. “Overview of KAGRA: Calibration, detector characterization, physical environmental monitors, and the geophysics interferometer”. In:Progress of Theoretical and Experimental Physics2021.5 (Feb. 2021), 05A102.issn: 2050-3911.url:https:// doi.org/10.1093/ptep/ptab018
-
[13]
2026.url:https://arxiv.org/abs/ 2606.09010
Shingo Hido et al.Statistical Estimation and Correction of Model-Measurement Bias in Time-Dependent Correction Factors of KAGRA. 2026.url:https://arxiv.org/abs/ 2606.09010
Pith/arXiv arXiv 2026
-
[14]
(Accessed: 2026-04-01)
Hido Shingo and Yamamoto Takahiro.MN stage in the offline/low-latency reconstruction pipelines. (Accessed: 2026-04-01). 2024.url:https://klog.icrr.u-tokyo.ac.jp/osl/ ?r=29691. 11
2026
discussion (0)
Sign in with ORCID, Apple, or X to comment. Anyone can read and Pith papers without signing in.