Multi-band Structural Analysis of KiDS-selected Low Surface Brightness Galaxies with Hyper Suprime-Cam Imaging
Pith reviewed 2026-06-26 17:09 UTC · model grok-4.3
The pith
KiDS-selected LSBG candidates are confirmed as genuine low surface brightness galaxies through HSC multi-band analysis.
A machine-rendered reading of the paper's core claim, the machinery that carries it, and where it could break.
Core claim
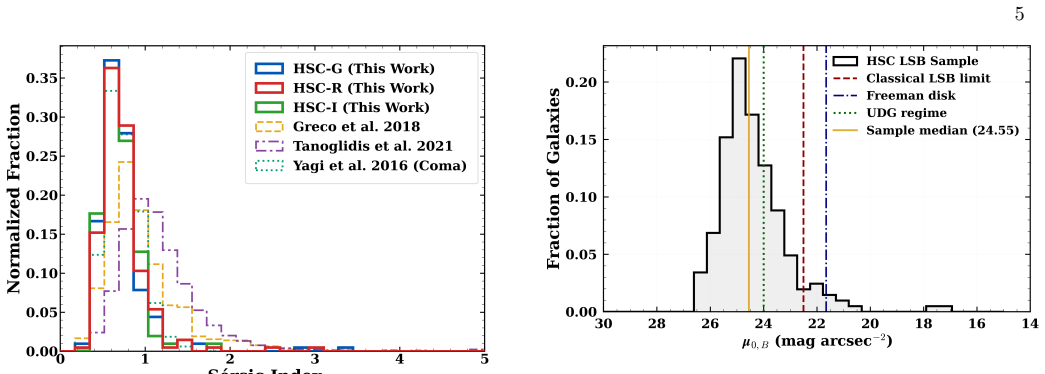
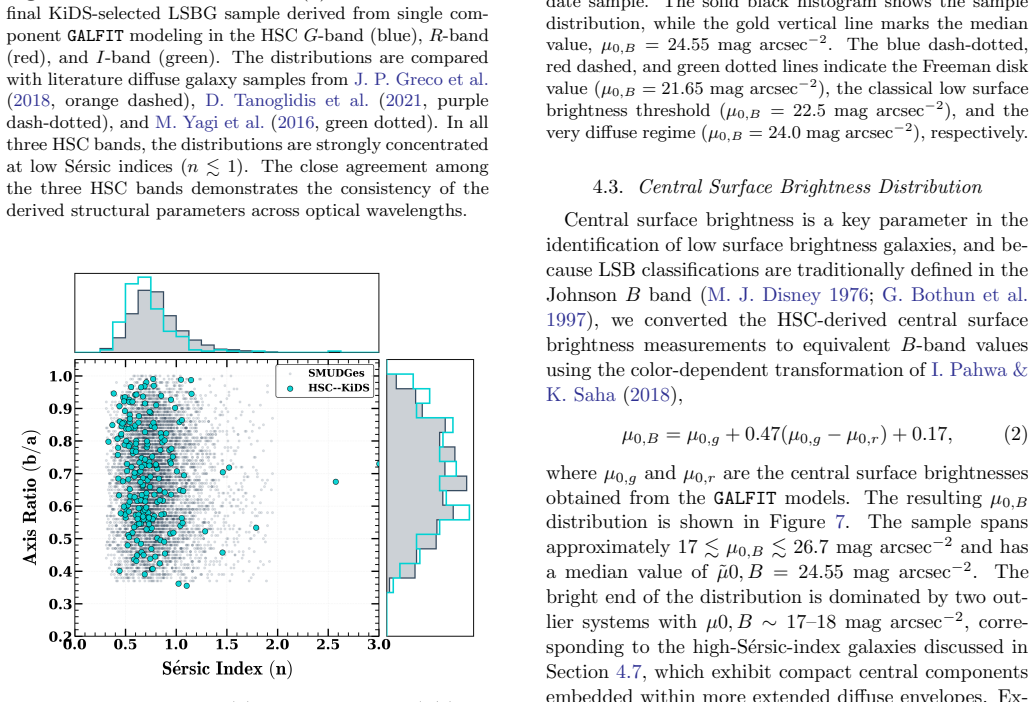
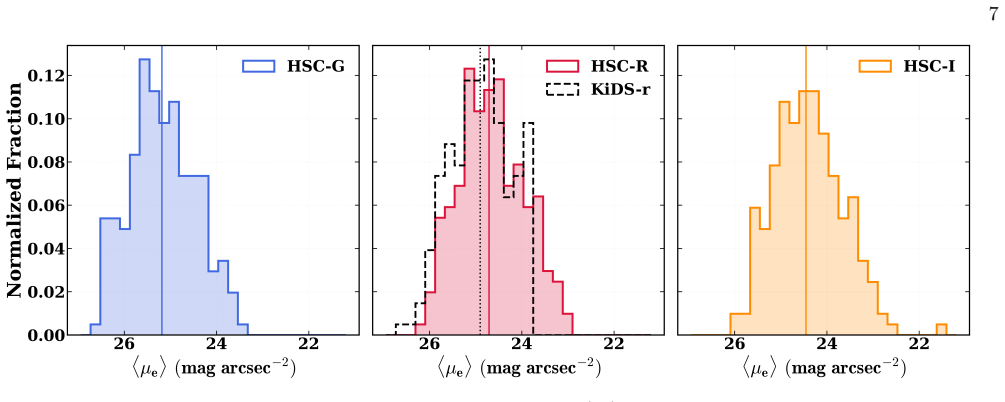
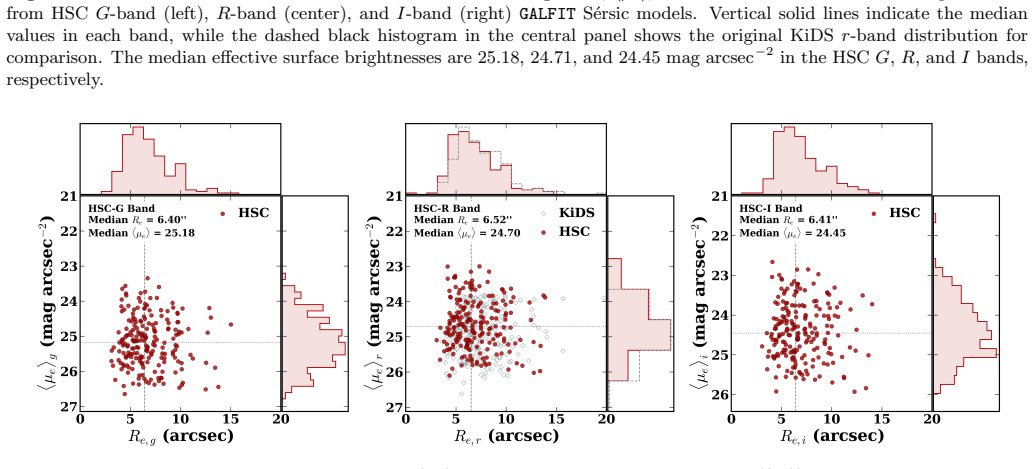
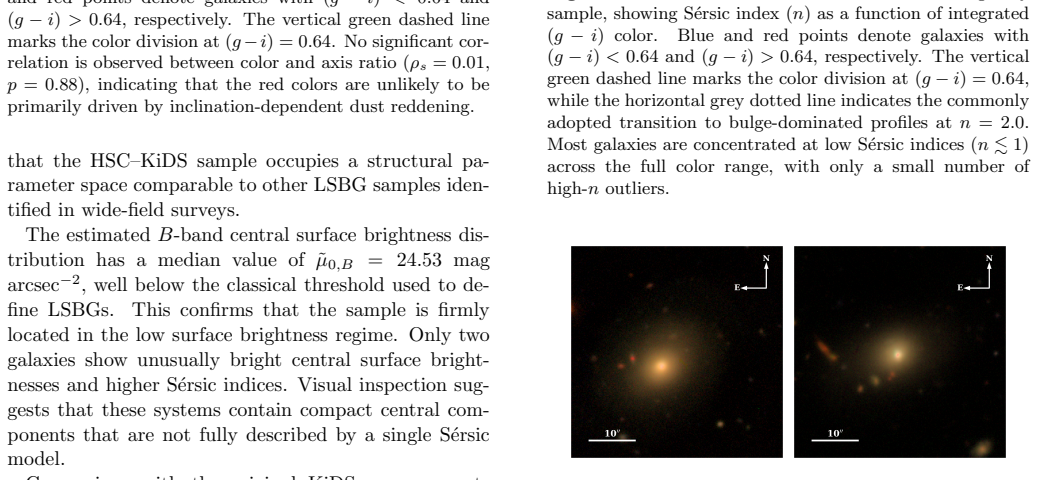
Single-component Sersic modeling with GALFIT on HSC G, R, and I images of 205 KiDS-selected LSBG candidates yields Sersic index distributions that peak near n ≈ 0.7 across all bands, a median B-band central surface brightness of 24.55 mag arcsec^{-2}, and a strong red dominance (178 red versus 27 blue) with no significant structural differences between the color subsamples and no color-axis ratio correlation, thereby confirming that the candidates are predominantly genuine low surface brightness galaxies.
What carries the argument
Single-component Sersic profile fitting with GALFIT applied to deep multi-band HSC imaging to extract Sersic index, effective radius, axis ratio, and central surface brightness for each galaxy.
If this is right
- Structural parameters remain consistent across the G, R, and I bands for the full sample.
- Red and blue LSBGs share similar Sersic indices, sizes, axis ratios, and surface brightnesses.
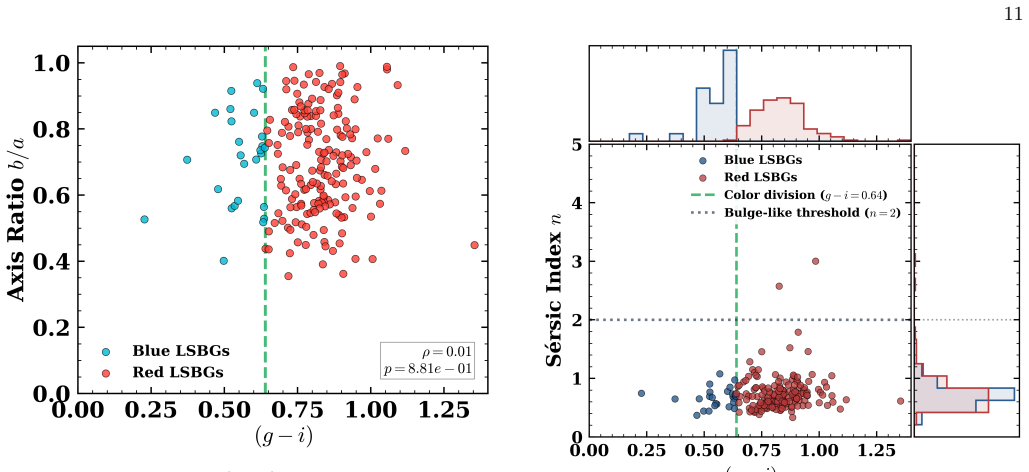
- Absence of color-axis ratio correlation makes dust reddening unlikely as the main cause of the red colors.
- The resulting catalog supplies a well-characterized structural reference set of LSBGs inside the HSC footprint.
Where Pith is reading between the lines
- The structural similarity across color classes may imply common formation pathways that do not depend strongly on recent star formation.
- Applying multi-component fits to the same HSC images could test whether the single-Sersic assumption introduces systematic offsets in the derived parameters.
- Cross-matching the catalog with spectroscopic or HI surveys could quantify how representative the KiDS selection is of the full LSBG population.
Load-bearing premise
Single-component Sersic modeling with GALFIT provides an adequate description of the light distribution without significant bias from multi-component structure, sky subtraction errors, or selection effects in the original KiDS catalog.
What would settle it
A substantial fraction of the 205 candidates showing central surface brightness brighter than 23 mag arcsec^{-2} or Sersic indices well above 1 in independent deeper imaging or spectroscopy would indicate they are not predominantly genuine LSBGs.
Figures
read the original abstract
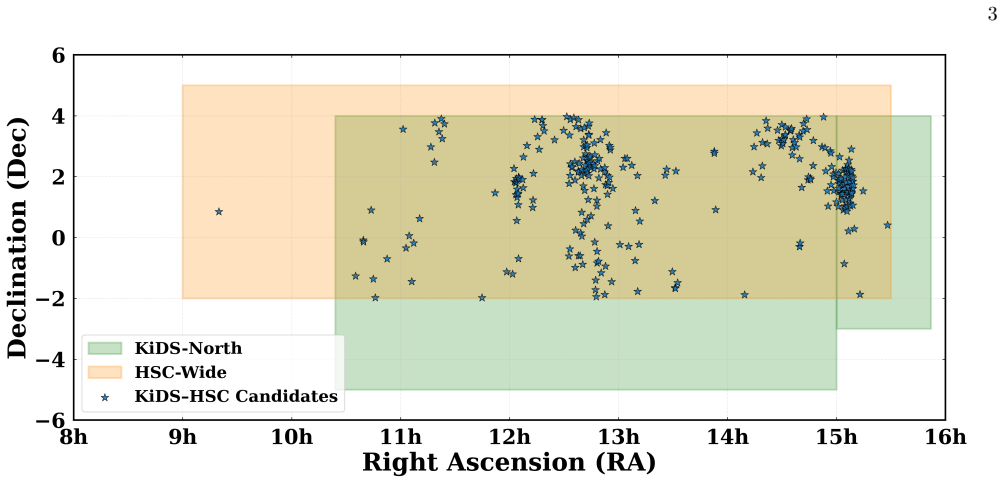
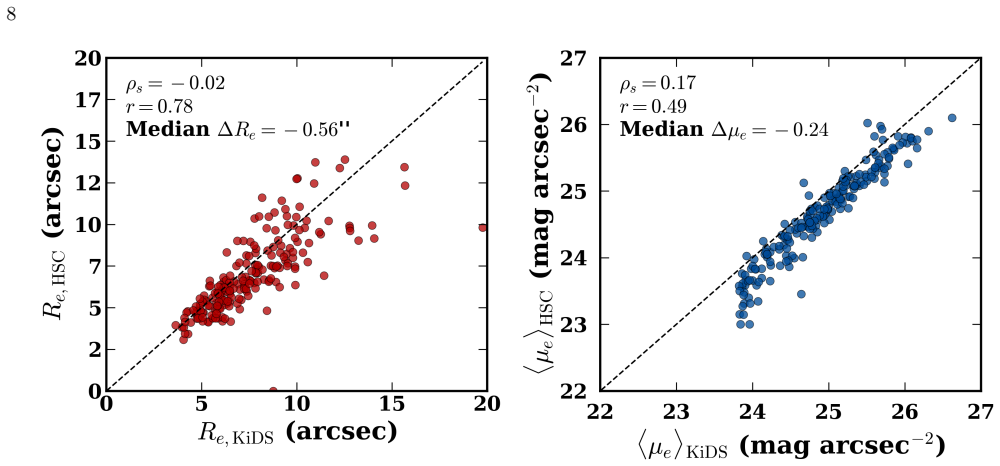
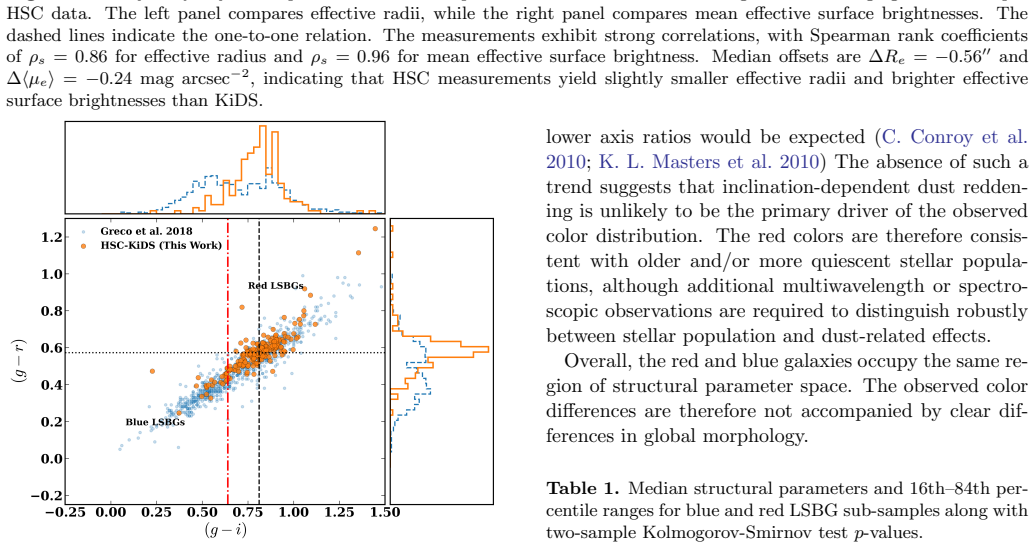
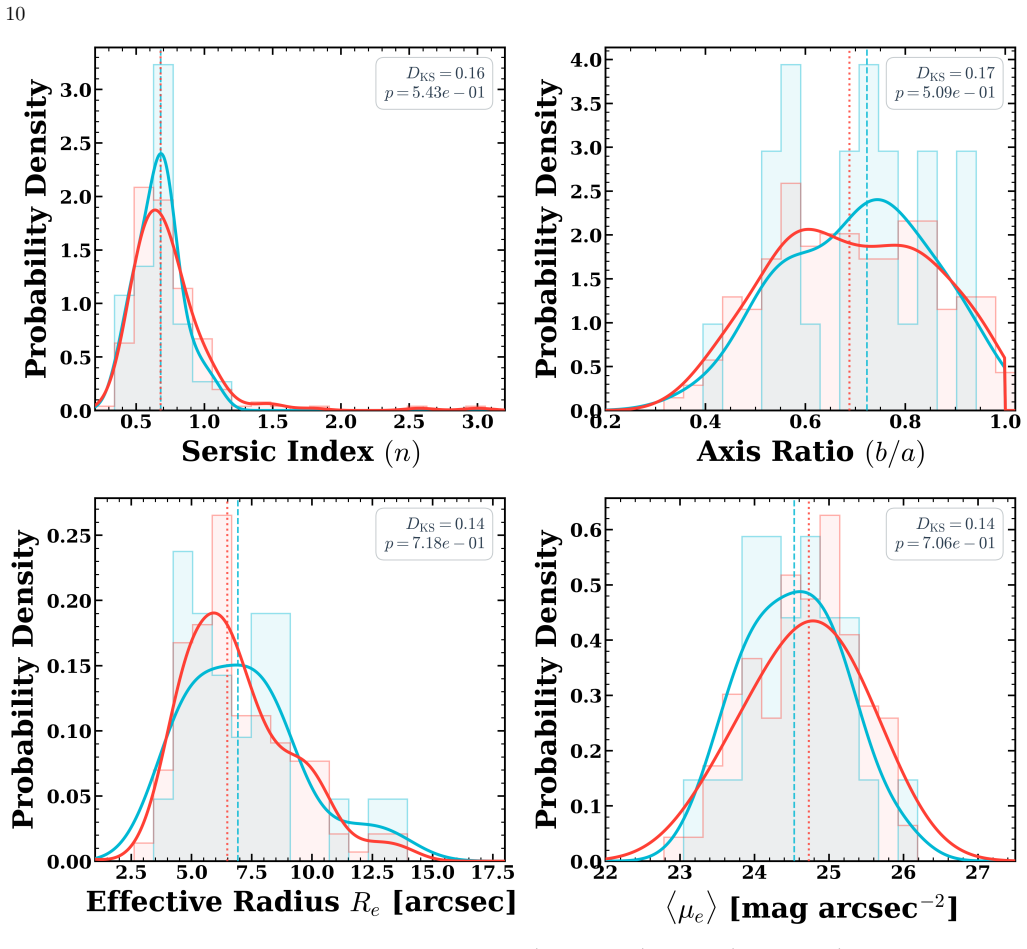
We present a homogeneous multi-band structural analysis of 205 KiDS-selected low surface brightness galaxy (LSBG) candidates using deep Hyper Suprime-Cam (HSC) $G$, $R$, and $I$-band imaging. Structural parameters were derived using single-component S\'ersic modeling with GALFIT. The sample is dominated by diffuse systems with low S\'ersic indices, with the distributions consistently peaking near $n\approx0.7$ across all bands. The estimated $B$-band central surface brightness distribution has a median value of $\tilde{\mu}_{0,B}=24.55$ mag arcsec$^{-2}$, indicating that the galaxies lie firmly within the low surface brightness regime. The catalog is strongly dominated by red systems, comprising 178 red LSBGs (87.3$\%$) and 27 blue LSBGs (12.7$\%$). Despite this color bimodality, the red and blue subsamples show similar structural properties, with no statistically significant differences in S\'ersic index, effective radius, axis ratio, or surface brightness distributions. The absence of a correlation between color and axis ratio further suggests that dust reddening is unlikely to be the primary driver of the red colors. Overall, the sample provides a well-characterized structural reference set of LSBGs in the HSC footprint and confirms that the KiDS selected candidates are predominantly genuine low surface brightness galaxies.
Editorial analysis
A structured set of objections, weighed in public.
Referee Report
Summary. The paper presents a homogeneous multi-band structural analysis of 205 KiDS-selected LSBG candidates using deep HSC G, R, and I imaging. Structural parameters are obtained via single-component Sérsic modeling with GALFIT, yielding a sample dominated by low-n (n≈0.7) diffuse systems with median μ0,B = 24.55 mag arcsec⁻². The catalog is 87% red and 13% blue, with no significant structural differences between color subsamples and no color–axis ratio correlation; the authors conclude that the KiDS candidates are predominantly genuine LSBGs and provide a well-characterized reference set in the HSC footprint.
Significance. If the single-Sérsic parameters are shown to be robust, the work supplies a useful homogeneous structural catalog of LSBGs overlapping the HSC footprint, with quantified color and structural distributions that can serve as a reference for future studies. The reported similarity in structural properties between red and blue subsamples and the lack of color–axis ratio correlation are potentially valuable observational constraints.
major comments (2)
- [Methods / GALFIT modeling description] The confirmation that KiDS candidates are genuine LSBGs (median μ0,B = 24.55) and the utility of the catalog as a reference set rest directly on the reliability of the GALFIT single-Sérsic parameters. No fit-quality metrics (reduced χ², residual maps, or visual inspection results), formal error estimation procedures, or tests for sky-subtraction systematics in extended low-surface-brightness systems are described; such information is required to assess possible biases in μ0, Re, and n for diffuse objects.
- [Results / red vs. blue comparison] The claim of no statistically significant differences between red and blue subsamples in Sérsic index, effective radius, axis ratio, and surface brightness is derived from the same single-component fits. Without reported goodness-of-fit diagnostics or multi-component tests, it is unclear whether unmodeled substructure (faint disks or envelopes) could introduce systematic offsets that affect the red/blue comparison.
minor comments (2)
- [Abstract] The abstract states the red fraction as 87.3% and blue as 12.7%; consistent decimal precision should be used throughout.
- [Results] The B-band central surface brightness is reported as a median but the conversion from the fitted GRI bands is not detailed; a brief description of the color term or k-correction applied would improve reproducibility.
Simulated Author's Rebuttal
We thank the referee for their constructive comments, which highlight important aspects of the GALFIT analysis and the robustness of our red/blue comparisons. We address each major comment below and will revise the manuscript to incorporate additional details and tests.
read point-by-point responses
-
Referee: [Methods / GALFIT modeling description] The confirmation that KiDS candidates are genuine LSBGs (median μ0,B = 24.55) and the utility of the catalog as a reference set rest directly on the reliability of the GALFIT single-Sérsic parameters. No fit-quality metrics (reduced χ², residual maps, or visual inspection results), formal error estimation procedures, or tests for sky-subtraction systematics in extended low-surface-brightness systems are described; such information is required to assess possible biases in μ0, Re, and n for diffuse objects.
Authors: We agree that the current manuscript lacks explicit reporting of fit-quality metrics, error procedures, and sky-subtraction tests, which limits assessment of parameter reliability for these diffuse systems. In the revised version we will add a dedicated subsection to the Methods describing: (i) the distribution of reduced χ² values across the sample, (ii) results from visual inspection of residual maps for the full sample (or a statistically representative subset), (iii) the formal uncertainties returned by GALFIT together with any additional Monte-Carlo error estimation we performed, and (iv) the sky-subtraction approach used with the deep HSC data and any dedicated tests (e.g., varying sky annuli or comparing with independent sky estimates) to quantify possible biases in μ0, Re, and n. These additions will directly address the referee’s concern. revision: yes
-
Referee: [Results / red vs. blue comparison] The claim of no statistically significant differences between red and blue subsamples in Sérsic index, effective radius, axis ratio, and surface brightness is derived from the same single-component fits. Without reported goodness-of-fit diagnostics or multi-component tests, it is unclear whether unmodeled substructure (faint disks or envelopes) could introduce systematic offsets that affect the red/blue comparison.
Authors: We acknowledge that the absence of goodness-of-fit diagnostics makes it difficult to exclude the possibility that unmodeled substructure could introduce differential biases between the red and blue subsamples. In the revision we will (i) present a quantitative comparison of residual-map statistics (e.g., median residual flux and χ² per degree of freedom) between the two color subsamples, (ii) perform a limited multi-component (Sérsic + exponential) test on a random subset of ~30 galaxies from each color class to assess whether single-Sérsic parameters are systematically affected, and (iii) qualify the red/blue comparison statements to note the limitations of the single-component modeling. These steps will strengthen the robustness of the reported similarity in structural properties. revision: yes
Circularity Check
Purely observational characterization; no derivations or fitted predictions
full rationale
The paper reports GALFIT single-Sersic fits to HSC imaging of KiDS candidates and tabulates resulting parameter distributions (n≈0.7, median μ0,B=24.55, red/blue fractions, lack of color–axis-ratio correlation). These are direct measurements and summary statistics, not quantities derived from equations, first-principles models, or prior fits that are then re-presented as predictions. No self-citations, uniqueness theorems, or ansatzes appear in the load-bearing steps. The central claim (KiDS candidates are genuine LSBGs forming a reference set) follows immediately from the measured surface-brightness values falling below the conventional LSB threshold; the step is empirical classification, not circular.
Axiom & Free-Parameter Ledger
axioms (1)
- domain assumption Single-component Sersic profiles adequately describe the light distribution of the LSBG sample
Reference graph
Works this paper leans on
-
[1]
Adams, E. A. K., vSiljeg, B., Ponomareva, A., et al. 2026, Astronomy & Astrophysics, doi: 10.1051/0004-6361/202557163
-
[2]
The Hyper Suprime-Cam SSP Survey: Overview and Survey Design
Aihara, H., Arimoto, N., Armstrong, R., et al. 2018, PASJ, 70, S4, doi: 10.1093/pasj/psx066
work page internal anchor Pith review doi:10.1093/pasj/psx066 2018
-
[3]
Aihara, H., AlSayyad, Y., Ando, M., et al. 2022, PASJ, 74, 247, doi: 10.1093/pasj/psab122 Astropy Collaboration. 2013, Astronomy & Astrophysics, 558, A33, doi: 10.1051/0004-6361/201322068 Astropy Collaboration. 2018, The Astronomical Journal, 156, 123, doi: 10.3847/1538-3881/aabc4f Astropy Collaboration. 2022, The Astrophysical Journal, 935, 167, doi: 10....
-
[4]
2016, Journal of Open Source Software, 1, 58, doi:10.21105/joss.00058
Barbary, K. 2016, The Journal of Open Source Software, 1, 58, doi: 10.21105/joss.00058
-
[5]
2023, The Astrophysical Journal Supplement Series, 267, 10, doi: 10.3847/1538-4365/acd3e7
Yamanoi, H. 2023, The Astrophysical Journal Supplement Series, 267, 10, doi: 10.3847/1538-4365/acd3e7
-
[6]
Rauscher, B. J. 1999, MNRAS, 302, L55, doi: 10.1046/j.1365-8711.1999.02282.x
-
[7]
1996, , 117, 393, 10.1051/aas:1996164
Bertin, E., & Arnouts, S. 1996, A&AS, 117, 393, doi: 10.1051/aas:1996164 2 https://hsc-release.mtk.nao.ac.jp/doc/ 3 https://kids.strw.leidenuniv.nl/
-
[8]
, archivePrefix = "arXiv", eprint =
Blanton, M. R., & Moustakas, J. 2009, ARA&A, 47, 159, doi: 10.1146/annurev-astro-082708-101734
-
[9]
1997, PASP, 109, 745
Bothun, G., Impey, C., & McGaugh, S. 1997, PASP, 109, 745
1997
-
[10]
Bullock, J. S., & Boylan-Kolchin, M. 2017, ARA&A, 55, 343, doi: 10.1146/annurev-astro-091916-055313
-
[11]
2001, AJ, 122, 2318
Burkholder, V., Impey, C., & Sprayberry, D. 2001, AJ, 122, 2318
2001
-
[12]
2024, The Open Journal of Astrophysics, 7, 89, doi: 10.33232/001c.124536
Chicoine, N., Prat, J., Zacharegkas, G., et al. 2024, The Open Journal of Astrophysics, 7, 89, doi: 10.33232/001c.124536
-
[13]
2018, ApJ, 868, 96, doi: 10.3847/1538-4357/aae7c8
Cohen, Y., Dokkum, P. V., Danieli, S., et al. 2018, The Astrophysical Journal, 868, doi: 10.3847/1538-4357/aae7c8
-
[14]
Conroy, C., Schiminovich, D., & Blanton, M. R. 2010, The Astrophysical Journal, 718, 184, doi: 10.1088/0004-637X/718/1/184 de Blok, W. J. G., & McGaugh, S. S. 1997, MNRAS, 290, 533, doi: 10.1093/mnras/290.3.533 de Jong, J. T. A., Verdoes Kleijn, G. A., Kuijken, K. H., &
-
[15]
Valentijn, E. A. 2013, Experimental Astronomy, 35, 25, doi: 10.1007/s10686-012-9306-1
-
[16]
Disney, M. J. 1976, Nature, 263, 573, doi: 10.1038/263573a0
-
[17]
Du, W., Wu, H., Lam, M. I., et al. 2015, AJ, 149, 199, doi: 10.1088/0004-6256/149/6/199
-
[18]
Freeman, K. C. 1970, ApJ, 160, 811 13
1970
-
[19]
2011, ApJ, 728, 74, doi: 10.1088/0004-637X/728/2/74
Padilla, N. 2011, ApJ, 728, 74, doi: 10.1088/0004-637X/728/2/74
-
[20]
Graham, A. W., & Driver, S. P. 2005, PASA, 22, 118, doi: 10.1071/AS05001
-
[21]
P., Greene, J
Greco, J. P., Greene, J. E., Strauss, M. A., et al. 2018, The Astrophysical Journal, 857, 104
2018
-
[22]
Harris, C. R., Millman, K. J., van der Walt, S. J., et al. 2020, Nature, 585, 357–362, doi: 10.1038/s41586-020-2649-2
-
[23]
2022, The Astrophysical Journal Supplement Series, 262, 39, doi: 10.3847/1538-4365/ac85b1
Huang, Q., & Fan, L. 2022, The Astrophysical Journal Supplement Series, 262, 39, doi: 10.3847/1538-4365/ac85b1
-
[24]
Hunter, J. D. 2007, Computing in Science and Engineering, 9, 90, doi: 10.1109/MCSE.2007.55
-
[25]
1997, ARA&A, 35, 267, doi: 10.1146/annurev.astro.35.1.267
Impey, C., & Bothun, G. 1997, ARA&A, 35, 267, doi: 10.1146/annurev.astro.35.1.267
-
[26]
2001, SciPy: Open source scientific tools for Python, https://www
Jones, E., Oliphant, T., Peterson, P., et al. 2001, SciPy: Open source scientific tools for Python, https://www. scipy. org
2001
-
[27]
Lambas, D. G., Maddox, S. J., & Loveday, J. 1992, MNRAS, 258, 404, doi: 10.1093/mnras/258.2.404
-
[28]
2022, Astronomy & Astrophysics, doi: 10.1051/0004-6361/202142367
Marca, A., Iodice, E., Cantiello, M., et al. 2022, Astronomy & Astrophysics, doi: 10.1051/0004-6361/202142367
-
[29]
1999, Philosophical Transactions of the Royal Society of London
Margony, B. 1999, Philosophical Transactions of the Royal Society of London. Series A: Mathematical, Physical and Engineering Sciences, 357, 93–103, doi: 10.1098/rsta.1999.0316
-
[30]
1998, Astronomy and Astrophysics, 331,
Masters, K. L., Nichol, R., Bamford, S., et al. 2010, MNRAS, 404, 792, doi: 10.1111/j.1365-2966.2010.16335.x
-
[31]
Miyazaki, S., Komiyama, Y., Kawanomoto, S., et al. 2018, PASJ, 70, S1, doi: 10.1093/pasj/psx063
-
[32]
2024, Astronomy & Astrophysics, 681, A15, doi: 10.1051/0004-6361/202347667
Montes, M., Trujillo, I., Karunakaran, A., et al. 2024, Astronomy & Astrophysics, 681, A15, doi: 10.1051/0004-6361/202347667
-
[33]
Padilla, N. D., & Strauss, M. A. 2008, MNRAS, 388, 1321, doi: 10.1111/j.1365-2966.2008.13480.x
-
[34]
2018, Monthly Notices of the Royal Astronomical Society, 478, 4657–4668, doi: 10.1093/mnras/sty1139
Pahwa, I., & Saha, K. 2018, Monthly Notices of the Royal Astronomical Society, 478, 4657–4668, doi: 10.1093/mnras/sty1139
-
[35]
Peng, C. Y., Ho, L. C., Impey, C. D., & Rix, H.-W. 2002, AJ, 124, 266, doi: 10.1086/340952
work page internal anchor Pith review doi:10.1086/340952 2002
-
[36]
Romanowsky, A., Tang, Y., & Bundy, K. A. 2025, Research Notes of the AAS, 9, doi: 10.3847/2515-5172/adee10
-
[37]
V., Navarro, J
Sales, L. V., Navarro, J. F., Penafiel, L., et al. 2020, Monthly Notices of the Royal Astronomical Society, 494, 1848 S´ ersic, J. L. 1963, Boletin de la Asociacion Argentina de Astronomia La Plata Argentina, 6, 41
2020
-
[38]
2025, A&A, 701, A272, doi: 10.1051/0004-6361/202555232
Stoppacher, D., Tissera, P., Rosas-Guevara, Y., Galaz, G., & O˜ norbe, J. 2025, A&A, 701, A272, doi: 10.1051/0004-6361/202555232
-
[39]
Strateva, I., Ivezic, Z., Knapp, G. R., et al. 2001, The Astronomical Journal, 122, 1861, doi: 10.1086/323301
-
[40]
Su, H., Li, R., Napolitano, N. R., et al. 2026, A&A, 707, A354, doi: 10.1051/0004-6361/202556535
-
[41]
2025, Astronomy & Astrophysics, doi: 10.1051/0004-6361/202556863
Su, Y., Yi, Z., Li, S., et al. 2025, Astronomy & Astrophysics, doi: 10.1051/0004-6361/202556863
-
[42]
Tanoglidis, D., Drlica-Wagner, A., Wei, K., et al. 2021, The Astrophysical Journal Supplement Series, 252, 18, doi: 10.3847/1538-4365/abca89 The Dark Energy Survey Collaboration. 2005, arXiv e-prints, astro, doi: 10.48550/arXiv.astro-ph/0510346
work page internal anchor Pith review Pith/arXiv arXiv doi:10.3847/1538-4365/abca89 2021
-
[43]
2024, A&A, 682, A4, doi: 10.1051/0004-6361/202347649 van der Burg, R
Thuruthipilly, H., Junais, Pollo, A., et al. 2024, A&A, 682, A4, doi: 10.1051/0004-6361/202347649 van der Burg, R. F. J., Muzzin, A., & Hoekstra, H. 2016, A&A, 590, A20, doi: 10.1051/0004-6361/201628222 van der Walt, S., Colbert, S. C., & Varoquaux, G. 2011, Computing in Science & Engineering, 13, 22–30, doi: 10.1109/mcse.2011.37 van Dokkum, P. G., Romano...
-
[44]
2017, Astronomy and Astrophysics, 608, doi: 10.1051/0004-6361/201730696
Venhola, A., Peletier, R., Laurikainen, E., et al. 2017, Astronomy and Astrophysics, 608, doi: 10.1051/0004-6361/201730696
-
[45]
2026, The Astrophysical Journal, 997, 32, doi: 10.3847/1538-4357/ae20f5
Wei, L., Huang, S., Li, J., et al. 2026, The Astrophysical Journal, 997, 32, doi: 10.3847/1538-4357/ae20f5
-
[46]
Wright, A. H., Kuijken, K., Hildebrandt, H., et al. 2024, A&A, 686, A170, doi: 10.1051/0004-6361/202346730
-
[47]
Edge-on Low- surface-brightness Galaxy Candidates Detected from SDSS Images Using YOLO
Xing, Y., Yi, Z., Liang, Z., et al. 2023, The Astrophysical Journal Supplement Series, 269, doi: 10.3847/1538-4365/ad0551
-
[48]
2016, ApJS, 225, 11, doi: 10.3847/0067-0049/225/1/11
Yagi, M., Koda, J., Komiyama, Y., & Yamanoi, H. 2016, ApJS, 225, 11, doi: 10.3847/0067-0049/225/1/11
-
[49]
2022, MNRAS, 513, 3972, doi: 10.1093/mnras/stac775
Yi, Z., Li, J., Du, W., et al. 2022, MNRAS, 513, 3972, doi: 10.1093/mnras/stac775
-
[50]
G., Adelman , J., Anderson , Jr., J
York, D. G., Adelman, J., Anderson, Jr., J. E., et al. 2000, AJ, 120, 1579, doi: 10.1086/301513
-
[51]
2006, A&A, 452, 857, doi: 10.1051/0004-6361:20054196
Zackrisson, E., Bergvall, N., Marquart, T., & ¨Ostlin, G. 2006, A&A, 452, 857, doi: 10.1051/0004-6361:20054196
-
[52]
2023, The Astrophysical Journal Supplement Series, 267, 27, 10.3847/1538-4365/acdd71
Zaritsky, D., Donnerstein, R., Dey, A., et al. 2023, ApJS, 267, 27, doi: 10.3847/1538-4365/acdd71
discussion (0)
Sign in with ORCID, Apple, or X to comment. Anyone can read and Pith papers without signing in.