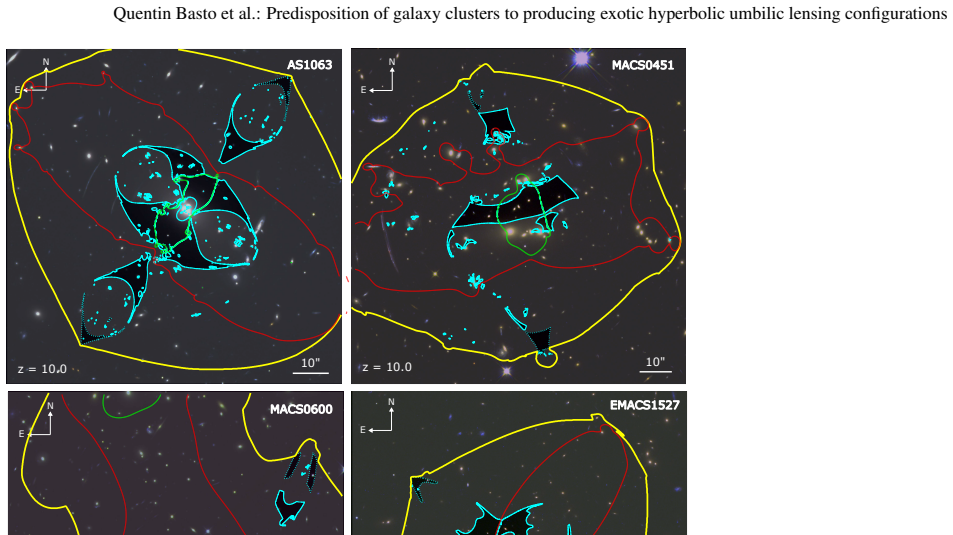
Predisposition of galaxy clusters to producing exotic hyperbolic umbilic lensing configurations
Pith reviewed 2026-07-01 04:03 UTC · model grok-4.3
The pith
Parametric mass models of 74 galaxy clusters map an average exotic comoving volume of 0.125 galaxies per cluster for hyperbolic umbilic lensing.
A machine-rendered reading of the paper's core claim, the machinery that carries it, and where it could break.
Core claim
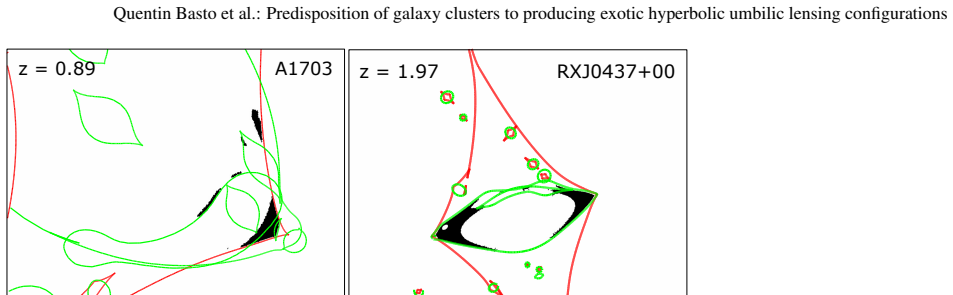
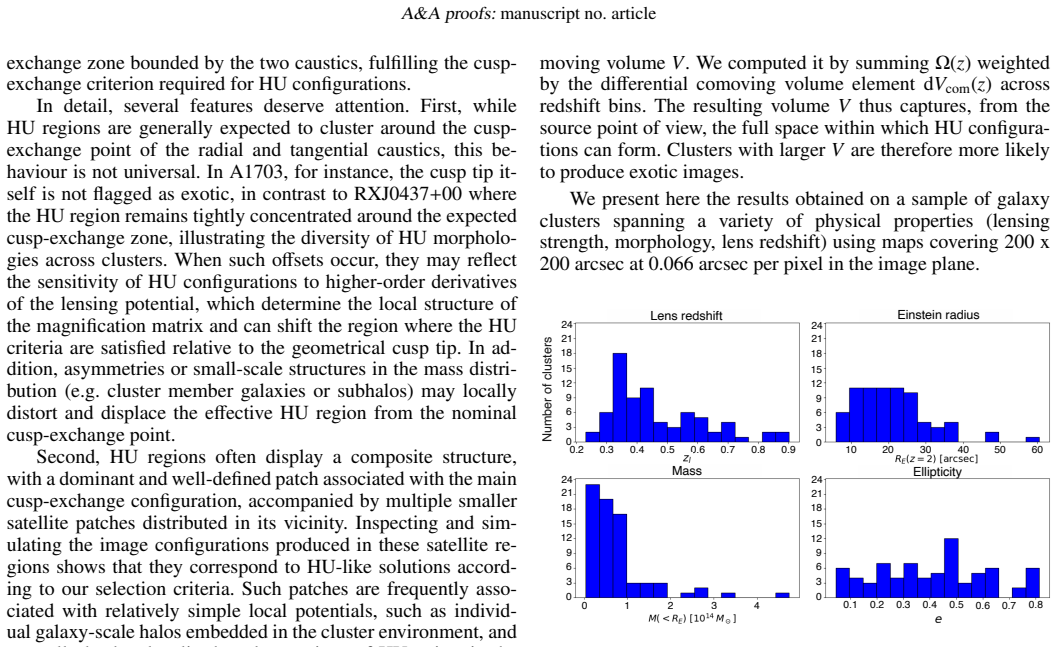
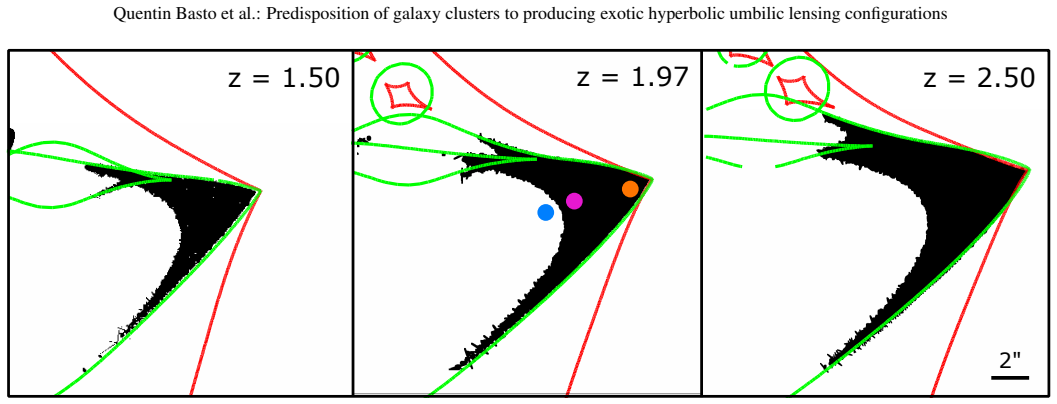
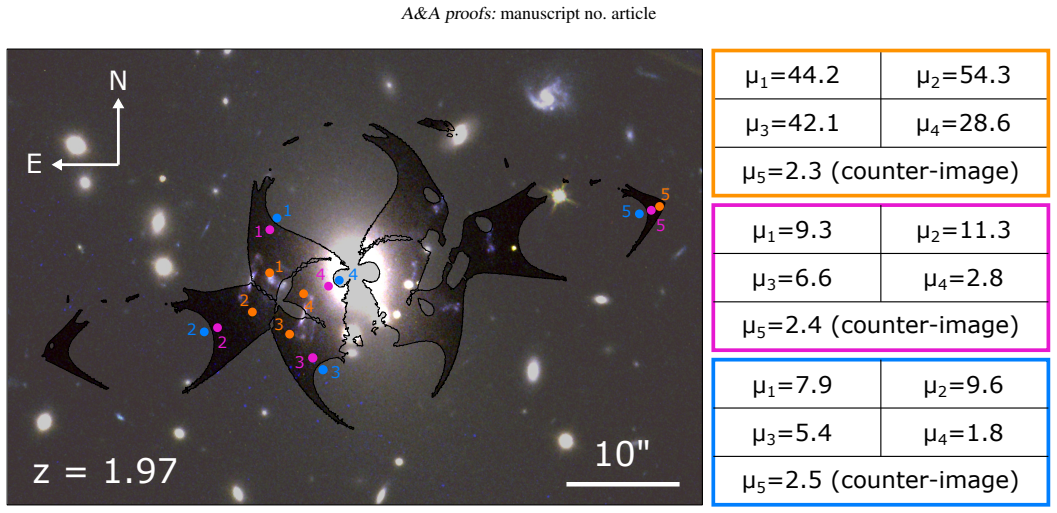
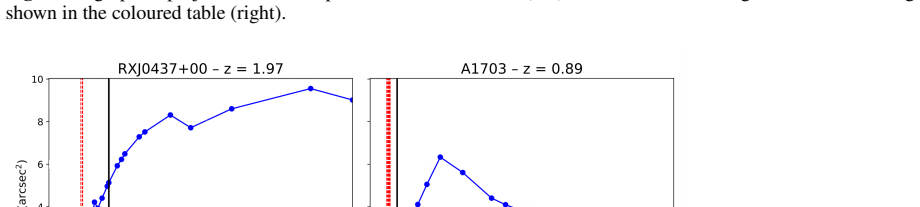
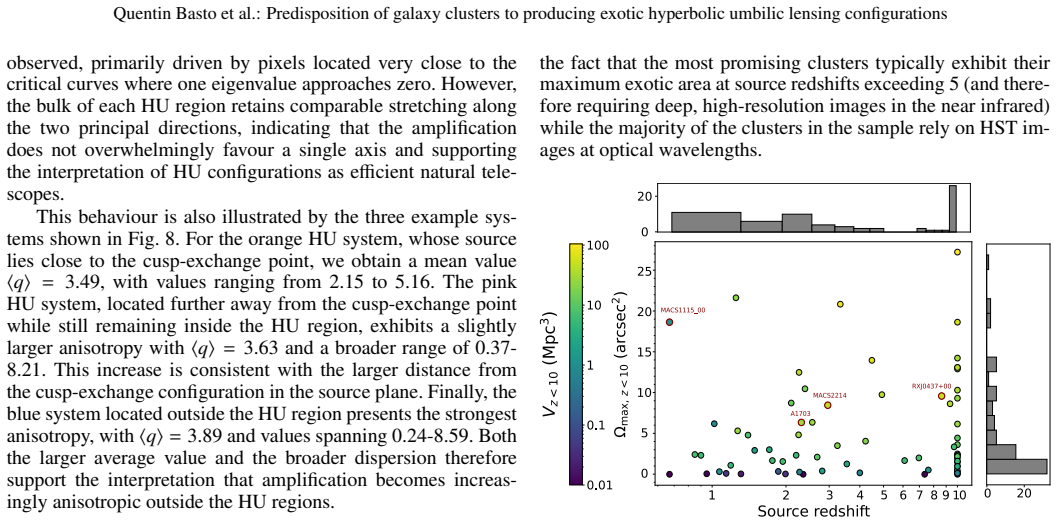
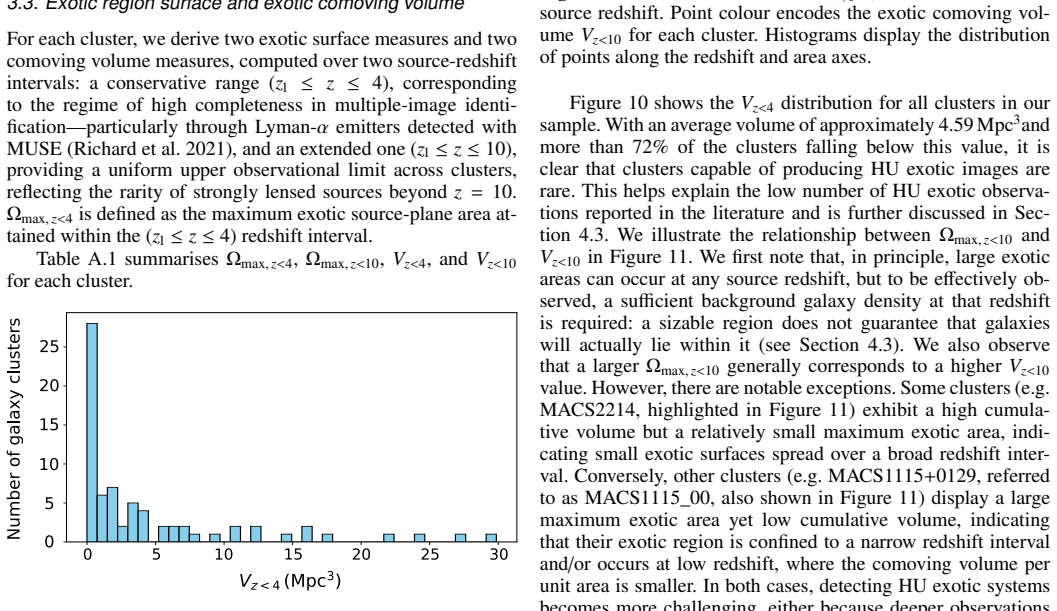
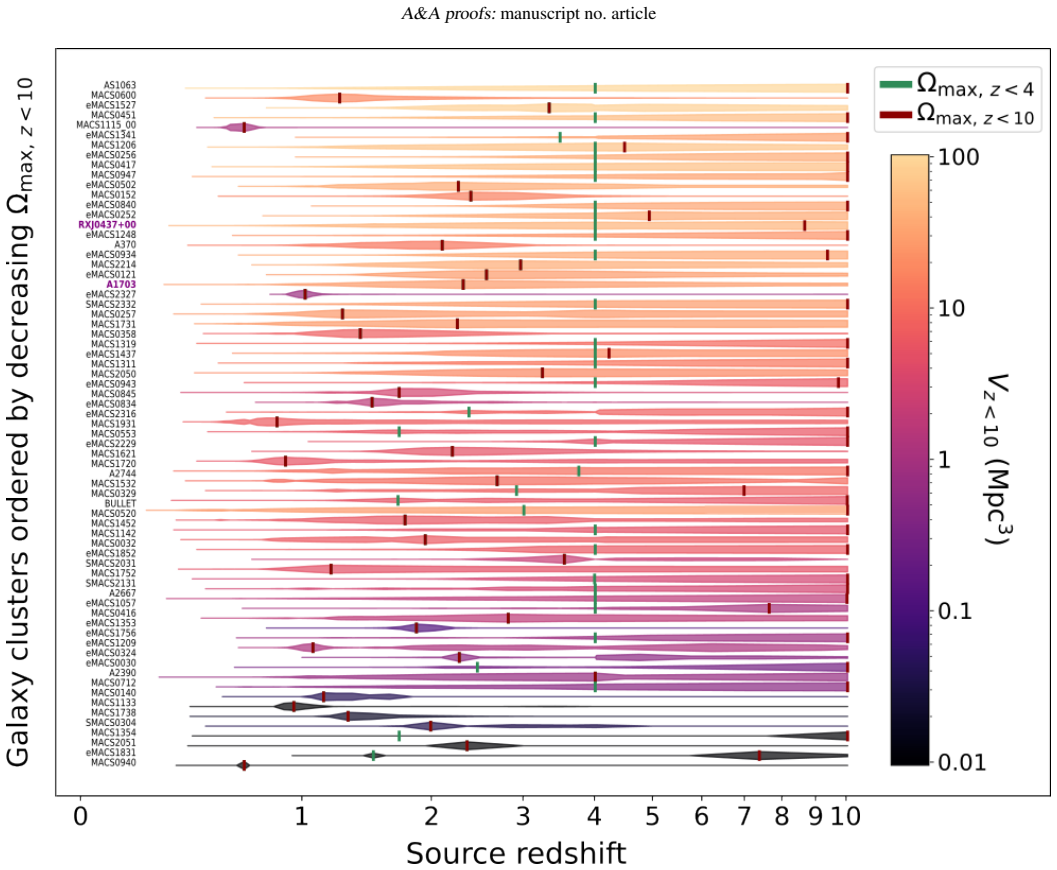
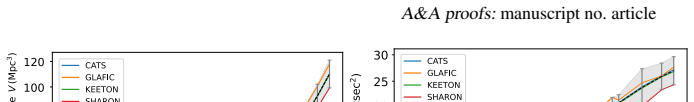
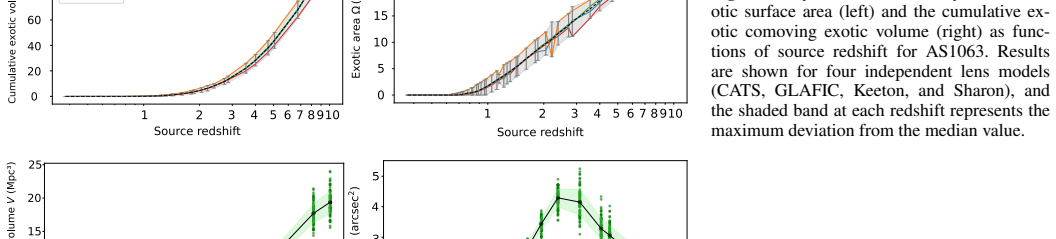
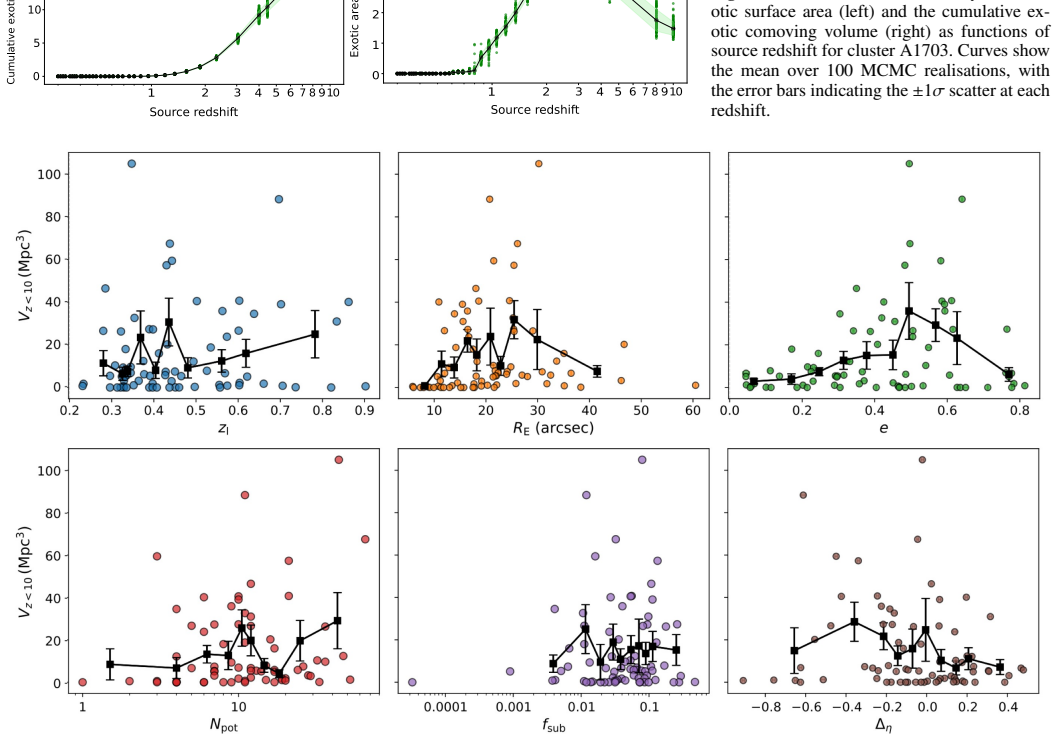
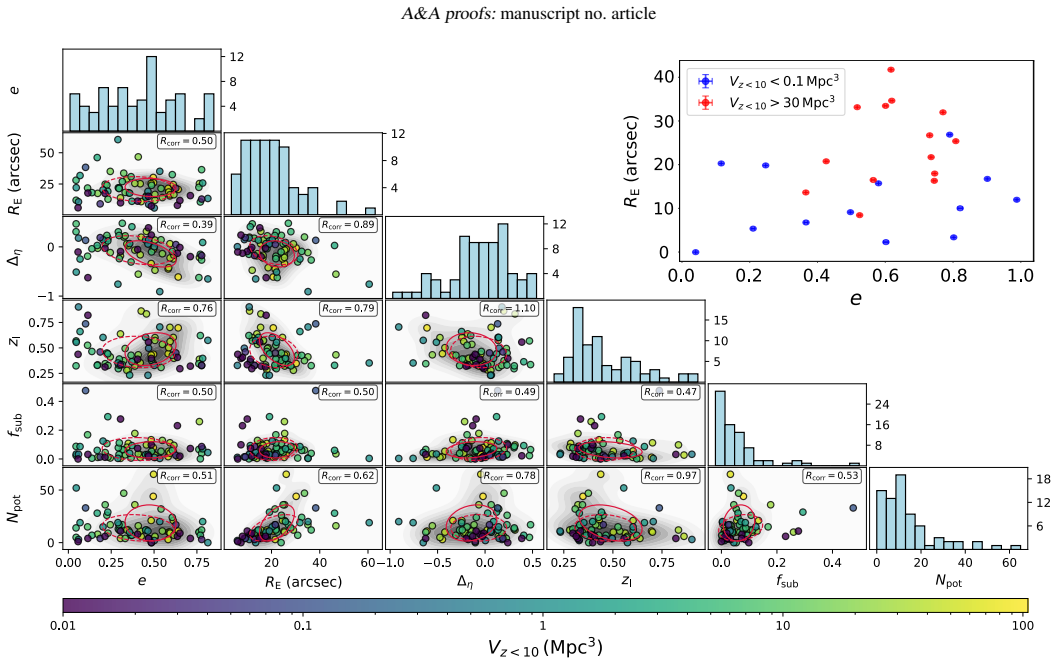
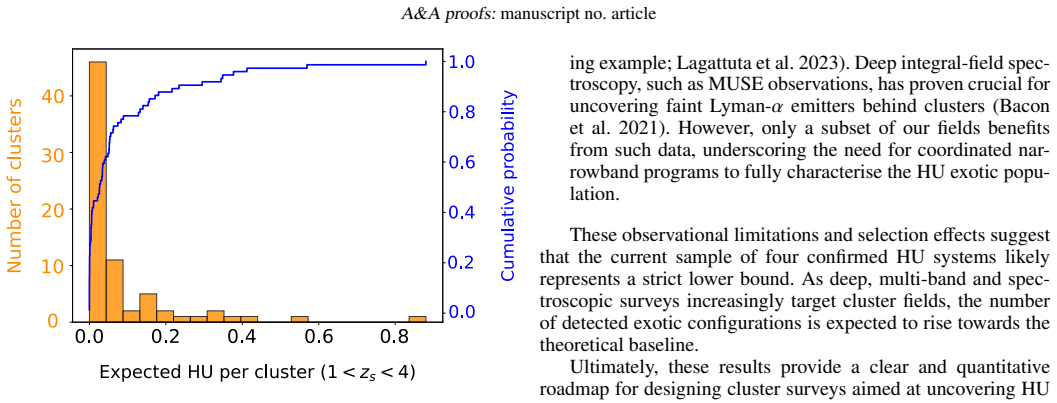
Using parametric cluster mass models, the authors define an exotic comoving volume V_z<10 by mapping and integrating source-plane areas where hyperbolic umbilic configurations can form. After validation on confirmed systems RXJ0437.1+0043 and Abell 1703, the method applied to 74 clusters yields an average per-cluster contribution of 0.125 galaxies to this volume as a conservative lower bound, with pairs of parameters best distinguishing high-volume systems.
What carries the argument
The exotic comoving volume V_z<10, obtained by integrating the source-plane area producing hyperbolic umbilic images over redshift up to z=10.
If this is right
- Pairs of cluster parameters, especially ellipticity with Einstein radius or cuspiness, distinguish systems with larger exotic volumes.
- A random sample of 19 clusters carries a 90 percent chance of containing at least one hyperbolic umbilic system.
- Systematic and stochastic uncertainties on the exotic area and volume estimates remain small enough to support the conclusions.
- The average contribution of 0.125 galaxies per cluster is presented as a conservative lower bound.
Where Pith is reading between the lines
- Targeted selection of high-ellipticity clusters could raise the detection rate above the random-sample baseline.
- Extending the source-plane mapping to non-parametric mass models would test whether the volume estimates depend on the modeling choice.
- Accumulating more confirmed hyperbolic umbilic systems could tighten constraints on the underlying cluster mass distributions.
- The volume calculation supplies a quantitative prior for planning surveys aimed at rare high-magnification lensing events.
Load-bearing premise
The parametric cluster mass models correctly identify the source-plane regions that produce hyperbolic umbilic image configurations.
What would settle it
A survey of approximately 19 clusters that finds zero hyperbolic umbilic systems, or far more than one on average, would contradict the reported average exotic volume per cluster.
Figures
read the original abstract
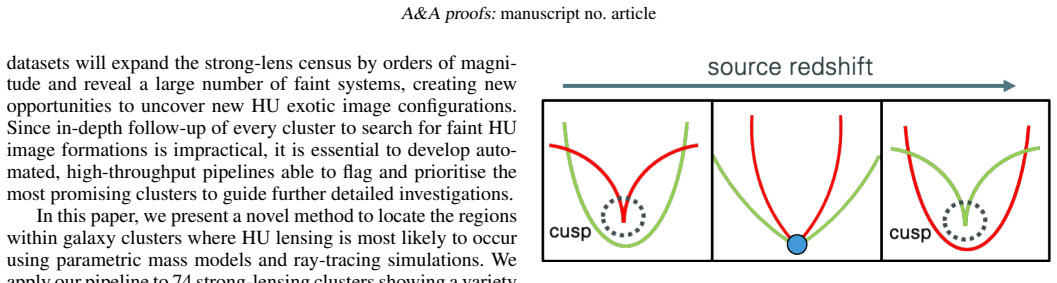
Strong gravitational lensing is a powerful tool for investigating the universe's large-scale structure and understanding the properties of dark matter and dark energy. The magnification and distortion of distant background sources by cluster lenses have enabled detailed studies of both lens and source populations, making these systems promising probes for precision cosmology. While classical strong-lenses are well understood, much remains to be explored for hyperbolic-umbilic (HU) exotic lenses, which produce unique telescopic effects and uncommon images with potentially very high magnifications. Identifying and quantifying these objects, along with characterising their geometric configurations, could have broad implications for studies of galaxy clusters and lensed galaxy populations. Using parametric cluster mass models, we mapped regions in the source plane where HU exotic images can form and integrate these areas over redshift to define an exotic comoving volume (V_z<10). We validated this approach on confirmed exotic systems (RXJ0437.1+0043 and Abell 1703), then applied it to a sample of 74 cluster models. We show HU-region contours for the most promising clusters, assess both systematic and stochastic uncertainties on exotic area and volume estimates, and confirm that our error remains sufficiently small to support robust conclusions. Next, we explore correlations between six cluster parameters and (V_z<10), finding that pairs of parameters, especially ellipticity with Einstein radius or cuspiness, best distinguish high-(V_z<10) systems. Finally, we estimate that each cluster contributes ~0.125 galaxies to its exotic volume on average (as a conservative lower bound), meaning that observing 19 clusters yields a 90% chance of detecting at least one HU system in a random sample.
Editorial analysis
A structured set of objections, weighed in public.
Referee Report
Summary. The paper claims that parametric mass models of 74 galaxy clusters can be used to map source-plane regions producing hyperbolic umbilic (HU) exotic lensing configurations; these areas are integrated over z<10 to define an exotic comoving volume V_z<10. The method is validated by reproducing the two known HU systems (RXJ0437.1+0043 and Abell 1703), then applied to the full sample. Correlations are found between cluster parameters (especially ellipticity paired with Einstein radius or cuspiness) and V_z<10. The central quantitative result is that each cluster contributes ~0.125 galaxies to its exotic volume on average (conservative lower bound), implying that a random sample of 19 clusters yields a 90% chance of detecting at least one HU system.
Significance. If the central result holds, the work supplies a quantitative, observationally testable prediction for the rarity of exotic HU configurations across cluster samples. This could directly inform survey strategies for high-magnification events and provides a statistical link between observable cluster parameters and the higher-order lensing properties that produce umbilic caustics. The reported parameter correlations offer a practical way to pre-select promising targets.
major comments (2)
- [Abstract] Abstract: the source-plane HU mapping is validated solely by reproducing the two known systems before being applied to the remaining 72 models. Because the reported mean exotic volume of ~0.125 (and the derived 90% probability for 19 clusters) is obtained by integrating these mapped areas, any systematic mismatch between the parametric forms (e.g., elliptical NFW) and the true higher-order derivatives or critical-curve topology in other clusters would directly bias the average; no independent check or sensitivity test on a subset of the 74 models is described.
- [Abstract] Abstract: the integration procedure that produces V_z<10 (parametric forms, source-redshift distribution, numerical quadrature, and propagation of the quoted systematic/stochastic uncertainties) is not specified. Without these details it is impossible to verify that the ~0.125 average is free of post-hoc tuning or that the error budget remains small enough to support the 90% detection probability statement.
minor comments (1)
- [Abstract] The abstract states that error remains 'sufficiently small to support robust conclusions' but provides no quantitative thresholds or comparison to the 0.125 value itself.
Simulated Author's Rebuttal
We thank the referee for the careful and constructive report. We address each major comment below and agree that the manuscript would benefit from additional explicit details and tests. Revisions will be made accordingly.
read point-by-point responses
-
Referee: [Abstract] Abstract: the source-plane HU mapping is validated solely by reproducing the two known systems before being applied to the remaining 72 models. Because the reported mean exotic volume of ~0.125 (and the derived 90% probability for 19 clusters) is obtained by integrating these mapped areas, any systematic mismatch between the parametric forms (e.g., elliptical NFW) and the true higher-order derivatives or critical-curve topology in other clusters would directly bias the average; no independent check or sensitivity test on a subset of the 74 models is described.
Authors: We agree that validation rests on the two known HU systems (the only confirmed examples) and that an explicit sensitivity test on a subset of the 74 models would strengthen the result. In the revised manuscript we will add a dedicated sensitivity analysis: for a representative subset of 10 clusters we will perturb key parameters (ellipticity, Einstein radius, cuspiness) within their reported uncertainties, recompute the source-plane HU regions and V_z<10, and quantify the resulting variation in the mean exotic volume. This will directly address concerns about possible systematic mismatch with higher-order lensing properties. revision: yes
-
Referee: [Abstract] Abstract: the integration procedure that produces V_z<10 (parametric forms, source-redshift distribution, numerical quadrature, and propagation of the quoted systematic/stochastic uncertainties) is not specified. Without these details it is impossible to verify that the ~0.125 average is free of post-hoc tuning or that the error budget remains small enough to support the 90% detection probability statement.
Authors: We agree that the integration procedure requires explicit specification. The full manuscript already contains the source-redshift distribution (uniform in comoving volume to z=10) and states that both systematic and stochastic uncertainties were assessed, but the numerical quadrature method and uncertainty propagation steps are only summarized. In revision we will add a new subsection (Methods) that details: (i) the exact parametric forms used for each cluster, (ii) the redshift integration limits and weighting, (iii) the quadrature algorithm (adaptive Simpson with convergence tolerance), and (iv) the Monte-Carlo propagation of the quoted uncertainties to obtain the final mean of ~0.125 and the 90 % detection probability. This will allow full verification. revision: yes
Circularity Check
No circularity: exotic volume and probability follow directly from model integration without reduction to inputs
full rationale
The derivation computes HU source-plane areas from parametric mass models (validated on two known systems then applied to 74), integrates to V_z<10, reports the sample mean ~0.125 galaxies per cluster, and converts that mean to a binomial probability for 19 clusters. None of these steps matches the enumerated circularity patterns: no self-definition of quantities, no fitted parameter relabeled as prediction, no load-bearing self-citation, and no ansatz or uniqueness imported from prior author work. The final statistics are ordinary sample summaries of independently computed volumes.
Axiom & Free-Parameter Ledger
free parameters (3)
- ellipticity
- Einstein radius
- cuspiness
axioms (2)
- domain assumption Parametric mass models reliably locate hyperbolic umbilic regions in the source plane
- domain assumption The sample of 74 cluster models is statistically representative for estimating average exotic volume per cluster
invented entities (1)
-
exotic comoving volume V_z<10
no independent evidence
Reference graph
Works this paper leans on
-
[1]
Aazami, A. B. & Petters, A. O. 2009, Journal of mathematical physics, 50
2009
-
[2]
2021, A&A, 647, A107
Bacon, R., Mary, D., Garel, T., et al. 2021, A&A, 647, A107
2021
-
[3]
& Schneider, P
Bartelmann, M. & Schneider, P. 2001, Physics Reports, 340, 291
2001
-
[4]
2025, A&A
Bergamini, P., Meneghetti, M., Acebron, A., et al. 2025, A&A
2025
-
[5]
2021, ApJ, 162, 47
Bouwens, R., Oesch, P., Stefanon, M., et al. 2021, ApJ, 162, 47
2021
-
[6]
2012, MNRAS, 427, 1953
Christensen, L., Richard, J., Hjorth, J., et al. 2012, MNRAS, 427, 1953
2012
-
[7]
2022, A&A, 666, A78
Claeyssens, A., Richard, J., Blaizot, J., et al. 2022, A&A, 666, A78
2022
-
[8]
2019, ApJ, 884, 85
Coe, D., Salmon, B., Bradaˇc, M., et al. 2019, ApJ, 884, 85
2019
-
[9]
2017, A&A, 605, A81
Dessauges-Zavadsky, M., Zamojski, M., Rujopakarn, W., et al. 2017, A&A, 605, A81
2017
-
[10]
2007, ApJ, 661, L33
Ebeling, H., Barrett, E., Donovan, D., et al. 2007, ApJ, 661, L33
2007
-
[11]
2017, Monthly Notices of the Royal Astronom- ical Society, 471, 3305
Ebeling, H., Qi, J., & Richard, J. 2017, Monthly Notices of the Royal Astronom- ical Society, 471, 3305
2017
-
[12]
2025, MNRAS, 537, 2662
Ebeling, H., Richard, J., Beauchesne, B., et al. 2025, MNRAS, 537, 2662
2025
-
[13]
Egami, E. et al. 2012, in American Astronomical Society Meeting Abstracts# 220, V ol. 220, 308–02 Elíasdóttir, Á., Limousin, M., Richard, J., et al. 2007, arXiv preprint arXiv:0710.5636
work page internal anchor Pith review Pith/arXiv arXiv 2012
-
[14]
L., Ryan, R
Finkelstein, S. L., Ryan, R. E., Papovich, C., et al. 2015, ApJ, 810, 71
2015
-
[15]
Fischler, M. A. & Bolles, R. C. 1981, Communications of the ACM, 24, 381
1981
-
[16]
Fox, C., Mahler, G., Sharon, K., & González, J. D. R. 2022, ApJ, 928, 87
2022
-
[17]
J., Zitrin, A., Richard, J., et al
Furtak, L. J., Zitrin, A., Richard, J., et al. 2024, MNRAS, 533, 2242
2024
-
[18]
T., Ebeling, H., & Richard, J
Ho, I. T., Ebeling, H., & Richard, J. 2012, MNRAS, 426, 1992
2012
-
[19]
Hogg, D. W. 1999, arXiv preprint astro-ph/9905116
work page internal anchor Pith review Pith/arXiv arXiv 1999
-
[20]
2013, MNRAS, 429, 833
Hsu, L.-Y ., Ebeling, H., & Richard, J. 2013, MNRAS, 429, 833
2013
-
[21]
2015, Monthly Notices of the Royal As- tronomical Society, 452, 1437
Jauzac, M., Richard, J., Jullo, E., et al. 2015, Monthly Notices of the Royal As- tronomical Society, 452, 1437
2015
-
[22]
L., Sharon, K., Bayliss, M
Johnson, T. L., Sharon, K., Bayliss, M. B., et al. 2014, ApJ, 797, 48
2014
-
[23]
2007, New Journal of Physics, 9, 447
Jullo, E., Kneib, J.-P., Limousin, M., et al. 2007, New Journal of Physics, 9, 447
2007
-
[24]
& Kovner, I
Kassiola, A. & Kovner, I. 1993, ApJ, 417, 450
1993
-
[25]
2018, ApJ, 855, 4
Kawamata, R., Ishigaki, M., Shimasaku, K., et al. 2018, ApJ, 855, 4
2018
-
[26]
2024, arXiv preprint arXiv:2411.13640
Kokorev, V ., Atek, H., Chisholm, J., et al. 2024, arXiv preprint arXiv:2411.13640
-
[27]
1994, A&A, 284, 285
Kormann, R., Schneider, P., & Bartelmann, M. 1994, A&A, 284, 285
1994
-
[28]
J., Richard, J., Bauer, F
Lagattuta, D. J., Richard, J., Bauer, F. E., et al. 2019, MNRAS, 485, 3738
2019
-
[29]
J., Richard, J., Ebeling, H., et al
Lagattuta, D. J., Richard, J., Ebeling, H., et al. 2023, MNRAS, 522, 1091
2023
-
[30]
2008, A&A, 489, 23
Limousin, M., Richard, J., Kneib, J.-P., et al. 2008, A&A, 489, 23
2008
-
[31]
M., Koekemoer, A., Coe, D., et al
Lotz, J. M., Koekemoer, A., Coe, D., et al. 2017, ApJ, 837, 97
2017
-
[32]
& Dickinson, M
Madau, P. & Dickinson, M. 2014, Annual Review of Astronomy and Astro- physics, 52, 415
2014
-
[33]
& Schneider, P
Mao, S. & Schneider, P. 1998, MNRAS, 295, 587
1998
-
[34]
V ., Kent, J
Mardia, K. V ., Kent, J. T., & Taylor, C. C. 2024, Multivariate analysis (John Wiley & Sons)
2024
-
[35]
Meena, A. K. & Bagla, J. 2020, MNRAS, 492, 3294
2020
-
[36]
Meena, A. K. & Bagla, J. S. 2021, MNRAS, 503, 2097
2021
-
[37]
Meena, A. K. & Bagla, J. S. 2022, MNRAS, 515, 4151
2022
-
[38]
Meena, A. K. & Bagla, J. S. 2023, MNRAS, 526, 3902
2023
- [39]
-
[40]
K., Ghosh, A., Bagla, J
Meena, A. K., Ghosh, A., Bagla, J. S., & Williams, L. L. 2021, MNRAS, 506, 1526
2021
-
[41]
2007, A&A, 461, 25
Meneghetti, M., Argazzi, R., Pace, F., et al. 2007, A&A, 461, 25
2007
-
[42]
2023, A&A, 678, L2
Meneghetti, M., Cui, W., Rasia, E., et al. 2023, A&A, 678, L2
2023
-
[43]
& Kneib, J.-P
Natarajan, P. & Kneib, J.-P. 1997, MNRAS, 287, 833
1997
-
[44]
F., Frenk, C
Navarro, J. F., Frenk, C. S., & White, S. D. 1997, ApJ, 490, 493
1997
-
[45]
B., Treu, T., Ellis, R
Newman, A. B., Treu, T., Ellis, R. S., & Sand, D. J. 2013, ApJ, 765, 25
2013
-
[46]
& Gunn, J
Oke, J. & Gunn, J. 1983, Astrophysical Journal, Part 1, vol. 266, Mar. 15, 1983, p. 713-717., 266, 713 Orban de Xivry, G. & Marshall, P. 2009, MNRAS, 399, 2
1983
-
[47]
O., Levine, H., & Wambsganss, J
Petters, A. O., Levine, H., & Wambsganss, J. 2012, Singularity theory and grav- itational lensing, V ol. 21 (Springer Science & Business Media)
2012
-
[48]
2012, A&AS, 199, 25
Postman, M., Coe, D., Benitez, N., et al. 2012, A&AS, 199, 25
2012
-
[49]
A., Keeton, C
Raney, C. A., Keeton, C. R., & Brennan, S. 2020, MNRAS, 492, 503
2020
-
[50]
& Ebeling, H
Repp, A. & Ebeling, H. 2018, MNRAS, 479, 844
2018
-
[51]
2021, A&A, 646, A83
Richard, J., Claeyssens, A., Lagattuta, D., et al. 2021, A&A, 646, A83
2021
-
[52]
2014, MNRAS, 444, 268
Richard, J., Jauzac, M., Limousin, M., et al. 2014, MNRAS, 444, 268
2014
-
[53]
Richard, J., Pei, L., Limousin, M., Jullo, E., & Kneib, J. P. 2009, A&A, 498, 37
2009
-
[54]
P., Kneib, J.-P., et al
Richard, J., Smith, G. P., Kneib, J.-P., et al. 2010, MNRAS, 404, 325
2010
-
[55]
1976, ApJ, 203, 297
Schechter, P. 1976, ApJ, 203, 297
1976
-
[56]
E., et al
Schneider, P., Ehlers, J., Falco, E. E., et al. 1992, Gravitational lenses as astro- physical tools (Springer)
1992
-
[57]
Silverman, B. W. 2018, Density estimation for statistics and data analysis (Rout- ledge)
2018
-
[58]
2024, in American Astronomical Society Meeting Abstracts, V ol
Tagliavia, M., Horwath, G., Gladders, M., & Cool-Lamps. 2024, in American Astronomical Society Meeting Abstracts, V ol. 243, American Astronomical Society Meeting Abstracts #243, 460.02
2024
-
[59]
T., Tuan-Anh, P., Pello, R., et al
Thai, T. T., Tuan-Anh, P., Pello, R., et al. 2023, Astronomy & Astrophysics, 678, A139
2023
-
[60]
2016, ApJ, 821, 116
Umetsu, K., Zitrin, A., Gruen, D., et al. 2016, ApJ, 821, 116
2016
-
[61]
2009, MNRAS, 398, 1235
Xu, D., Mao, S., Wang, J., et al. 2009, MNRAS, 398, 1235
2009
-
[62]
Strong Gravitational Lensing with the James Webb Space Telescope
Zitrin, A. 2026, arXiv preprint arXiv:2605.15189 Article number, page 17 of 20 A&A proofs:manuscript no. article Appendix A: Cluster properties and exotic lensing diagnostics. Cluster properties and exotic lensing diagnostics. Summary of the lensing and structural parameters for all galaxy clusters an- alyzed in this study. The table lists the cluster red...
work page internal anchor Pith review Pith/arXiv arXiv 2026
discussion (0)
Sign in with ORCID, Apple, or X to comment. Anyone can read and Pith papers without signing in.