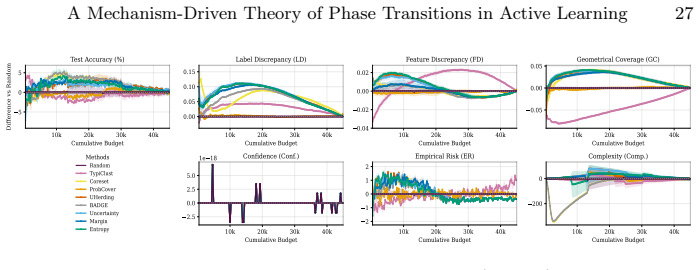
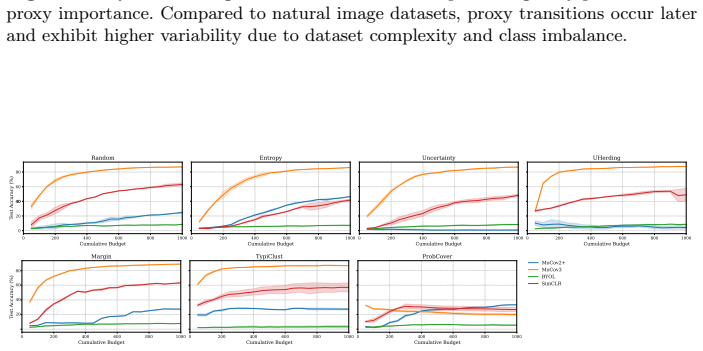
A Mechanism-Driven Theory of Phase Transitions in Active Learning
Pith reviewed 2026-07-02 19:34 UTC · model grok-4.3
The pith
Dominance shifts between generalization mechanisms create unavoidable phase transitions that partition active learning into data-driven, transition, and model-driven regimes.
A machine-rendered reading of the paper's core claim, the machinery that carries it, and where it could break.
Core claim
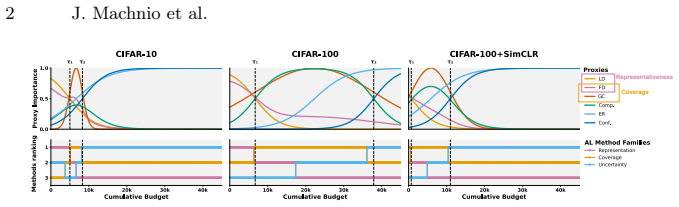
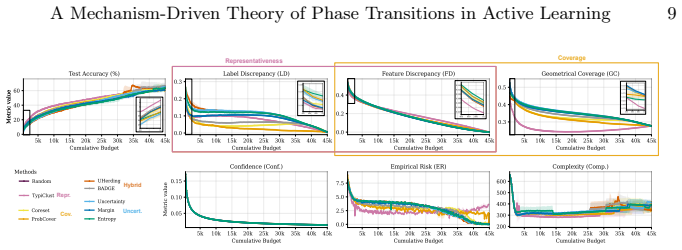
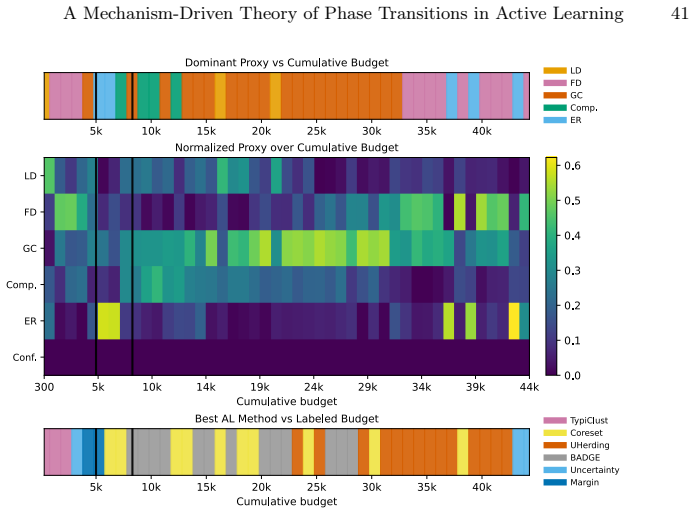
Dominance shifts between generalization mechanisms are structurally unavoidable in active learning, creating a moving bottleneck for generalization. This yields a tripartite taxonomy consisting of data-driven, transition, and model-driven phases. The alignment between a strategy's inductive bias and the active bottleneck determines active learning efficiency across natural and medical imaging tasks.
What carries the argument
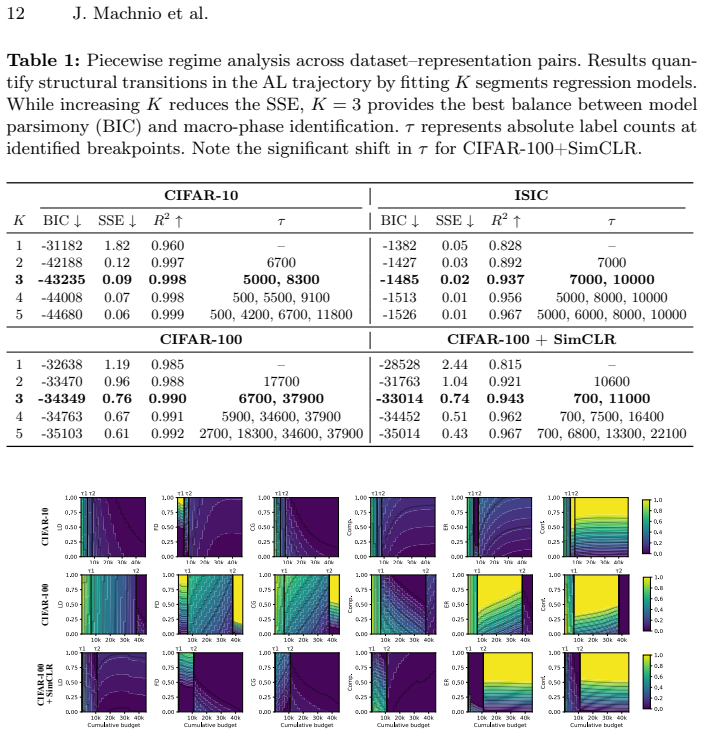
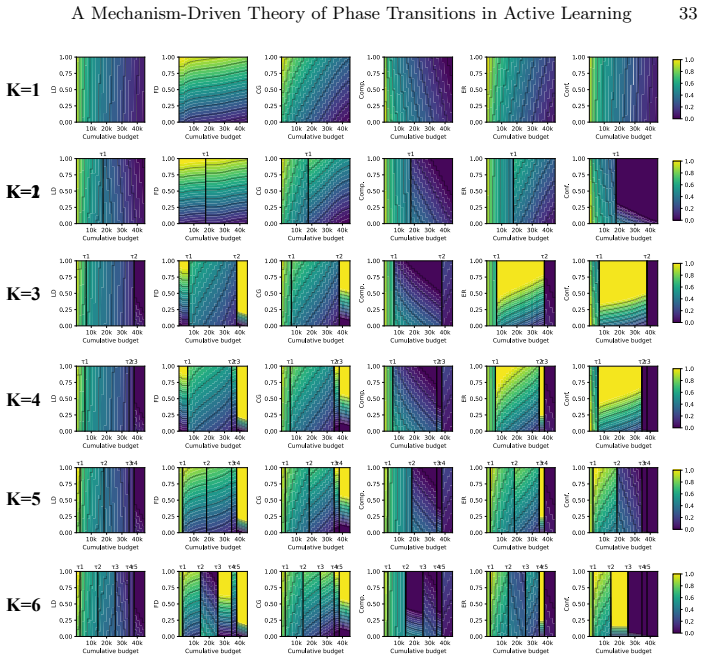
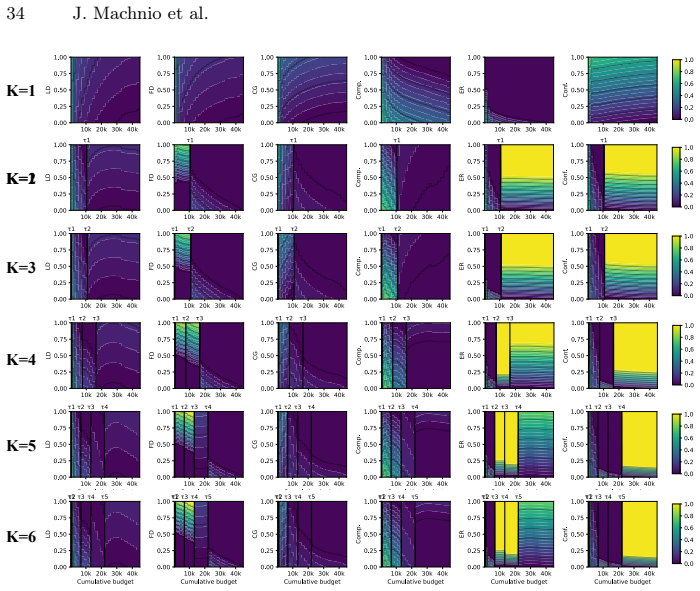
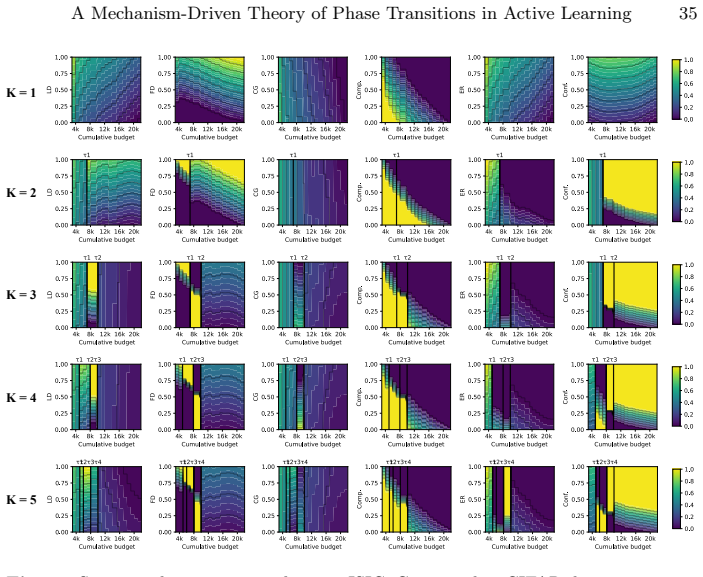
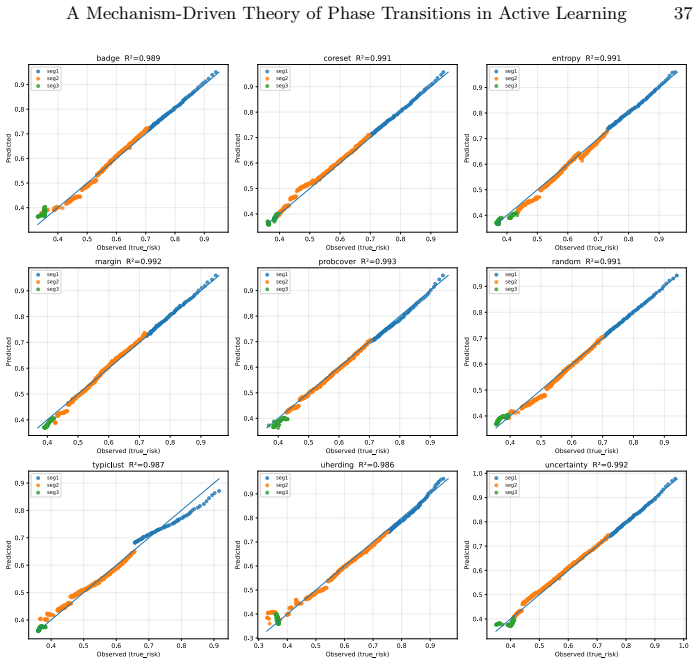
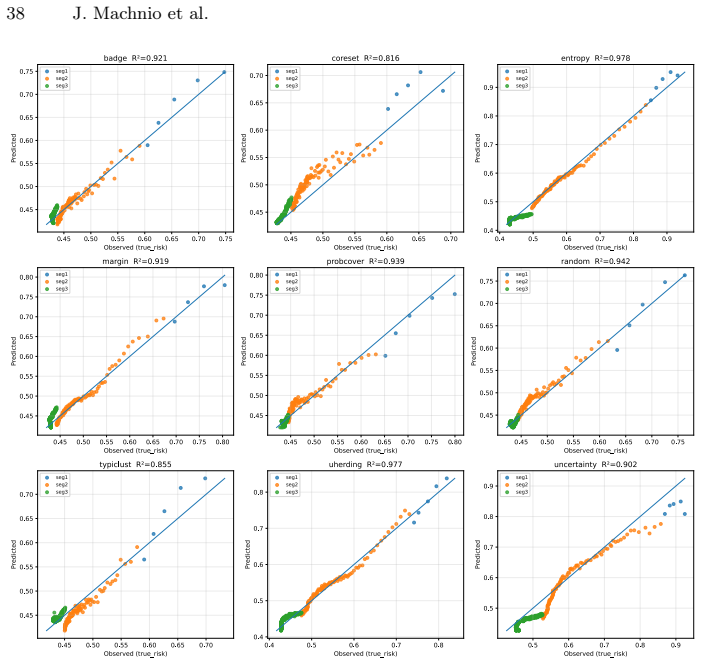
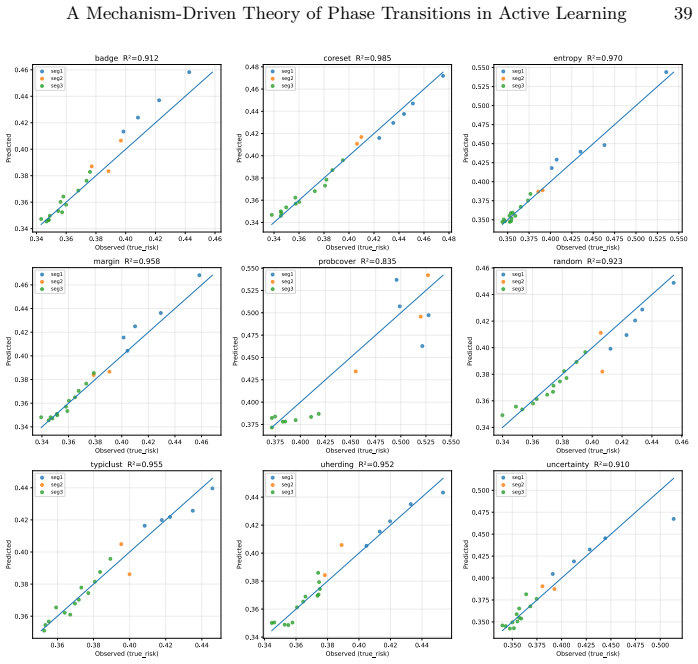
The moving bottleneck arising from unavoidable dominance shifts among PAC-style risk components reinterpreted as dynamic terms, operationalized via measurable proxies and segmented regression to identify the three phases.
If this is right
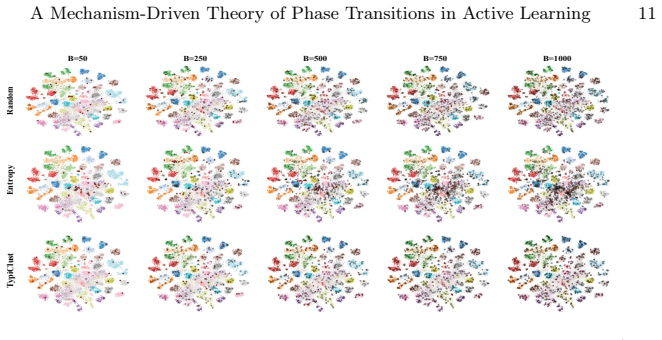
- Representativeness, coverage, and uncertainty strategies excel at different phases due to their alignment with the active bottleneck.
- Self-supervised representation learning causes the transition phase to occur earlier in the labeling trajectory.
- AL efficiency is maximized when the query strategy matches the dominant generalization mechanism at each stage.
- The phases can be identified in practice using proxies without relying on post-hoc definitions.
Where Pith is reading between the lines
- Algorithms could dynamically switch between strategies as the detected phase changes along the budget.
- The same phase structure might appear in other supervised learning settings beyond active learning.
- Representation quality acts as a modulator that alters the length and position of each phase.
- Testing on non-imaging domains would reveal whether the tripartite structure generalizes.
Load-bearing premise
PAC-style risk components can be reinterpreted as dynamic interacting terms whose dominance shifts are provably unavoidable and can be identified via measurable proxies and segmented regression without the fitting process itself defining the phases.
What would settle it
A dataset and model where segmented regression on the chosen proxies fails to detect consistent phase boundaries across multiple random seeds, or where dominance shifts can be eliminated by altering the risk decomposition.
Figures
read the original abstract
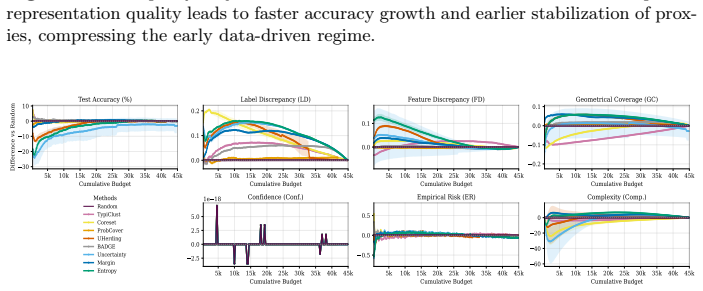
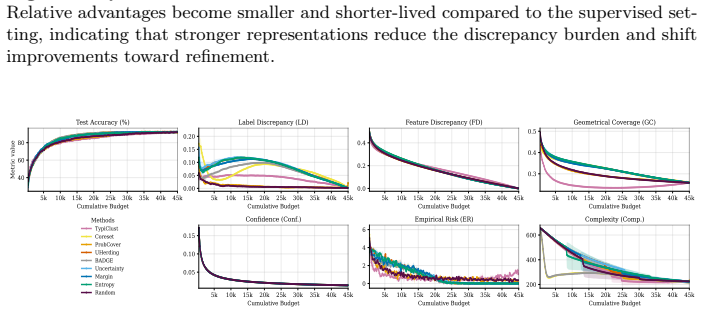
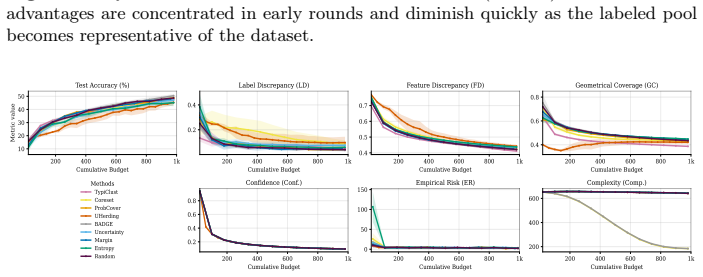
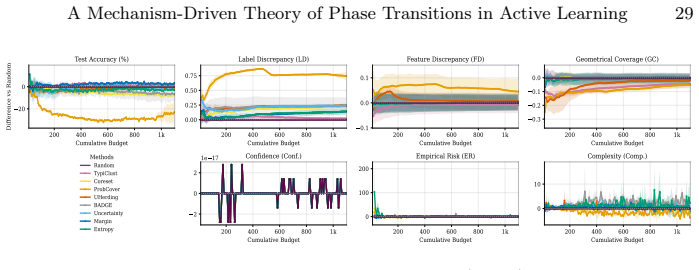
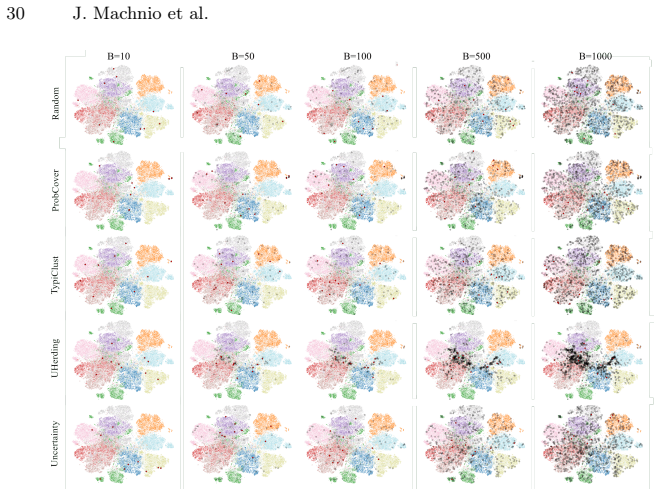
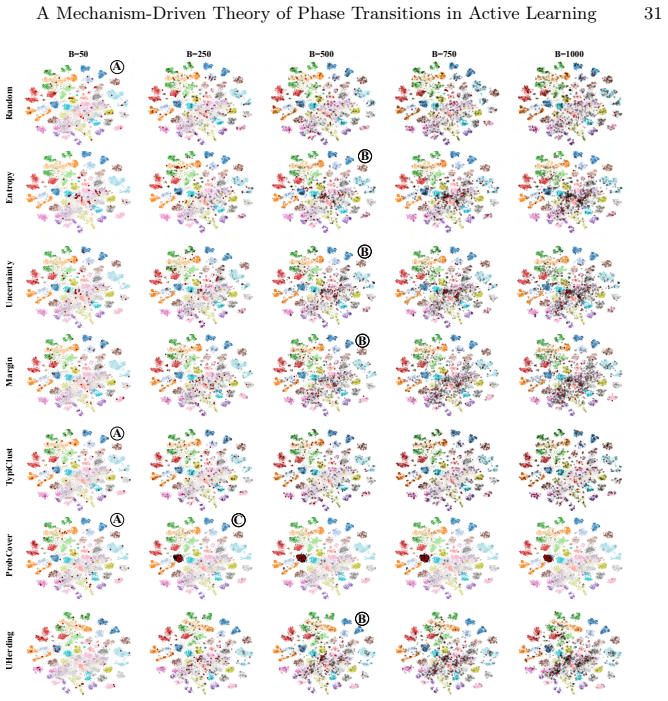
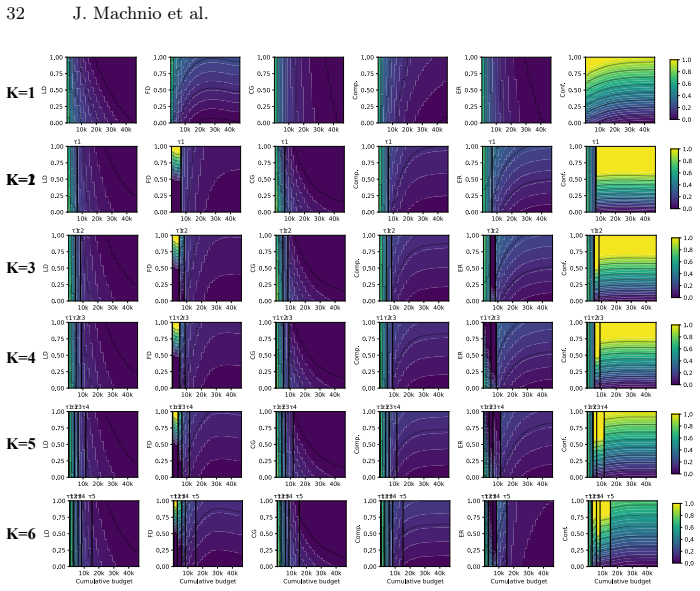
Active learning (AL) performance is known to be budget-dependent, yet regimes are typically defined by heuristic label counts that fail to generalize across datasets or architectures. We characterize AL dynamics by reframing budget regimes as shifts in the dominant generalization mechanism. By reinterpreting PAC-style risk components as dynamic interacting terms, we prove that dominance shifts are structurally unavoidable, creating a moving bottleneck for generalization. We operationalize this using measurable proxies and a segmented regression procedure to identify a tripartite taxonomy: data-driven, transition, and model-driven phases. Our framework explains the long-standing observation that representativeness, coverage, and uncertainty strategies excel at different stages. Experiments across natural and medical imaging show that AL efficiency depends on the alignment between the strategy's inductive bias and the active bottleneck. Moreover, self-supervised representation shift transitions earlier along the labeling trajectory, highlighting the role of representation quality in shaping AL dynamics. Overall, this work provides a unified framework for the next generation of transition-aware AL algorithms.
Editorial analysis
A structured set of objections, weighed in public.
Referee Report
Summary. The paper claims to develop a mechanism-driven theory of phase transitions in active learning by reframing budget regimes as shifts in dominant generalization mechanisms. It reinterprets PAC-style risk components as dynamic interacting terms and proves that dominance shifts between them are structurally unavoidable, creating a moving bottleneck. This yields a tripartite taxonomy of data-driven, transition, and model-driven phases, which is operationalized via measurable proxies and segmented regression. The framework explains why representativeness, coverage, and uncertainty strategies excel at different stages, with experiments on natural and medical imaging datasets showing that AL efficiency depends on alignment between strategy inductive bias and the active bottleneck; self-supervised representation shifts are also shown to occur earlier along the labeling trajectory.
Significance. If the structural proof is independent of the regression procedure and the phases are recoverable from a-priori signatures, the work could offer a unified, non-heuristic account of AL dynamics that explains strategy performance variation and guides adaptive algorithm design. The emphasis on mechanism alignment and representation quality provides a falsifiable lens for analyzing budget-dependent behavior across domains.
major comments (2)
- [Theoretical derivation of dominance shifts] The central proof that dominance shifts are structurally unavoidable (referenced in the abstract as reinterpreting PAC risk components) must explicitly derive a-priori detectable signatures for the phase boundaries; without this, the segmented regression on proxies risks defining the tripartite taxonomy post-hoc rather than recovering theoretically predicted transitions, rendering the taxonomy descriptive instead of derived.
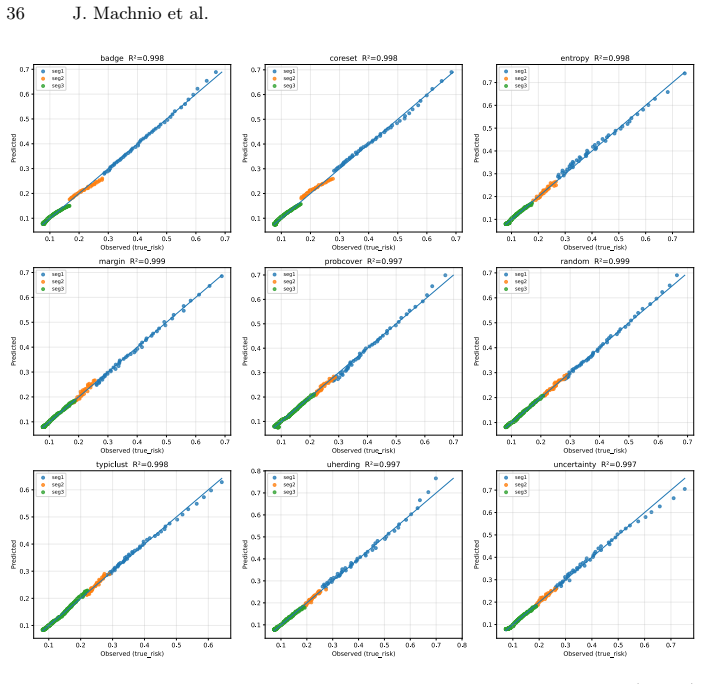
- [Phase identification and experimental validation] The operationalization via proxies and segmented regression (abstract) must demonstrate that phase boundaries are recovered independently of the fitting procedure applied to the same data used to claim strategy alignment effects; otherwise the explanation for why strategies excel at different stages becomes circular.
minor comments (1)
- [Abstract] The abstract could specify the measurable proxies used for the data-driven, transition, and model-driven phases to aid immediate assessment of operationalization.
Simulated Author's Rebuttal
We thank the referee for these constructive comments, which help clarify the distinction between structural unavoidability and operational phase recovery. We address each point below and will revise the manuscript to make the theoretical signatures explicit and to include robustness checks for phase identification.
read point-by-point responses
-
Referee: [Theoretical derivation of dominance shifts] The central proof that dominance shifts are structurally unavoidable (referenced in the abstract as reinterpreting PAC risk components) must explicitly derive a-priori detectable signatures for the phase boundaries; without this, the segmented regression on proxies risks defining the tripartite taxonomy post-hoc rather than recovering theoretically predicted transitions, rendering the taxonomy descriptive instead of derived.
Authors: The proof in Section 3 establishes structural unavoidability by showing that the three PAC risk terms possess distinct asymptotic scalings with labeled-set size, guaranteeing at least two dominance crossings. To address the request for a-priori signatures, we will add an explicit derivation of the boundary loci as the solutions to the equation where the ratio of any two risk terms equals unity, expressed in terms of the Lipschitz constants and covering numbers of the hypothesis class. These loci constitute detectable signatures that can be estimated from unlabeled data statistics before regression is applied. Revision will incorporate this derivation so that the taxonomy is recovered from theoretically predicted transitions. revision: yes
-
Referee: [Phase identification and experimental validation] The operationalization via proxies and segmented regression (abstract) must demonstrate that phase boundaries are recovered independently of the fitting procedure applied to the same data used to claim strategy alignment effects; otherwise the explanation for why strategies excel at different stages becomes circular.
Authors: The proxies (gradient alignment, representation shift, and uncertainty entropy) are computed from model internals and unlabeled statistics that do not depend on the downstream AL strategy performance curves. To demonstrate independence from the particular segmented-regression fit, the revision will add (i) results using an alternative change-point algorithm (PELT) on the same proxy trajectories and (ii) a cross-validation protocol in which phase boundaries are estimated on the first 60 % of the labeling trajectory and alignment effects are evaluated on the held-out remainder. These checks will confirm that the reported strategy-phase alignments persist under different identification procedures. revision: yes
Circularity Check
Segmented regression on proxies defines phases post-hoc rather than recovering theory-predicted shifts
specific steps
-
fitted input called prediction
[Abstract]
"By reinterpreting PAC-style risk components as dynamic interacting terms, we prove that dominance shifts are structurally unavoidable, creating a moving bottleneck for generalization. We operationalize this using measurable proxies and a segmented regression procedure to identify a tripartite taxonomy: data-driven, transition, and model-driven phases."
The proof is claimed to establish unavoidable shifts, yet the taxonomy itself is produced by applying segmented regression to proxies on the labeling data. The regression procedure necessarily partitions the trajectory into segments; therefore the three phases and their boundaries are defined by the fit rather than being a priori signatures recovered from the structural argument.
full rationale
The paper asserts a structural proof that dominance shifts between reinterpreted PAC risk components are unavoidable and yield a tripartite taxonomy. However, the taxonomy is located via measurable proxies plus segmented regression, which by construction detects change points in the observed trajectories. This makes the phase boundaries and the resulting data-driven/transition/model-driven classification an output of the fitting procedure applied to the same labeling trajectories used to claim the taxonomy, rather than an independent consequence of the proof. The alignment explanation for AL strategies therefore rests on a fitted description.
Axiom & Free-Parameter Ledger
Reference graph
Works this paper leans on
-
[1]
In: Pacific-Asia Conf
Aghaee, A., Ghadiri, M., Baghshah, M.S.: Active distance-based clustering using k-medoids. In: Pacific-Asia Conf. Adv. Knowl. Discov. Data Min. pp. 253–264 (2016)
2016
-
[2]
Ash, J.T., Goel, S., Krishnamurthy, A., Kakade, S.M.: Gone fishing: Neural active learning with fisher embeddings. In: Adv. Neural Inform. Process. Syst. pp. 8927– 8939 (2021)
2021
-
[3]
Ash, J.T., Zhang, C., Krishnamurthy, A., Langford, J., Agarwal, A.: Deep batch active learning by diverse, uncertain gradient lower bounds. In: Int. Conf. Learn. Represent. (2020)
2020
-
[4]
Bae,W.,Sutherland,D.J.,Oliveira,G.L.:UncertaintyHerding:Oneactivelearning method for all label budgets. In: Int. Conf. Learn. Represent. (2025)
2025
-
[5]
Chen, T., Kornblith, S., Norouzi, M., Hinton, G.E.: A simple framework for con- trastive learning of visual representations. In: Int. Conf. Mach. Learn. pp. 1597– 1607 (2020)
2020
-
[6]
Improved Baselines with Momentum Contrastive Learning
Chen, X., Fan, H., Girshick, R., He, K.: Improved baselines with momentum con- trastive learning. arXiv:2003.04297 [cs.CV] (2020)
work page internal anchor Pith review Pith/arXiv arXiv 2003
-
[7]
Chen, X., Xie, S., He, K.: An empirical study of training self-supervised vision transformers. In: Int. Conf. Comput. Vis. pp. 9640–9649 (2021)
2021
-
[8]
Cortes, C., Mohri, M., Riley, M., Rostamizadeh, A.: Sample selection bias correc- tion theory. In: Int. Conf. Algorithmic Learn. Theory. pp. 38–53 (2008)
2008
-
[9]
Gal, Y., Islam, R., Ghahramani, Z.: Deep bayesian active learning with image data. In: Int. Conf. Mach. Learn. pp. 1183–1192 (2017)
2017
-
[10]
MethodsX 7, 100864 (2020)
Gessert, N., Nielsen, M., Shaikh, M., Werner, R., Schlaefer, A.: Skin lesion classifi- cation using ensembles of multi-resolution EfficientNets with meta data. MethodsX 7, 100864 (2020)
2020
-
[11]
Grill, J.B., Strub, F., Altché, F., Tallec, C., Richemond, P., Buchatskaya, E., Do- ersch, C., Avila Pires, B., Guo, Z., Gheshlaghi Azar, M., et al.: Bootstrap your own latent-a new approach to self-supervised learning. In: Adv. Neural Inform. Process. Syst. pp. 21271–21284 (2020)
2020
-
[12]
Hacohen, G., Dekel, A., Weinshall, D.: Active learning on a budget: Opposite strategies suit high and low budgets. In: Int. Conf. Mach. Learn. pp. 8175–8195 (2022)
2022
-
[13]
Springer (2009)
Hastie, T., Tibshirani, R., Friedman, J.H.: The Elements of Statistical Learning: Data Mining, Inference, and Prediction. Springer (2009)
2009
-
[14]
In: IEEE Conf
He, K., Zhang, X., Ren, S., Sun, J.: Deep residual learning for image recognition. In: IEEE Conf. Comput. Vis. Pattern Recog. pp. 770–778 (2016)
2016
-
[15]
In: 2019 IEEE Winter Conference on Applications of Computer Vision (WACV)
Kaushal, V., Iyer, R., Kothawade, S., Mahadev, R., Doctor, K., Ramakrishnan, G.: Learning from less data: A unified data subset selection and active learning framework for computer vision. In: 2019 IEEE Winter Conference on Applications of Computer Vision (WACV). pp. 1289–1299. IEEE (2019)
2019
-
[16]
Advances in neural information pro- cessing systems32(2019)
Kirsch, A., Van Amersfoort, J., Gal, Y.: Batchbald: Efficient and diverse batch acquisition for deep bayesian active learning. Advances in neural information pro- cessing systems32(2019)
2019
-
[17]
Krizhevsky, A.: Learning multiple layers of features from tiny images (2009)
2009
-
[18]
SIGIR Forum29, 13–19 (1995)
Lewis, D.D.: A sequential algorithm for training text classifiers: Corrigendum and additional data. SIGIR Forum29, 13–19 (1995)
1995
-
[19]
In: Chinese Conf
Liang, H., Qiang, S., Ma, H., Wan, J., Liang, Y.: Semantic segmentation active learning with scene coverage coreset. In: Chinese Conf. Biom. Recognit. pp. 238– 247 (2024) A Mechanism-Driven Theory of Phase Transitions in Active Learning 17
2024
-
[20]
IEEE Trans
Maalouf, A., Eini, G., Mussay, B., Feldman, D., Osadchy, M.: A unified approach to coreset learning. IEEE Trans. Neural Networks Learn. Syst. pp. 6893–6905 (2024)
2024
-
[21]
In: Northern Lights Deep Learn
Menden, V., Saleh, Y., Iske, A.: Bounds on the generalization error in active learn- ing. In: Northern Lights Deep Learn. Conf. pp. 168–175 (2025)
2025
-
[22]
MIT press (2012)
Mohri, M., Rostamizadeh, A., Talwalkar, A.: Foundations of machine learning. MIT press (2012)
2012
-
[23]
Scheffer, T., Decomain, C., Wrobel, S.: Active hidden markov models for informa- tion extraction. In: Int. Conf. Intell. Data Anal. pp. 309–318 (2001)
2001
-
[24]
Sener, O., Savarese, S.: Active learning for convolutional neural networks: A core- set approach. In: Int. Conf. Learn. Represent. (2018)
2018
-
[25]
Settles, B.: Active learning literature survey (2009)
2009
-
[26]
Electron
Sriperumbudur, B.K., Fukumizu, K., Gretton, A., Schölkopf, B., Lanckriet, G.R.: On the empirical estimation of integral probability metrics. Electron. J. Stat.6, 1550–1599 (2012)
2012
-
[27]
Valiant, L.G.: A theory of the learnable. Commun. ACM27(11), 1134–1142 (1984)
1984
-
[28]
Voevodski, K., Balcan, M.F., Röglin, H., Teng, S.H., Xia, Y.: Active clustering of biological sequences. J. Mach. Learn. Res.13, 203–225 (2012)
2012
-
[29]
In: International conference on machine learning
Wei, K., Iyer, R., Bilmes, J.: Submodularity in data subset selection and active learning. In: International conference on machine learning. pp. 1954–1963. PMLR (2015)
1954
-
[30]
Xu, Z., Yu, K., Tresp, V., Xu, X., Wang, J.: Representative sampling for text classification using support vector machines. In: Eur. Conf. Inf. Retr. pp. 393–407 (2003)
2003
-
[31]
gradient
Yehuda, O., Dekel, A., Hacohen, G., Weinshall, D.: Active learning through a covering lens. In: Adv. Neural Inform. Process. Syst. pp. 22354–22367 (2022) Appendix A Structural Properties of Bound Components Lemma 1 (Non-monotonic empirical risk under adaptive sampling). Letℓbe a bounded loss and letS t ⊂S t+1 withS t+1 =S t ∪A t. Suppose the learner retur...
2022
discussion (0)
Sign in with ORCID, Apple, or X to comment. Anyone can read and Pith papers without signing in.