REVIEW 3 major objections 5 minor 28 references
Shape Over Intensity: Directional Topological Encoding for False Positive Reduction in Intracranial Aneurysm Detection
T0 review · 3 major / 5 minor · reviewed 2026-07-11 · grok-4.5
Pith's one-line read Directional shape encoding (SECT) separates small aneurysms from vessel bifurcations that intensity-based networks confuse, reaching 0.943 AUC even on sub-3 mm lesions.
desk verdict Solid empirical win for directional topology on the aneurysm-vs-bifurcation patch task, especially for sub-3 mm lesions and across scanners; the plug-and-play claim is still untested against real CNN candidates. read the letter →
The pith
A machine-rendered reading of the paper's core claim, the machinery that carries it, and where it could break.
The reading
What carries the argument
Smooth Euler Characteristic Transform (SECT): a directional topological map that records how the Euler characteristic of a vascular mask evolves under height filtrations along many sphere directions, then smooths and concatenates those curves into a fixed vector that captures global geometric asymmetry rather than local intensity.
What would settle it
Insert SECT as a second-stage filter after a real high-sensitivity CNN detector on full multi-scanner CTA volumes and measure whether the lesion-level false-positive rate falls by a clinically meaningful margin while sensitivity on sub-3 mm aneurysms is preserved.
Extended reading notes
Core claim
The Smooth Euler Characteristic Transform encodes the asymmetric spatial layout of a vascular patch as a set of smooth directional curves; those curves alone discriminate saccular aneurysms from anatomically plausible bifurcations far better than direction-agnostic persistence images or landscapes (0.943 vs ~0.68 AUC), and the advantage is largest precisely on the small lesions that intensity networks miss.
Load-bearing premise
The mined patches—expert-centered aneurysms plus Frangi-extracted forks, random bright vessels and background tissue—must look like the real false-positive candidates a high-sensitivity CNN would actually generate on full scans.
Editorial analysis
A structured set of objections, weighed in public.
Referee Report
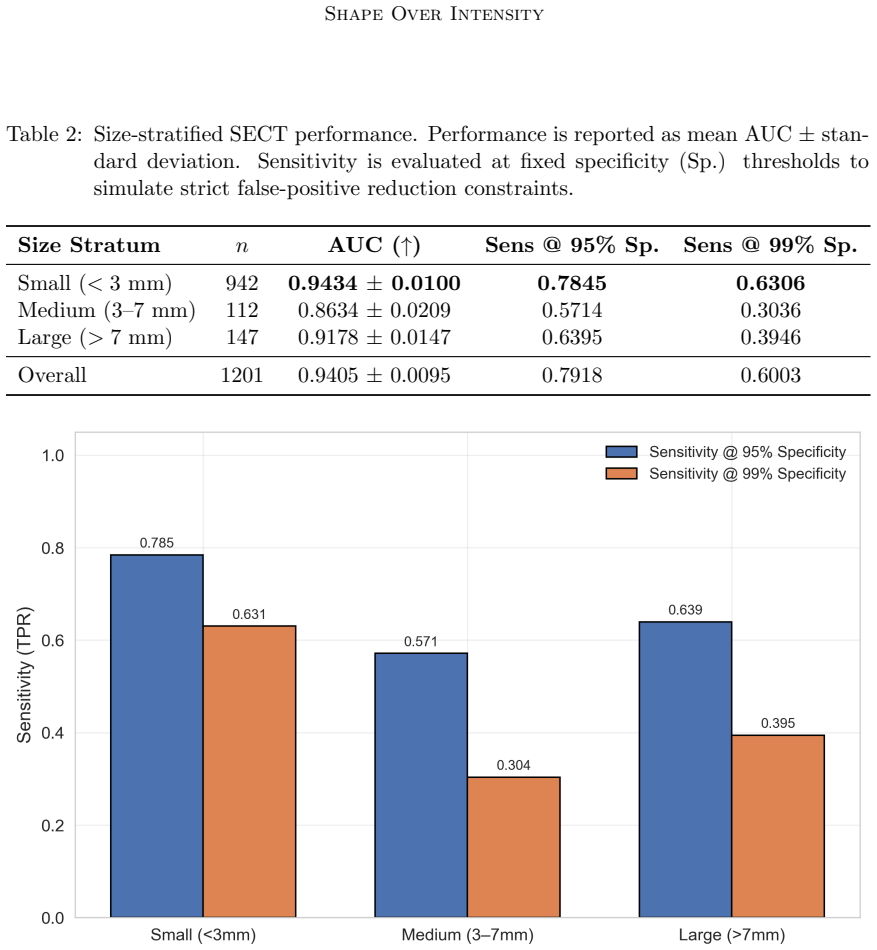
Summary. The paper proposes a plug-and-play false-positive reduction module for intracranial aneurysm (IA) detection on CTA that replaces intensity/texture cues with directional topological descriptors. On a patient-level stratified, size-enriched subset of the multi-scanner RSNA 2025 CTA cohort, the Smooth Euler Characteristic Transform (SECT) is shown to separate expert-annotated aneurysm patches from Frangi-mined bifurcations and other hard/easy negatives far better than direction-agnostic Persistence Images or Landscapes (AUC 0.943 vs ~0.68). SECT further exhibits a clinical inversion (strongest on the sub-3 mm stratum, 78.5 % sensitivity at 95 % specificity), maintains mean LOGO AUC 0.927 across four manufacturers, and remains stable under mixed negative compositions and controlled synthetic phantoms. The authors position SECT as a scanner-agnostic downstream filter for hybrid CNN pipelines.
Significance. If the geometric claim holds under real candidate generators, the work supplies a mathematically grounded remedy for the dominant clinical failure mode of current IA CAD systems—systematic confusion of saccular domes with healthy bifurcations—especially for the sub-3 mm lesions that drive most missed diagnoses. The multi-axis experimental design (size strata, LOGO, mixed negatives, bottleneck hierarchy, Lipschitz estimates, synthetic phantoms) and classifier-agnostic results are strengths; the offer of code on request further supports reproducibility. The contribution is therefore of clear interest to both the medical-imaging and topological-data-analysis communities, provided the translation gap is closed.
major comments (3)
- [3.3 / Alg. 1 / 5.1] Sections 3.3, Algorithm 1 and Limitations 5.1: every reported AUC, sensitivity-at-specificity and LOGO figure is measured exclusively against the TAXS negative pool (Frangi-mined bifurcations at 0.25 imes resolution + random hard maxima + easy tissue). The central claim that SECT is a “ready plug-and-play” filter that “reliably resolves the primary structural confounder” therefore rests on the untested axiom that this synthetic distribution matches the false-positive distribution of an actual high-sensitivity CNN candidate generator on full CTA volumes. Table 5 already shows an anomalous elevation of FPR on “easy” non-vascular tissue (0.122 vs 0.024 on Frangi), hinting at distribution sensitivity. Either a direct comparison of TAXS candidates to real CNN FPs or an end-to-end hybrid experiment is required before the integration claim can be sustained.
- [4.2 / Table 1] Section 4.2 and Table 1: the only baselines are other topological vectorizations (PI, PL). No intensity-based or vesselness-based FP-reduction classifier (e.g., a small 3-D CNN or Frangi+RF on the identical patches) is reported. Consequently it is impossible to quantify how much of the observed gain is truly topological versus simply the benefit of any global shape descriptor. A minimal non-topological control on the same TAXS set is needed to isolate the contribution of directional EC curves.
- [4.3 / Table 2] Table 2 and Appendix E.3: the medium (n=112) and large (n=147) strata are an order of magnitude smaller than the small-aneurysm cohort; the fixed 15 mm patch radius is acknowledged to truncate larger lesions. The reported sensitivity drop for medium/large aneurysms at 95–99 % specificity may therefore be an artifact of sample size and extraction geometry rather than a true geometric limitation of SECT. Either larger strata or an adaptive patch radius should be examined before the size-stratified “performance inversion” is presented as a clinical advantage.
minor comments (5)
- [Appendix A] Appendix A.2: “strengthed out choice” is a typographical error; “Phillips” should be “Philips” for consistency with Table 3.
- [3.4.1 / Fig. 1] Figure 1 caption and Section 3.4.1: the claim that H2 features encode “localized convexity” rather than enclosed cavities is important but only briefly justified; a short schematic of the superlevel filtration on a saccular versus bifurcation phantom would help non-TDA readers.
- [Table 1] Table 1: the empirical Lipschitz constants for PI/PL and SECT are computed in different metric spaces (Wasserstein vs. image-space σ); the text correctly notes this, yet the table layout invites direct numerical comparison. A footnote or separate columns would avoid misreading.
- [4.5] Section 4.5 / Table 5: the counter-intuitive ranking of FPRs (easy > Frangi > hard) deserves a short discussion of possible causes (dome-like tissue cross-sections, RF score calibration) rather than being left as an observation.
- [References] References: several recent TDA-medical-imaging surveys and SECT applications outside glioblastoma are missing; adding 2–3 would better situate the cerebrovascular novelty claim.
Circularity Check
No circularity: empirical patch-level classification of SECT vs PI/PL on held-out folds/scanners; no prediction reduces by construction to a fitted free parameter or self-defined quantity.
full rationale
The paper is an empirical machine-learning evaluation, not a first-principles derivation. SECT is imported from Crawford et al. (2020) with fixed hyperparameters (D=128, T=25, au_v=0.40) chosen by grid search on a small held-out subset and then frozen; all reported AUCs (0.943 overall, 0.943 on <3 mm, LOGO mean 0.927) are measured by 5-fold CV or leave-one-scanner-out on the remaining data and on independent synthetic phantoms (Appendix E.5). TAXS (Algorithm 1) constructs the negative class used for evaluation; it is an experimental design choice, not a quantity that is later “predicted.” No equation equates a claimed geometric invariant or performance number to an input that was fitted from the same target. Self-citations are absent; the only internal references are to the authors’ own appendices describing the same experiments. The work is therefore self-contained against its external benchmarks (RSNA 2025 patches, multi-scanner LOGO, synthetic saccular/bifurcation phantoms) and exhibits zero circular reduction.
Assumptions & free parameters
free parameters (6)
- persistence threshold ε =
0.15
- vascular mask threshold τv =
0.40
- SECT directions D and filtration steps T =
D=128, T=25
- patch physical radius =
15 mm
- intensity clipping range =
[0,839] HU
- Frangi mining parameters =
0.25×, σ={1,2}, top 0.2 %
assumptions (4)
- domain assumption H2 features under superlevel filtration encode localized convexity of aneurysm domes versus tubular branching of bifurcations.
- ad hoc to paper Frangi-mined hard negatives plus random hard and easy tissue patches adequately represent the false-positive distribution of a high-sensitivity CNN candidate generator.
- standard math Euler characteristic curves along uniformly sampled directions on the sphere, after mean-centering and integration, form a stable Hilbert-space representation of 3-D shape.
- domain assumption Patient-level splitting and one-positive-patch-per-aneurysm prevent data leakage.
invented entities (1)
-
Topology-Aware Extraction Sampling (TAXS)
Cite this review
Pith. "Pith review of Shape Over Intensity: Directional Topological Encoding for False Positive Reduction in Intracranial Aneurysm Detection." pith.science (2026). https://pith.science/paper/KGX4AYY7
@misc{pith2026260705317,
  author       = {Pith},
  title        = {Pith review of: Shape Over Intensity: Directional Topological Encoding for False Positive Reduction in Intracranial Aneurysm Detection},
  year         = {2026},
  howpublished = {\url{https://pith.science/paper/KGX4AYY7}},
  note         = {Machine review of arXiv:2607.05317}
}
read the original abstract
Automated detection of intracranial aneurysms (IAs) from CT angiography (CTA) is severely hindered by high false-positive rates. Convolutional neural networks (CNNs) rely on local pixel intensities, causing systematic confusion between saccular aneurysms and vascular bifurcations - a problem especially acute for small lesions (<3 mm), where detection sensitivity falls below 60%. We propose a plug-and-play, topology-aware false-positive reduction framework evaluating the Smooth Euler Characteristic Transform (SECT) - a directional representation encoding global 3D vascular geometry independently of intensity - against persistence-based summaries (Persistence Images and Landscapes), tested on a stratified subset of the RSNA 2025 dataset. SECT achieves an AUC of 0.943, substantially outperforming direction-agnostic methods (AUC ~0.68), and exhibits a clinical performance inversion: it excels on the sub-3 mm cohort, maintaining 0.943 AUC and 78.5% sensitivity at 95% specificity. The representation is also scanner-agnostic, achieving 0.927 mean AUC under leave-one-scanner-out (LOGO) validation across four manufacturers. By capturing asymmetric geometric invariants rather than intensity profiles, SECT reliably resolves the primary structural confounder in IA detection, positioning it as a robust downstream filter for hybrid deep-learning diagnostic pipelines.
Figures


Figures from the paper (9 more)


Reference graph
Works this paper leans on
-
[1]
, author=
Prevalence of unruptured intracranial aneurysms, with emphasis on sex, age, comorbidity, country, and time period: a systematic review and meta-analysis. , author=. The Lancet. Neurology , year=
-
[2]
Neurointervention , volume=
Methodological challenges in deep learning-based detection of intracranial aneurysms: a scoping review , author=. Neurointervention , volume=. 2025 , publisher=
2025
-
[3]
Medical Image Analysis , volume=
A survey of intracranial aneurysm detection and segmentation , author=. Medical Image Analysis , volume=. 2025 , publisher=
2025
-
[4]
Biomedicines , volume=
A systematic review of deep-learning methods for intracranial aneurysm detection in CT angiography , author=. Biomedicines , volume=. 2023 , publisher=
2023
-
[5]
https://kaggle.competitions/rsna-2025-intracranial-aneurysm-detection,2025
Jeff Rudie and Evan Calabrese and Robyn Ball and Peter Chang and Rennie Chen and Errol Colak and Maria Correia de Verdier and Luciano Prevedello and Tyler Richards and Rachit Saluja and Greg Zaharchuk and Jason Sho and Maryam Vazirabad and RSNA 2025 Intracranial Aneurysm Detection. https://kaggle.competitions/rsna-2025-intracranial-aneurysm-detection,2025...
2025
-
[6]
2025 , howpublished =
RSNA 2025 Intracranial Aneurysm Detection , author =. 2025 , howpublished =
2025
-
[7]
2014 , publisher =
A Short Course in Computational Geometry and Topology , author =. 2014 , publisher =
2014
-
[8]
2005 , publisher =
Topology for Computing , author =. 2005 , publisher =
2005
Show all 28 references
-
[9]
Journal of Machine Learning Research , volume =
Persistence images: A stable vector representation of persistent homology , author =. Journal of Machine Learning Research , volume =
-
[10]
Journal of Machine Learning Research , volume =
Statistical topological data analysis using persistence landscapes , author =. Journal of Machine Learning Research , volume =
-
[11]
Proceedings of the International Conference on Artificial Intelligence and Statistics , pages =
Perslay: A Neural Network Layer for Persistence Diagrams and New Graph Topological Signatures , author =. Proceedings of the International Conference on Artificial Intelligence and Statistics , pages =. 2020 , publisher =
2020
-
[12]
Topological Data Analysis: The Abel Symposium 2018 , pages =
The Persistence Landscape and Some of Its Properties , author =. Topological Data Analysis: The Abel Symposium 2018 , pages =. 2020 , publisher =
2018
-
[13]
Journal of the American Statistical Association , volume =
Predicting Clinical Outcomes in Glioblastoma: An Application of Topological and Functional Data Analysis , author =. Journal of the American Statistical Association , volume =
-
[14]
Neurosurgery , volume=
Morphology parameters for intracranial aneurysm rupture risk assessment , author=. Neurosurgery , volume=. 2008 , publisher=
2008
-
[15]
Patterns , volume=
Toward human intervention-free clinical diagnosis of intracranial aneurysm via deep neural network , author=. Patterns , volume=. 2021 , publisher=
2021
-
[16]
Insights into Imaging , volume=
Topological data analysis in medical imaging: current state of the art , author=. Insights into Imaging , volume=. 2023 , publisher=
2023
-
[17]
Tomography , volume=
Unraveling the Invisible: Topological Data Analysis as the New Frontier in Radiology’s Diagnostic Arsenal , author=. Tomography , volume=. 2025 , publisher=
2025
-
[18]
EPJ data science , volume=
A roadmap for the computation of persistent homology , author=. EPJ data science , volume=. 2017 , publisher=
2017
-
[19]
International Conference on Information Processing in Medical Imaging , pages=
Explicit topological priors for deep-learning based image segmentation using persistent homology , author=. International Conference on Information Processing in Medical Imaging , pages=. 2019 , organization=
2019
-
[20]
European Radiology , author=
Automated classification of normal and pathologic pulmonary tissue by topological texture features extracted from multi-detector CT in 3D , volume=. European Radiology , author=. 2008 , month=dec, pages=. doi:10.1007/s00330-008-1082-y , abstractNote=
2008 doi
-
[21]
Proceedings of the IEEE/CVF conference on computer vision and pattern recognition workshops , pages=
Pi-net: A deep learning approach to extract topological persistence images , author=. Proceedings of the IEEE/CVF conference on computer vision and pattern recognition workshops , pages=
-
[22]
arXiv preprint arXiv:1507.06217 , volume=
Persistence images: An alternative persistent homology representation , author=. arXiv preprint arXiv:1507.06217 , volume=
-
[23]
Information and Inference , author=
Persistent homology transform for modeling shapes and surfaces , volume=. Information and Inference , author=. 2014 , month=dec, pages=. doi:10.1093/imaiai/iau011 , number=
2014 doi
-
[24]
International conference on medical image computing and computer-assisted intervention , pages=
Multiscale vessel enhancement filtering , author=. International conference on medical image computing and computer-assisted intervention , pages=. 1998 , organization=
1998
-
[25]
International congress on mathematical software , pages=
The gudhi library: Simplicial complexes and persistent homology , author=. International congress on mathematical software , pages=. 2014 , organization=
2014
-
[26]
Journal of Medical Imaging , volume=
Graph neural networks for automatic extraction and labeling of the coronary artery tree in CT angiography , author=. Journal of Medical Imaging , volume=. 2024 , publisher=
2024
-
[27]
Journal of Medical Imaging , volume=
Graph convolutional networks for automated intracranial artery labeling , author=. Journal of Medical Imaging , volume=. 2024 , publisher=
2024
-
[28]
Medical Image Analysis , author=
Validation, comparison, and combination of algorithms for automatic detection of pulmonary nodules in computed tomography images: The LUNA16 challenge , volume=. Medical Image Analysis , author=. 2017 , pages=. doi:https://doi.org/10.1016/j.media.2017.06.015 , abstractNote=
2017 doi
Reviewed July 11, 2026 · model on record in the stance chip above.
Discussion (0). Continue with ORCID to comment.