REVIEW 3 major objections 71 references
A Roman-tuned model-fitting photometry pipeline recovers galaxy colors to tens of millimags and shows that correlated noise and joint multi-object fitting are required for reliable photo-z work.
Reviewed by Pith at T0; open to challenge. T0 means a machine referee read the full paper against a public rubric. the ladder, T0–T4 →
T0 review · grok-4.5
2026-07-14 15:04 UTC pith:N3YCTJS5
load-bearing objection Solid Roman–Rubin photometry prototype that nails three concrete requirements on sims; the idealized coadds are a real but openly stated limit, not a hidden collapse. the 3 major comments →
Robust Photometry for Roman High-Latitude Imaging Survey Cosmology Using Roman and Rubin Imaging
The pith
A machine-rendered reading of the paper's core claim, the machinery that carries it, and where it could break.
Core claim
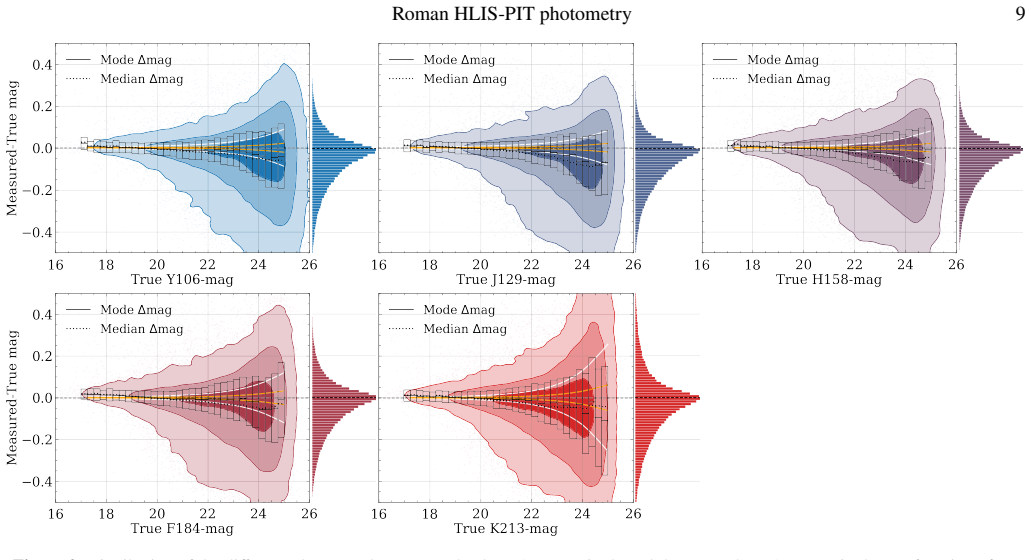
slimfarmer recovers galaxy colors with mode residuals within 20 millimag for Roman-based colors and within 70 millimag for Rubin-based colors; ignoring correlated noise underestimates photometric uncertainties by up to a factor of ~3; and only multi-object fitting applied consistently to both Roman and Rubin removes environment-dependent color biases of up to ~0.5 mag that otherwise degrade photo-z performance.
What carries the argument
slimfarmer: multi-object model fitting (via The Tractor) on groups defined by dilated segmentation maps, with flux uncertainties that fold in an empirical noise correlation function from coadd noise realizations and a model-updated inverse-variance weight that includes astronomical shot noise.
Load-bearing premise
The reported accuracy is measured on simplified coadds that avoid imperfect background subtraction and omit several known Roman detector effects, so the claim that real HLIS data will behave the same way is untested.
What would settle it
Apply the same pipeline to full end-to-end Roman coadds that include realistic background residuals and the omitted detector effects, then check whether Roman color mode residuals stay within 20 millimag and whether environment-dependent color biases reappear at the half-magnitude level.
Editorial analysis
A structured set of objections, weighed in public.
Referee Report
Summary. The paper presents slimfarmer, a Tractor-based multi-object photometry pipeline for Roman HLIS cosmology, with extensions for correlated noise in coadds, model-based astronomical shot noise in the weight maps, and forced photometry on matched Rubin simulations. Using OpenUniverse2024-based Roman coadds (DC25 sim) and corresponding Rubin images, the authors validate magnitude and color recovery against truth, show that default Tractor uncertainties underestimate scatter by up to ~3 without correlated-noise corrections, and demonstrate that consistent multi-object fitting (MOF) on both surveys removes environment-dependent color biases of up to ~0.5 mag that appear under single-object fitting (SOF). They further propagate photometric choices into SOMPZ tomographic n(z) overlap and FlexZBoost individual photo-z metrics, arguing that correlated-noise treatment, shot-noise modeling, and joint MOF are required ingredients for robust photo-z characterization in Roman–Rubin analyses.
Significance. If the demonstrated color accuracy, uncertainty calibration, and MOF environmental stability hold under more realistic processing, this is a useful and timely prototype for Roman HLIS catalog production and for joint Roman–Rubin photo-z work. The paper is concrete about what is required (correlated-noise variance, model-based shot noise, consistent MOF) rather than only reporting a black-box catalog. Strengths include systematic ablations (SOF vs MOF combinations; with/without correlated-noise correction; with/without Rubin), explicit uncertainty formulas (Eqs. 8 and 11), and two complementary photo-z diagnostics. The planned public release of slimfarmer and Roman SOMPZ configurations is a further positive. The main limitation is that the headline residual and uncertainty claims are demonstrated on idealized coadds that bypass imperfect background subtraction and omit several known detector effects, so the work is best read as a controlled pipeline study rather than a final end-to-end HLIS readiness claim.
major comments (3)
- Section 4.1: the magnitude and color validation that underpins the abstract claims (mode residuals within 20 mmag Roman / 70 mmag Rubin; uncertainty factor ~3) is performed on simplified images (true coadd + de-biasing field) chosen to avoid the 0.02–0.13 mag background oversubtraction found on the end-to-end coadds. That choice is stated, but the paper does not quantify how large residual background or coadd systematics would have to be before the mode color residuals or the MOF environmental stability fail. A short sensitivity test—e.g., re-running color residual vs nearest-neighbor and empirical-vs-model uncertainty ratios on a subset of end-to-end coadds, or injecting controlled background residuals—would make the central performance claims load-bearing for real HLIS products rather than only for idealized noise realizations.
- Section 2.1 and the uncertainty derivation in §3.3.2 / Eq. (11): the simulations omit brighter-fatter, persistence, ghosts, vertical trailing, and count-rate nonlinearity, while the correlated-noise correction assumes translation-invariant r(α,β) within each 1.66′ block estimated from de-biasing fields. Appendix B separates detector vs pyimcom contributions for the included effects, but does not bound how omitted detector correlations would bias the variance formula or the ~3 underestimation factor. Either a quantitative argument that residual correlations are sub-dominant for the S/N>18 sample (beyond the <0.01% pixel-area remark for BFE) or an explicit statement that the uncertainty-calibration claim is provisional pending those effects would strengthen the paper’s main methodological recommendation.
- Section 5.1 and Appendix D: the SOMPZ tests use the same photometry for deep and wide SOM assignments and assume a representative 30% spectroscopic subsample. That isolates photometric quality, but it also removes transfer-function realism and spectroscopic selection—precisely the regimes where photo-z methods are most sensitive to color and uncertainty errors. The claim that correlated-noise correction and Rubin bands are essential for tomographic binning is therefore demonstrated only under optimistic calibration conditions. At minimum, the text should more clearly separate “photometry-limited bin separation under ideal calibration” from “end-to-end SOMPZ readiness,” and preferably include one degraded-calibration or transfer-function test so that the n(z)-overlap conclusions are not over-read.
Circularity Check
Empirical pipeline validation against independent simulation truth; only mild circularity from hyperparameter tuning on the same sims used for performance claims.
specific steps
-
fitted input called prediction
[Section 3.2.1 (Model selections)]
"Based on our simulation tests, we adopt δ_SG=0.1, χ^{2}_ED=0.15, χ^{2}_force,C=0.15, and δ_ED=0.1, as these values provide the best overall performance in terms of magnitude recovery, detection purity, and completeness. We therefore fix to these values throughout the paper."
The decision-tree tolerances that control which galaxy model is assigned are selected by maximizing magnitude recovery (and purity/completeness) on the same DC25 sim used later to report the 20/70 mmag color residual modes. The reported residual performance is therefore mildly conditioned on hyperparameters already optimized for residual quality on those sims; it is ordinary tuning rather than a forced prediction, but it is the only place where a claimed performance metric is not fully independent of the configuration choices.
full rationale
The paper is a methods/validation paper for slimfarmer, not a first-principles derivation of a physical law. Its central claims (mode color residuals within 20 mmag Roman / 70 mmag Rubin; Tractor uncertainties underestimate empirical scatter by up to ~3 without correlated-noise correction; consistent MOF required to remove ~0.5 mag environment-dependent color bias) are measured by comparing measured photometry to the OpenUniverse2024 truth catalog on held-out simulation products. The correlated-noise variance formula (Eq. 11) is a standard propagation of the estimated noise correlation function r(Δx,Δy) from independent noise realizations; it is not fitted to force the residual statistics. The MOF vs SOF comparison is an ablation against truth, not a tautology. The only mild circularity is that the model-selection tolerances (δ_SG=0.1, χ^{2}_ED=0.15, etc.) were chosen as those that 'provide the best overall performance' on the same simulations used for the validation plots; this is ordinary hyperparameter tuning and does not make the residual modes or the factor-of-3 underestimation true by construction. No uniqueness theorem, self-citation load-bearing premise, or fitted-input-called-prediction is present. Score 1.5 reflects that single minor self-tuning step without load-bearing circularity of the scientific claims.
Axiom & Free-Parameter Ledger
free parameters (4)
- δ_SG, χ²_ED, χ²_force,C, δ_ED =
0.1 / 0.15 / 0.15 / 0.1
- segmentation dilation radius =
0.2 arcsec
- S/N > 18 source selection =
18
- Gaussian position prior width for Rubin forced photometry =
0.1 arcsec
axioms (5)
- ad hoc to paper Within each 1.66′×1.66′ block the noise correlation function depends only on pixel separation (translation invariance).
- domain assumption OpenUniverse2024 + DC25 sim (with listed detector effects) are sufficiently realistic for photometry and photo-z validation of HLIS.
- domain assumption Galaxy light profiles are adequately described by the Tractor PS/SG/Exp/Dev/Comp family (Gaussian-mixture approximations).
- ad hoc to paper 30 % of source galaxies have representative spectroscopic redshifts for the photo-z tests.
- ad hoc to paper Same photometry can be used for both deep and wide SOM assignments (no transfer-function realism).
invented entities (1)
-
slimfarmer
no independent evidence
read the original abstract
Accurate and precise photometry is essential for Roman cosmology because it affects photometric-redshift performance, galaxy and cluster selection, tomographic binning, and redshift-distribution characterization. Achieving robust photometry is challenging because Roman's depth leads to substantial source blending, particularly in joint Roman--Rubin analyses, where the two surveys have different spatial resolutions. In this work, we develop and validate slimfarmer, a model-fitting photometry pipeline designed for Roman High-Latitude Imaging Survey (HLIS) cosmological analyses. Building on The Farmer, slimfarmer introduces treatments of the correlated noise present in Roman images and of astronomical shot noise, together with model-fitting configurations tuned for Roman imaging. We validate the pipeline using Roman coadded simulated images and perform forced photometry on matched Rubin image simulations. We find that slimfarmer recovers galaxy colors with the mode of the color residuals within 20 millimag for Roman-based colors and within 70 millimag for Rubin-based colors. Properly accounting for correlated noise is essential for uncertainty quantification, as photometric uncertainties are otherwise underestimated by up to a factor of ~3. We also find that applying multi-object fitting consistently to both Roman and Rubin imaging substantially mitigates blending-induced color systematics. In crowded regions, single-object fitting produces environment-dependent color biases of up to ~0.5 mag, leading to environment-dependent degradation of photometric-redshift performance. Together, these results establish slimfarmer as a prototype photometric pipeline for Roman HLIS cosmology applications and identify the correlated-noise corrections, astronomical shot-noise treatment, and joint Roman--Rubin multi-object fitting required for robust photometric-redshift characterization.
Figures



Reference graph
Works this paper leans on
-
[1]
2025, SITCOMTN-128: Unrecognized Blends in LSSTComCam Data Preview 1 ECDFS, Tech
Adari, P., & von der Linden, A. 2025, SITCOMTN-128: Unrecognized Blends in LSSTComCam Data Preview 1 ECDFS, Tech. rep., NSF-DOE Vera C. Rubin Observatory, doi: 10.71929/RUBIN/2570850
-
[2]
Akeson, R., Armus, L., Bachelet, E., et al. 2019, The Wide Field Infrared Survey Telescope: 100 Hubbles for the 2020s, arXiv e-prints, arXiv:1902.05569, doi: 10.48550/arXiv.1902.05569
-
[3]
Akeson, R., Dubois-Felsmann, G. P., Crill, B. P., et al. 2025, The SPHEREx Image and Spectrophotometry Processing Pipeline, arXiv e-prints, arXiv:2511.15823, doi: 10.48550/arXiv.2511.15823
-
[4]
Anbajagane, D., Tabbutt, M., Beas-Gonzalez, J., et al. 2025, Dark Energy Survey Year 6 Results: Synthetic-source Injection Across the Full Survey Using Balrog, The Open Journal of Astrophysics, 8, 65, doi: 10.33232/001c.138627
-
[5]
2011, LePHARE: Photometric Analysis for Redshift Estimate,, Astrophysics Source Code Library, record ascl:1108.009 http://ascl.net/1108.009
Arnouts, S., & Ilbert, O. 2011, LePHARE: Photometric Analysis for Redshift Estimate,, Astrophysics Source Code Library, record ascl:1108.009 http://ascl.net/1108.009
2011
-
[6]
Barbary, K. 2016, SEP: Source Extractor as a library, The Journal of Open Source Software, 1, 58, doi: 10.21105/joss.00058
-
[7]
Bernstein, G. M., Abbott, T. M. C., Desai, S., et al. 2017, Instrumental response model and detrending for the Dark Energy Camera, PASP, 129, 114502, doi: 10.1088/1538-3873/aa858e
-
[8]
1996, SExtractor: Software for source extraction., A&AS, 117, 393, doi: 10.1051/aas:1996164
Bertin, E., & Arnouts, S. 1996, SExtractor: Software for source extraction., A&AS, 117, 393, doi: 10.1051/aas:1996164
-
[9]
2020, The SourceXtractor++ Software, in Astronomical Society of the Pacific Conference Series, Vol
Bertin, E., Schefer, M., Apostolakos, N., et al. 2020, The SourceXtractor++ Software, in Astronomical Society of the Pacific Conference Series, Vol. 527, Astronomical Data Analysis Software and Systems XXIX, ed. R. Pizzo, E. R. Deul, J. D. Mol, J. de Plaa, & H. Verkouter, 461
2020
-
[10]
2018, The Hyper Suprime-Cam software pipeline, PASJ, 70, S5, doi: 10.1093/pasj/psx080
Bosch, J., Armstrong, R., Bickerton, S., et al. 2018, The Hyper Suprime-Cam software pipeline, PASJ, 70, S5, doi: 10.1093/pasj/psx080
-
[11]
Bosch, J., AlSayyad, Y., Armstrong, R., et al. 2019, An Overview of the LSST Image Processing Pipelines, in Astronomical Society of the Pacific Conference Series, Vol. 523, Astronomical Data Analysis Software and Systems XXVII, ed. P. J. Teuben, M. W. Pound, B. A. Thomas, & E. M. Warner, 521, doi: 10.48550/arXiv.1812.03248
-
[12]
Campos, A., Yin, B., Dodelson, S., et al. 2024, Enhancing weak lensing redshift distribution characterization by optimizing the Dark Energy Survey Self-Organizing Map Photo-z method, arXiv e-prints, arXiv:2408.00922, doi: 10.48550/arXiv.2408.00922
-
[13]
Cao, K., Hirata, C. M., Laliotis, K., et al. 2025, Simulating Image Coaddition with the Nancy Grace Roman Space Telescope. III. Software Improvements and New Linear Algebra Strategies, ApJS, 277, 55, doi: 10.3847/1538-4365/adb580
-
[14]
Cao, K., Hirata, C. M., Laliotis, K., et al. 2026a, Simulating Image Coaddition with the Nancy Grace Roman Space Telescope. IV. Hyperparameter Optimization and Experimental Features, ApJ, 998, 304, doi: 10.3847/1538-4357/ae3a97
-
[15]
Cao, K., Weinberg, D. H., Miranda, V., et al. 2026b, Fisher Forecasts for Cosmological Yields from 3×2pt Analysis of the Roman Space Telescope High Latitude Imaging Survey, arXiv e-prints, arXiv:2601.00438, doi: 10.48550/arXiv.2601.00438
-
[16]
2022, Determining the Best-Fitting Slope and Its Uncertainity for Up-the-Ramp Sampled Images with Unevenly Distributed Resultants, Tech
Casertano, S. 2022, Determining the Best-Fitting Slope and Its Uncertainity for Up-the-Ramp Sampled Images with Unevenly Distributed Resultants, Tech. Rep. Technical Report Roman-STScI-000394, STScI
2022
-
[17]
Choi, A., & Hirata, C. M. 2020, Brighter-fatter Effect in Near-infrared Detectors. II. Autocorrelation Analysis of H4RG-10 Flats, PASP, 132, 014502, doi: 10.1088/1538-3873/ab4504
-
[18]
Dalmasso, N., Pospisil, T., Lee, A. B., et al. 2020, Conditional density estimation tools in python and R with applications to photometric redshifts and likelihood-free cosmological inference, Astronomy and Computing, 30, 100362, doi: 10.1016/j.ascom.2019.100362
-
[19]
2021, The Roman Space Telescope Relative Calibration System and the Dark Energy Figure of
Deustua, S., Rubin, D., Hounsell, R., et al. 2021, The Roman Space Telescope Relative Calibration System and the Dark Energy Figure of
2021
-
[20]
Merit, Research Notes of the American Astronomical Society, 5, 66, doi: 10.3847/2515-5172/abf1fb
-
[21]
Drlica-Wagner, A., Sevilla-Noarbe, I., Rykoff, E. S., et al. 2018, Dark Energy Survey Year 1 Results: The Photometric Data Set for Cosmology, ApJS, 235, 33, doi: 10.3847/1538-4365/aab4f5 Roman HLIS-PIT photometry 19
-
[22]
Eifler, T., Miyatake, H., Krause, E., et al. 2021, Cosmology with the Roman Space Telescope - multiprobe strategies, MNRAS, 507, 1746, doi: 10.1093/mnras/stab1762
-
[23]
Erwin, P. 2015, IMFIT: A Fast, Flexible New Program for Astronomical Image Fitting, ApJ, 799, 226, doi: 10.1088/0004-637X/799/2/226 Euclid Collaboration, Zalesky, L., McPartland, C. J. R., et al. 2025, Euclid preparation: LXI. Cosmic Dawn Survey: ’Pre-launch’ multiwavelength catalogues for Euclid Deep Field North and Euclid Deep Field Fornax, A&A, 695, A2...
-
[24]
Everett, S., Yanny, B., Kuropatkin, N., et al. 2022, Dark Energy Survey Year 3 Results: Measuring the Survey Transfer Function with Balrog, ApJS, 258, 15, doi: 10.3847/1538-4365/ac26c1
-
[25]
M., Masters, D
Feder, R. M., Masters, D. C., Lee, B., et al. 2024, The Universe SPHEREx Will See: Empirically Based Galaxy Simulations and Redshift
2024
-
[26]
Predictions, ApJ, 972, 68, doi: 10.3847/1538-4357/ad596d
-
[27]
Freudenburg, J. K. C., Givans, J. J., Choi, A., et al. 2020, Brighter-fatter Effect in Near-infrared Detectors—III. Fourier-domain Treatment of Flat Field Correlations and Application to WFIRST, PASP, 132, 074504, doi: 10.1088/1538-3873/ab9503
-
[28]
Hirata, C. M., & Choi, A. 2020, Brighter-fatter Effect in Near-infrared Detectors. I. Theory of Flat Autocorrelations, PASP, 132, 014501, doi: 10.1088/1538-3873/ab44f7
-
[29]
M., Yamamoto, M., Laliotis, K., et al
Hirata, C. M., Yamamoto, M., Laliotis, K., et al. 2024, Simulating image coaddition with the Nancy Grace Roman Space Telescope - I. Simulation methodology and general results, MNRAS, 528, 2533, doi: 10.1093/mnras/stae182
-
[30]
Hogg, D. W., & Lang, D. 2013, Replacing Standard Galaxy Profiles with Mixtures of Gaussians, PASP, 125, 719, doi: 10.1086/671228
doi:10.1086/671228 2013
-
[31]
Huai, Z., Bock, J. J., Cheng, Y.-T., et al. 2026, Simulating Spectral Confusion in SPHEREx Photometry and Redshifts, ApJ, 1000, 56, doi: 10.3847/1538-4357/ae472b Ivezi´c, ˇZ., Kahn, S. M., Tyson, J. A., et al. 2019a, LSST: From Science Drivers to Reference Design and Anticipated Data Products, ApJ, 873, 111, doi: 10.3847/1538-4357/ab042c
-
[32]
Izbicki, R., & Lee, A. B. 2017, Converting High-Dimensional Regression to High-Dimensional Conditional Density Estimation, arXiv e-prints, arXiv:1704.08095, doi: 10.48550/arXiv.1704.08095
work page internal anchor Pith review Pith/arXiv arXiv doi:10.48550/arxiv.1704.08095 2017
-
[33]
Jenness, T., Bosch, J. F., Salnikov, A., et al. 2022, The Vera C. Rubin Observatory Data Butler and pipeline execution system, in Society of Photo-Optical Instrumentation Engineers (SPIE) Conference Series, Vol. 12189, Software and Cyberinfrastructure for Astronomy VII, 1218911, doi: 10.1117/12.2629569
-
[34]
Kron, R. G. 1980, Photometry of a complete sample of faint galaxies., ApJS, 43, 305, doi: 10.1086/190669
doi:10.1086/190669 1980
-
[35]
Kuijken, K. 2008, GaaP: PSF- and aperture-matched photometry using shapelets, A&A, 482, 1053, doi: 10.1051/0004-6361:20066601
-
[36]
Laliotis, K., Hirata, C. M., Macbeth, E., & Cao, K. 2026, Removing correlated noise stripes from the Nancy Grace Roman Space Telescope survey images, PASJ, doi: 10.1093/pasj/psag020
-
[37]
Laliotis, K., Macbeth, E., Hirata, C. M., et al. 2024, Analysis of Biasing from Noise from the Nancy Grace Roman Space Telescope: Implications for Weak Lensing, PASP, 136, 124506, doi: 10.1088/1538-3873/ad9bec
-
[38]
Lang, D. 2020, A hybrid Fourier–Real Gaussian Mixture method for fast galaxy–PSF convolution, arXiv e-prints, arXiv:2012.15797, doi: 10.48550/arXiv.2012.15797
-
[39]
W., & Mykytyn, D
Lang, D., Hogg, D. W., & Mykytyn, D. 2016, The Tractor: Probabilistic astronomical source detection and measurement,, Astrophysics Source Code Library, record ascl:1604.008 http://ascl.net/1604.008
2016
-
[40]
Leung, G. C. K., Finkelstein, S. L., Weaver, J. R., et al. 2023, The Spitzer-HETDEX Exploratory Large-Area Survey. IV. Model-based Multiwavelength Photometric Catalog, ApJS, 269, 46, doi: 10.3847/1538-4365/acfe78
-
[41]
Lin, C.-H., Mandelbaum, R., Troxel, M. A., Hirata, C. M., & Jarvis, M. 2022, Impact of image persistence in the Roman Space Telescope High-Latitude Survey, MNRAS, 512, 3312, doi: 10.1093/mnras/stac512
-
[42]
2009, Aperture Photometry Uncertainties assuming Priors and Correlated Noise,, https: //web.ipac.caltech.edu/staff/fmasci/home/mystats/ApPhotUncert corr.pdf
Masci, F. 2009, Aperture Photometry Uncertainties assuming Priors and Correlated Noise,, https: //web.ipac.caltech.edu/staff/fmasci/home/mystats/ApPhotUncert corr.pdf
2009
-
[43]
Melchior, P., Moolekamp, F., Jerdee, M., et al. 2018, SCARLET: Source separation in multi-band images by Constrained Matrix Factorization, Astronomy and Computing, 24, 129, doi: 10.1016/j.ascom.2018.07.001
-
[44]
Melchior, P., Ward, C., Remy, B., Wiemann, M. L., & Siegel, J. 2026, scarlet2: Astronomical scene modeling in JAX, Journal of Open Source Software, 11, 9646, doi: 10.21105/joss.09646
-
[45]
Myles, J., Alarcon, A., Amon, A., et al. 2021, Dark Energy Survey Year 3 results: redshift calibration of the weak lensing source galaxies, MNRAS, 505, 4249, doi: 10.1093/mnras/stab1515
-
[46]
Newman, J. A., & Gruen, D. 2022, Photometric Redshifts for Next-Generation Surveys, ARA&A, 60, 363, doi: 10.1146/annurev-astro-032122-014611
-
[47]
Nyland, K., Lacy, M., Sajina, A., et al. 2017, An Application of Multi-band Forced Photometry to One Square Degree of SERVS: Accurate Photometric Redshifts and Implications for Future Science, ApJS, 230, 9, doi: 10.3847/1538-4365/aa6fed
-
[48]
Oke, J. B., & Gunn, J. E. 1983, Secondary standard stars for absolute spectrophotometry., ApJ, 266, 713, doi: 10.1086/160817
doi:10.1086/160817 1983
-
[49]
OpenUniverse, LSST Dark Energy Science Collaboration, Roman HLIS Project Infrastructure, et al. 2025, OpenUniverse2024: a shared, simulated view of the sky for the next generation of cosmological surveys, MNRAS, 544, 3799, doi: 10.1093/mnras/staf1833
-
[50]
Peng, C. Y., Ho, L. C., Impey, C. D., & Rix, H.-W. 2002, Detailed Structural Decomposition of Galaxy Images, AJ, 124, 266, doi: 10.1086/340952
doi:10.1086/340952 2002
-
[51]
Peng, C. Y., Ho, L. C., Impey, C. D., & Rix, H.-W. 2010, Detailed Decomposition of Galaxy Images. II. Beyond Axisymmetric Models, AJ, 139, 2097, doi: 10.1088/0004-6256/139/6/2097
-
[52]
Rauscher, B. J. 2015, Teledyne H1RG, H2RG, and H4RG Noise Generator, PASP, 127, 1144, doi: 10.1086/684082
-
[53]
J., Arendt, R
Rauscher, B. J., Arendt, R. G., Fixsen, D. J., et al. 2012, Reducing the read noise of HAWAII-2RG detector systems with improved reference sampling and subtraction (IRS2), in Society of Photo-Optical Instrumentation Engineers (SPIE) Conference Series, Vol. 8453, High
2012
-
[54]
Energy, Optical, and Infrared Detectors for Astronomy V, ed. A. D. Holland & J. W. Beletic, 84531F, doi: 10.1117/12.926089 Roman HLIS Cosmology PIT, Hirata, C., various team members, & in prep. 2026, PyIMCOM 5 deg2 run release notes, Roman Observations Time Allocation Committee, & Core Community Survey Definition Committees. 2025, Roman Observations Time ...
-
[55]
2011, Optimal Linear Image
Rowe, B., Hirata, C., & Rhodes, J. 2011, Optimal Linear Image
2011
-
[56]
Combination, ApJ, 741, 46, doi: 10.1088/0004-637X/741/1/46
-
[57]
Sanchez, J., Mendoza, I., Kirkby, D. P., Burchat, P. R., & LSST Dark Energy Science Collaboration. 2021, Effects of overlapping sources on cosmic shear estimation: Statistical sensitivity and pixel-noise bias, J. Cosmology Astropart. Phys., 2021, 043, doi: 10.1088/1475-7516/2021/07/043 S´anchez, J., Walter, C. W., Awan, H., et al. 2020, The LSST DESC data...
-
[58]
Sevilla-Noarbe, I., Bechtol, K., Carrasco Kind, M., et al. 2021, Dark Energy Survey Year 3 Results: Photometric Data Set for Cosmology, ApJS, 254, 24, doi: 10.3847/1538-4365/abeb66
-
[59]
Sharma, S., & Casertano, S. 2024, Cosmic Ray Jump Detection for the Roman Wide Field Instrument, PASP, 136, 054504, doi: 10.1088/1538-3873/ad4b9e
-
[60]
Sheldon, E. S., Becker, M. R., Jarvis, M., Armstrong, R., & LSST Dark Energy Science Collaboration. 2023, Metadetection Weak Lensing for the Vera C. Rubin Observatory, The Open Journal of Astrophysics, 6, 17, doi: 10.21105/astro.2303.03947
-
[61]
Sheldon, E. S., Becker, M. R., MacCrann, N., & Jarvis, M. 2020, Mitigating Shear-dependent Object Detection Biases with Metacalibration, ApJ, 902, 138, doi: 10.3847/1538-4357/abb595
-
[62]
Spergel, D., Gehrels, N., Baltay, C., et al. 2015, Wide-Field InfrarRed Survey Telescope-Astrophysics Focused Telescope Assets WFIRST-AFTA 2015 Report, arXiv e-prints, arXiv:1503.03757, doi: 10.48550/arXiv.1503.03757 20 To et al. The RAIL Team, van den Busch, J. L., Charles, E., et al. 2025, Redshift Assessment Infrastructure Layers (RAIL): Rubin-era phot...
-
[63]
Tortorelli, L., & Mercurio, A. 2023, MORPHOFIT: An automated galaxy structural parameters fitting package, Frontiers in Astronomy and Space Sciences, 10, 51, doi: 10.3389/fspas.2023.989443 Vera C. Rubin Observatory Science Pipelines Developers. 2025, The LSST Science Pipelines Software: Optical Survey Pipeline Reduction and Analysis Environment, Project S...
-
[64]
R., Kauffmann, O
Weaver, J. R., Kauffmann, O. B., Ilbert, O., et al. 2022, COSMOS2020: A Panchromatic View of the Universe to z∼10 from Two Complementary
2022
-
[65]
Catalogs, ApJS, 258, 11, doi: 10.3847/1538-4365/ac3078
-
[66]
R., Zalesky, L., Kokorev, V., et al
Weaver, J. R., Zalesky, L., Kokorev, V., et al. 2023, The Farmer: A Reproducible Profile-fitting Photometry Package for Deep Galaxy
2023
-
[67]
Surveys, ApJS, 269, 20, doi: 10.3847/1538-4365/acf850
-
[68]
Yamamoto, M., Becker, M. R., Sheldon, E., et al. 2025, Dark Energy Survey Year 6 results: cell-based coadds and METADETECTION weak lensing shape catalogue, MNRAS, 543, 4156, doi: 10.1093/mnras/staf1661
-
[69]
Yin, B., Amon, A., Campos, A., et al. 2025, Dark Energy Survey Year 6 Results: Redshift Calibration of the Weak Lensing Source Galaxies, arXiv e-prints, arXiv:2510.23566, doi: 10.48550/arXiv.2510.23566
-
[70]
Accurate modeling for 3$\times$2pt analyses in Roman and Rubin: a study of model approximations
Zhang, J., Chang, C., Xu, J., et al. 2026, Accurate modeling for 3×2pt analyses in Roman and Rubin: a study of model approximations, arXiv e-prints, arXiv:2606.23781, doi: 10.48550/arXiv.2606.23781
work page internal anchor Pith review Pith/arXiv arXiv doi:10.48550/arxiv.2606.23781 2026
-
[71]
Zhang, T., Charles, E., Crenshaw, J. F., et al. 2026, Photometric Redshift Estimation for Rubin Observatory Data Preview 1 with Redshift Assessment Infrastructure Layers (RAIL), MNRAS, doi: 10.1093/mnras/stag1012 A WEIGHT MAP In this appendix, we detail how the inverse variance weight is derived from the available PyIMCOM product. Here we follow the notat...
discussion (0)
Sign in with ORCID, Apple, or X to comment. Anyone can read and Pith papers without signing in.