REVIEW 4 major objections 5 minor 40 references
A residual neural network trained on the IllustrisTNG300 simulation corrects the classical Projected Mass Estimator's systematic overestimate, reducing the simulated mass ratio from ~1.3–1.5 to 1.02 and yielding a Milky Way mass of 1.144 ×
Reviewed by Pith at T0; open to challenge. T0 means a machine referee read the full paper against a public rubric. the ladder, T0–T4 →
T0 review · deepseek-v4-flash
2026-08-01 23:39 UTC pith:VOLLHCHO
load-bearing objection Core PME bias result and MLP calibration are solid on TNG, but the headline Milky Way mass is taken from an extrapolative regime the authors themselves flag, and the EAGLE validation is inconsistently reported. the 4 major comments →
Tighter Dark Matter Constraints from the Projected Mass Method: A Neural Network Enhanced Method for Galaxy Groups and Clusters
The pith
A machine-rendered reading of the paper's core claim, the machinery that carries it, and where it could break.
Core claim
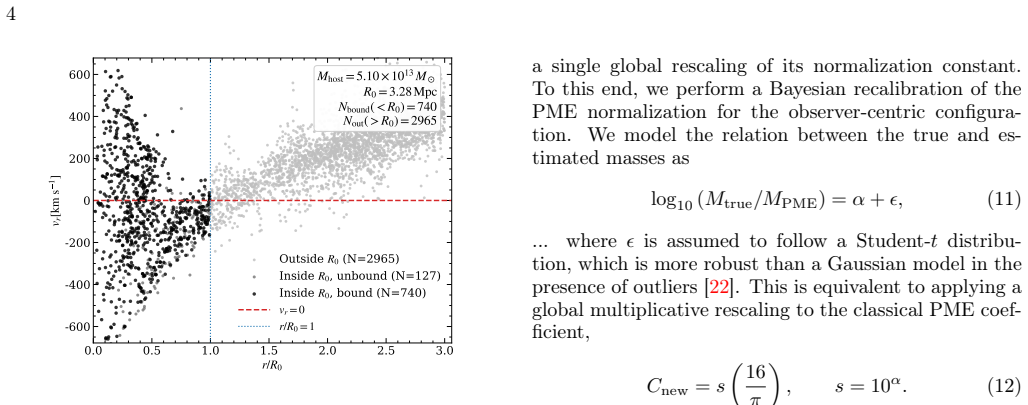
The central claim is that the systematic bias of the Projected Mass Estimator originates from its fixed isotropic coefficient C = 16/π, and that this bias can be learned and removed by a residual multi-layer perceptron trained on cosmological simulations. The network takes four summary features — the turnaround radius R0 derived from the PME mass, the raw PME mass, the line-of-sight velocity dispersion σ_v, and the mean line-of-sight velocity — and predicts the logarithmic residual Δ = log10(M_true/M_PME). Because models are trained separately for each tracer count N from 5 to 50, the correction adapts to the noise regime of sparse samples. On independent test halos the corrected mass ratio
What carries the argument
The central object is the Projected Mass Estimator, M_PME = (16/π G N) Σ v_los² R, whose coefficient C encodes projection geometry and orbital anisotropy; the paper measures ⟨e²⟩ ≈ 0.57 in TNG300, i.e., radial bias, rendering C = 16/π too large. The correction machinery is a residual MLP with three residual blocks, layer normalization, and GELU activations, trained to predict the logarithmic mass residual using four features (log R0, log M_PME, σ_v, |v_los|). The N-segmented training strategy — independent models per tracer number — is what lets the network account for the small-sample noise that a single universal recalibration (C_new ≈ 3.97) cannot remove.
Load-bearing premise
The calibration rests on the assumption that the N most massive bound subhalos in IllustrisTNG300 stand in for the N brightest observed satellites, with the same radial anisotropy (⟨e²⟩ ≈ 0.57), so once faint satellites without simulated counterparts are included, the correction becomes an extrapolation.
What would settle it
Apply the trained N=20 model to a galaxy group or cluster whose mass is independently known from weak lensing or X-ray hydrostatics; if the corrected PME differs from the independent mass by more than the 0.13 dex scatter quoted here, the simulation-based calibration fails to transfer to real systems.
If this is right
- Existing halo masses derived with the classical PME in the isotropic limit are likely systematically high by ~30–45%; applying a factor ≈0.78 correction would remove the median bias.
- Satellite-based mass measurements of nearby groups can reach ~0.13 dex precision, competitive with more expensive dynamical modeling, even with as few as 5–10 tracers.
- Mass-to-light ratios and dark-matter-dominated fractions for galaxy groups and clusters should be re-evaluated using the corrected masses.
- The cross-simulation validation suggests the learned correction captures orbital-anisotropy effects common across ΛCDM hydrodynamical simulations, so the network may transfer to other simulation-based mass estimators.
Where Pith is reading between the lines
- The reliance on abundance matching (most massive subhalos ↔ brightest satellites) is the most fragile link; the paper's own Milky Way test shows drift once faint satellites like Hydrus I enter, suggesting the method should be restricted to the brightest tracers or retrained with explicit luminosity–mass scatter.
- A direct testable extension would be to train the same residual-learning architecture on other estimators (virial theorem, caustics) to see whether the learned corrections are estimator-specific or encode the same radial-anisotropy bias.
- The feature-importance result — that σ_v dominates while anisotropy descriptors add little — implies the network is effectively learning a velocity-dispersion-based scaling; this could be distilled into an analytic correction formula for easier adoption.
Editorial analysis
A structured set of objections, weighed in public.
Referee Report
Summary. The paper proposes a neural-network (MLP) correction to the classical Projected Mass Estimator (PME) for galaxy-group and cluster masses. Separate residual networks are trained for each tracer multiplicity N on IllustrisTNG300 simulated halos, predicting Δ = log10(M_true/M_PME) from four features (PME mass, turnaround radius, line-of-sight velocity dispersion, mean line-of-sight velocity). On TNG test halos, the classical PME is found to overestimate masses by ~30–46% with RMSE ~0.29–0.32 dex, while the MLP-corrected estimates are consistent with the 1:1 relation with RMSE ~0.13 dex. A simple Bayesian rescaling of the PME coefficient gives s=0.78, C_new≈3.97. The authors report cross-validation on the EAGLE simulation and apply the method to the Milky Way, M81, and NGC 5128, quoting masses of 1.144, 2.42, and 3.91 × 10^12 M_sun respectively, with tighter error bars than previous work.
Significance. The TNG-only results (Figs. 1, 4, 5) are internally consistent and provide a credible demonstration that a residual MLP trained on a large cosmological simulation can remove the systematic bias of the PME and reduce scatter for simulated satellite systems. The N-segmented training strategy is a sensible way to handle the strong N-dependence of the estimator's noise properties, and the independent test-set evaluation is appropriate. If the cross-simulation validation is made reliable and the application-domain caveats are properly handled, the method could be a practically useful recalibration of a widely used estimator. The paper is honest in several places about the training/application mismatch, but the abstract and conclusion do not fully carry those caveats through to the headline numbers.
major comments (4)
- [§III 'EAGLE Cross Validation'; §V; Fig. 8] The EAGLE validation metrics are reported inconsistently. §III states the MLP reduces the mean bias from 0.141 dex to 0.133 dex and the RMSE from 0.164 dex to 0.145 dex. §V states the reduction is from 0.194 dex to 0.087 dex in bias and from 0.415 dex to 0.340 dex in RMSE. Fig. 8's caption implies log10(1.23)=0.090 and log10(0.89)=−0.051 for the raw and corrected bias. These are not round-off differences. Since the EAGLE cross-check is the main evidence that the correction is not a TNG artifact, the manuscript must provide one consistent set of validation metrics and explain the discrepancies.
- [§IV.A; Appendix Table III; Abstract] The abstract's headline Milky Way mass, M_MW = 1.144^{+0.399}_{-0.296} × 10^12 M_sun, is the N=20 entry in Table III (faintest satellite m_V=14.8). But §IV.A explicitly states that once ultra-faint satellites such as Hydrus I enter at N=11, the MLP correction is 'increasingly forced into an extrapolative regime' and that the model is most informative for the brightest subset. The N=5 and N=10 estimates, which lie closer to the training domain, are 0.944 and 0.818 × 10^12 M_sun. The headline value is therefore taken from the regime the authors themselves identify as unreliable. The abstract and conclusion should report the N=5–10 range or give a quantitative argument for trusting N=20 despite the stated domain mismatch.
- [§III, selection of tracers; §IV applications] The training set uses, for each halo, the N most massive bound subhalos, while the observational applications use the N brightest satellites. The paper justifies this by abundance-matching monotonicity, but no scatter or completeness modeling is presented. At the satellite masses relevant here, the luminosity–subhalo-mass relation has significant scatter, and a magnitude-limited sample can be systematically different from a mass-selected sample. The real-data inference is therefore conditional on an unquantified mapping. A validation experiment on TNG300 with luminosity- or stellar-mass-selected tracers and a realistic apparent-magnitude cut would directly test this assumption and should be added or explicitly argued to be unnecessary.
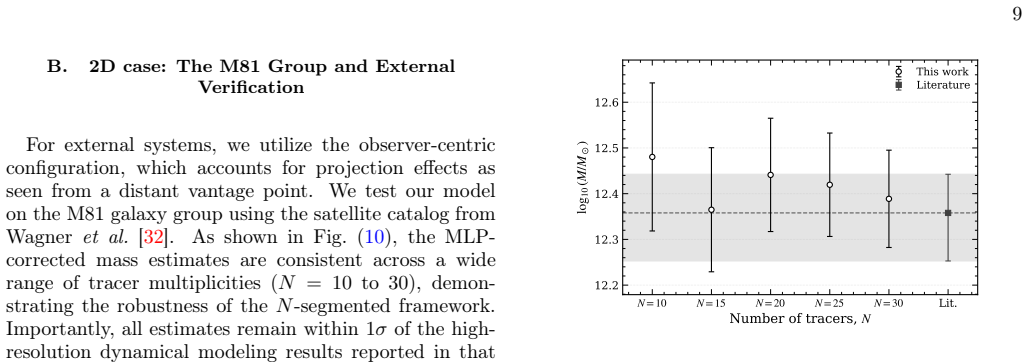
- [Fig. 9; Abstract] The quoted 1σ uncertainties on the real-system masses are the calibration scatter from the TNG300 test set, as indicated by the 'ML-corrected calibration scatter' label in Fig. 9. The outer band in Fig. 9 is a ±10% input-perturbation test. Neither term accounts for the selection mapping systematics discussed in the previous comment or for the choice of N. The abstract's statement that the method gives 'a tighter constraint' is therefore not fully supported for real data as it stands; the error bars should either include a systematic component from the simulation–observation domain shift or be explicitly labeled as conditional.
minor comments (5)
- [Fig. 6] The axis label reads 'log10 (MTME)' — a typo for 'MPME'.
- [§I, Eq. (9)] The derivation of the isotropic coefficient C=16/π is abbreviated: starting from a delta-function DF on a single orbit, one must average over orbital eccentricity to recover the isotropic result, but that average is not shown. Please clarify the missing step or state the assumed eccentricity distribution.
- [Abstract] The phrase 'dark matter rate prediction' is unclear; presumably the authors mean mass-to-light ratios or dark matter content. Please rephrase.
- [References [10] and [11]] References [10] and [11] appear to be the same paper (Di Cintio et al. 2012) with slightly different spelling of an author name. One duplicate should be removed or the intended distinct references listed.
- [Fig. 5 and Appendix Table III] Fig. 5 shows N from 10 to 50 on the x-axis, while the abstract and Table III include N=5. Please indicate whether N=5 models were trained and evaluated, and show that point in Fig. 5 or explain its omission.
Circularity Check
No significant circularity: supervised calibration with held-out TNG test and external EAGLE validation; MW faint-satellite extrapolation is a flagged limitation, not a circular step.
full rationale
The claimed improvement over the classical PME is a supervised calibration, not a first-principles derivation. The MLP is trained on TNG300 to minimize MSE on Δ = log10(M_true/M_PME), and all reported test metrics are computed on an independent 20% holdout ('All reported performance metrics are computed on an independent test set that is not used during training'), so the reduction from M_proj/M_true ≈ 1.30 to 1.02 is a genuine out-of-sample evaluation rather than a fit recycled as a prediction. The EAGLE cross-simulation validation provides an external benchmark with no retuning, further breaking any self-referential loop. The applied Local-Universe masses are forward predictions of the trained model; the quoted error bars are the calibration scatter of the test set and are explicitly labeled as such ('should therefore be interpreted as a calibration uncertainty'), so they are not presented as independent measurements. The paper itself flags the main weakness: once faint satellites such as Hydrus I enter the Milky Way sample at N = 11, 'the MLP correction is increasingly forced into an extrapolative regime' — this is a domain-mismatch limitation affecting the headline Milky Way mass, but it is not circularity because the model output is not defined in terms of the target mass or fitted to the Milky Way. There is a minor self-citation (Wagner et al. [32], co-authored by Benisty) for the M81 catalog and comparison value, but the method's validity does not reduce to that citation; it rests on the TNG test-set and EAGLE results. The internal inconsistency between the EAGLE numbers in §III and §V is a reproducibility concern, not an instance of a result being equivalent to its input by construction. No quoted step meets the bar of exhibiting a specific reduction of a claim to its own inputs.
Axiom & Free-Parameter Ledger
free parameters (4)
- s — global PME rescaling factor =
0.780 ± 0.001 (C_new = 3.974 ± 0.006)
- MLP weights (N-segmented models) =
not released
- ⟨e²⟩ — mean squared orbital eccentricity of satellites =
0.57 ± 0.02 (stacked), 0.58 ± 0.02 (largest halo)
- Network hyperparameters =
3 residual blocks × 2 FC layers; widths and learning rate not stated
axioms (4)
- standard math Jeans' theorem and steady-state spherical symmetry justify the phase-space average used to derive the PME coefficient (§I, Eq. 6).
- domain assumption Bound subhalos (ϵ<0) within the turnaround radius R0 of isolated TNG300 halos trace M200c in the same way real satellites trace group masses.
- domain assumption The N most massive subhalos in simulation correspond to the N brightest satellites in observations (abundance-matching monotonicity).
- domain assumption TNG300's radially biased satellite orbits (⟨e²⟩ ≈ 0.57) are representative of the real Local Volume.
read the original abstract
Measuring the total mass of the Milky Way and nearby galaxy groups is difficult because classical dynamical estimators rely on assumptions about satellite orbital geometry that are rarely satisfied in practice, and because only a handful of satellite galaxies are typically available as kinematic tracers. We present a new framework that corrects the well-known Projected Mass Estimator (PME) using a residual neural network trained on thousands of simulated galaxy groups from the IllustrisTNG cosmological simulation. Separate networks are trained for each satellite sample size, from as few as 5 satellites up to 50, so that the correction automatically accounts for the statistical noise that dominates when only a small number of tracers is available. In tests on simulated halos, the classical PME systematically overestimates halo masses by factors of $M_{\rm proj}/M_{\rm true} = 1.30^{+0.72}_{-0.62}$ (using the 2D distance) and $1.46^{+0.97}_{-0.72}$ (using the 3D distance), with RMSE of 0.29 and 0.32 dex respectively. The neural-network correction reduces this to $M_{\rm proj}/M_{\rm true} = 1.02^{+0.30}_{-0.26}$ with an RMSE of 0.13 dex. Applied to the Milky Way, the method yields a total mass of $M_{\rm MW} = 1.144^{+0.399}_{-0.296}\times10^{12}\,M_\odot$, with estimates based on the brightest 5-10 satellites favoring a somewhat lower range of $(0.8$-$0.95)\times10^{12}\,M_\odot$. The modified PME gives a tighter constraint on the virial masses and the dark matter rate prediction in galaxy groups and clusters.
Figures





Reference graph
Works this paper leans on
-
[1]
J. F. Navarro, C. S. Frenk, and S. D. M. White, Astro- phys. J.462, 563 (1996), arXiv:astro-ph/9508025
Pith/arXiv arXiv 1996
-
[2]
J. F. Navarro, C. S. Frenk, and S. D. M. White, Astro- phys. J.490, 493 (1997), arXiv:astro-ph/9611107
Pith/arXiv arXiv 1997
-
[3]
P. Salucci, Astron. Astrophys. Rev.27, 2 (2019), arXiv:1811.08843 [astro-ph.GA]
Pith/arXiv arXiv 2019
-
[4]
R. B. Tully, Astron. J.149, 54 (2015), arXiv:1411.1511 [astro-ph.GA]
Pith/arXiv arXiv 2015
-
[5]
E. F. Bell and R. S. de Jong, Astrophys. J.550, 212 (2001), arXiv:astro-ph/0011493
Pith/arXiv arXiv 2001
-
[6]
J. N. Bahcall and S. Tremaine, Astrophys. J.244, 805 (1981)
1981
-
[7]
Heisler, S
J. Heisler, S. Tremaine, and J. N. Bahcall, Astrophys. J. 298, 8 (1985)
1985
-
[8]
L. L. Watkins, N. W. Evans, and J. H. An, Mon. Not. R. Astron. Soc.406, 264 (2010), arXiv:1002.4565 [astro- 11 ph.GA]
Pith/arXiv arXiv 2010
-
[9]
D. Makarov, D. Makarov, L. Makarova, and N. Libeskind, Astron. Astrophys.698, A178 (2025), arXiv:2505.06642 [astro-ph.GA]
Pith/arXiv arXiv 2025
-
[11]
A. Di Cintio, A. Knebe, N. I. Libeskind, Y. Hoffman, G. Yepes, and S. Gottlöber, Mon. Not. R. Astron. Soc. 423, 1883 (2012), arXiv:1204.0005 [astro-ph.CO]
Pith/arXiv arXiv 2012
-
[12]
A. Pillepichet al., Mon. Not. Roy. Astron. Soc.490, 3196 (2019), arXiv:1902.05553 [astro-ph.GA]
Pith/arXiv arXiv 2019
-
[13]
V. F. Calderon and A. A. Berlind, Mon. Not. Roy. As- tron. Soc.490, 2367 (2019), arXiv:1902.02680 [astro- ph.GA]
Pith/arXiv arXiv 2019
-
[14]
T. M. Callingham, M. Cautun, A. J. Deason, C. S. Frenk, W. Wang,et al., Mon. Not. R. Astron. Soc.484, 5453 (2019), arXiv:1808.10456
Pith/arXiv arXiv 2019
-
[15]
D. Makarov, D. Makarov, K. Kozyrev, and N. Libe- skind, Universe11, 144 (2025), arXiv:2503.12612 [astro- ph.GA]
Pith/arXiv arXiv 2025
-
[16]
M. Vogelsberger, S. Genel, V. Springel, P. Torrey, D. Si- jacki, D. Xu, G. Snyder, S. Bird, D. Nelson, and L. Hern- quist, Nature (London)509, 177 (2014), arXiv:1405.1418 [astro-ph.CO]
Pith/arXiv arXiv 2014
-
[17]
D. Nelson, A. Pillepich, S. Genel, M. Vogelsberger, V. Springel, P. Torrey, V. Rodriguez-Gomez, D. Si- jacki, G. F. Snyder, B. Griffen, F. Marinacci, L. Blecha, L. Sales, D. Xu, and L. Hernquist, Astronomy and Com- puting13, 12 (2015), arXiv:1504.00362 [astro-ph.CO]
Pith/arXiv arXiv 2015
-
[18]
D.Nelson, A.Pillepich, V.Springel, R.Pakmor, R.Wein- berger, S. Genel, P. Torrey, M. Vogelsberger, F. Mari- nacci, and L. Hernquist, Mon. Not. Roy. Astron. Soc. 490, 3234 (2019), arXiv:1902.05554 [astro-ph.GA]
Pith/arXiv arXiv 2019
-
[19]
V. Springel, S. D. M. White, G. Tormen, and G. Kauff- mann, Mon. Not. R. Astron. Soc.328, 726 (2001), arXiv:astro-ph/0012055 [astro-ph]
Pith/arXiv arXiv 2001
-
[20]
Sandage, Astrophys
A. Sandage, Astrophys. J.307, 1 (1986)
1986
-
[21]
C. Barber, E. Starkenburg, J. Navarro, A. McConnachie, and A. Fattahi, Mon. Not. Roy. Astron. Soc.437, 959 (2014), arXiv:1310.0466 [astro-ph.GA]
Pith/arXiv arXiv 2014
-
[22]
K. L. Lange, R. J. A. Little, and J. M. G. Taylor, Journal of the American Statistical Association84, 881 (1989)
1989
-
[23]
Goodfellow, Y
I. Goodfellow, Y. Bengio, and A. Courville,Deep Learn- ing("", 2016)
2016
-
[24]
S. B. Green, M. Ntampaka, D. Nagai, L. Lovisari, K. Dolag, D. Eckert, and J. A. ZuHone, Astrophys. J. 884, 33 (2019), arXiv:1908.02765 [astro-ph.CO]
Pith/arXiv arXiv 2019
-
[25]
K. He, X. Zhang, S. Ren, and J. Sun, inProceedings of the IEEE Conference on Computer Vision and Pattern Recognition (CVPR)(2016) pp. 770–778
2016
-
[26]
D. P. Kingma and J. Ba, arXiv preprint arXiv:1412.6980 (2014)
Pith/arXiv arXiv 2014
-
[27]
P. S. Behroozi, C. Conroy, and R. H. Wechsler, Astro- phys. J.717, 379 (2010), arXiv:1001.0015 [astro-ph.CO]
Pith/arXiv arXiv 2010
-
[28]
J. Schaye, R. A. Crain, R. G. Bower, M. Furlong, et al., Mon. Not. R. Astron. Soc.446, 521 (2015), arXiv:1407.7040
Pith/arXiv arXiv 2015
-
[29]
A. Pillepich, V. Springel, D. Nelson, S. Genel, J. Naiman, R. Pakmor, L. Hernquist, P. Torrey, M. Vogelsberger, R. Weinberger, and F. Marinacci, Mon. Not. R. Astron. Soc.473, 4077 (2018), arXiv:1703.02970 [astro-ph.GA]
Pith/arXiv arXiv 2018
-
[30]
R. A. Crain, J. Schaye, R. G. Bower,et al., Mon. Not. R. Astron. Soc.450, 1937 (2015), arXiv:1501.01963
Pith/arXiv arXiv 1937
-
[31]
S. E. Koposov, M. G. Walker, V. Belokurov, A. R. Casey, A. Geringer-Sameth, D. Mackey, G. Da Costa, D. Erkal, P. Jethwa, M. Mateo, E. W. Olszewski, and J. I. Bailey, Mon. Not. R. Astron. Soc.479, 5343 (2018), arXiv:1804.06430 [astro-ph.GA]
Pith/arXiv arXiv 2018
- [32]
-
[33]
Antoine, A
D. Antoine, A. C. Seth, J. Strader, D. J. Sand, K. Voggel, A. K. Hughes, D. A. Forbes, N. Caldwell, and D. Crno- jević, Astronomy & Astrophysics685, A132 (2024)
2024
-
[34]
I. D. Karachentsev and K. N. Telikova, Astron. Nachr. 339, 615 (2018), arXiv:1810.06326 [astro-ph.GA]
Pith/arXiv arXiv 2018
-
[35]
I. D. Karachentsev and O. G. Kashibadze, Astron. Nachr. 342, 999 (2021), arXiv:2109.00336 [astro-ph.GA]
Pith/arXiv arXiv 2021
-
[36]
Z. Li, Q. D. Wang, and S. Hameed, Mon. Not. R. Astron. Soc.376, 960 (2007), arXiv:astro-ph/0701487 [astro-ph]
Pith/arXiv arXiv 2007
-
[37]
G. L. H. Harris, Publ. Astron. Soc. Aust.27, 475 (2010), arXiv:1004.4907 [astro-ph.GA]
Pith/arXiv arXiv 2010
-
[38]
L. Posti and A. Helmi, Astron. Astrophys.621, A56 (2019), arXiv:1805.01408
Pith/arXiv arXiv 2019
-
[39]
Z.-Z. Li, Y.-Z. Qian, J. Han, T. S. Li, W. Wang, and Y. P. Jing, Astrophys. J.894, 10 (2020), arXiv:2001.09136
Pith/arXiv arXiv 2020
-
[40]
S. Birdet al., Mon. Not. R. Astron. Soc.516, 731 (2022), arXiv:2205.02860
Pith/arXiv arXiv 2022
-
[41]
D. Benisty, E. Vasiliev, N. W. Evans, A.-C. Davis, O. V. Hartl, and L. E. Strigari, Astrophys. J. Lett.928, L5 (2022), arXiv:2202.00033 [astro-ph.GA]. Appendix A: Source Data for Local-Universe Mass Estimates For clarity and reproducibility, this appendix lists the numerical source data underlying the Local-Universe ap- plications discussed in Chapter IV....
Pith/arXiv arXiv 2022
discussion (0)
Sign in with ORCID, Apple, or X to comment. Anyone can read and Pith papers without signing in.