REVIEW 3 major objections 6 minor 70 references
Lattice initialisation and finite-size effects of non-equilibrium molecular dynamics simulations for heat transfer across graphene-copper interfaces
T0 review · 3 major / 6 minor · reviewed 2026-08-01 · deepseek-v4-flash
Pith's one-line read Two lattice initialization choices produce a factor-of-two change in simulated graphene–copper Kapitza resistance.
desk verdict Useful warning that NEMD Kapitza resistance is very sensitive to lattice initialisation, but the factor-two claim is confounded by lateral cell size and relaxation path differences between the two cases. read the letter →
The pith
A machine-rendered reading of the paper's core claim, the machinery that carries it, and where it could break.
The reading
What carries the argument
The key machinery is the direct NEMD setup: a Cu–graphene–Cu sandwich periodic in the transverse directions, with fixed atoms at the z-boundaries and Langevin thermostats enforcing hot and cold temperatures; from the resulting steady-state temperature profile, the Kapitza resistance is defined as the temperature jump δT at the graphene plane, obtained by extrapolating linear fits of the copper temperature, divided by the heat flux. The comparison hinges on two lattice initialization protocols: Case I sets lattice constants from experimental values (a_Cu = 3.6 Å, a_G = 2.46 Å) with no relaxation, while Case II relaxes each lattice separately at 0 K and 300 K, then combines them with minimal m
What would settle it
A concrete test is to take the relaxed (Case II) equilibrated structure, artificially flatten the graphene layer while keeping all lattice constants and densities fixed, and re-run the NEMD simulation: if the interfacial conductance jumps back to roughly 550 MW/m²K, the wrinkling/damping-layer mechanism is confirmed; if it stays near 290 MW/m²K, the cause of the factor-two difference lies elsewhere, such as in the density or the copper boundary layer alone. An independent check would be to replace the equipartition temperature estimator with a spectral or velocity-distribution-based local temp
Extended reading notes
Core claim
The central discovery is that the Kapitza resistance of a Cu–graphene–Cu interface extracted from NEMD simulations is not a robust physical quantity under conventional domain construction: two initialization protocols, differing by only about 1–3% in lattice parameters, produce interfacial thermal conductances of 557.3 ± 3 MW/m²K (Case I, experimental lattice constants) versus 297.8 ± 1 MW/m²K (Case II, relaxed, minimal-strain lattices). The authors attribute this factor-of-two difference to residual strain and the resulting atomic density: higher strain in Case I keeps the graphene layer flat and the adjacent copper more crystalline, while the lower-strain Case II develops a wrinkled graphe
Load-bearing premise
The central claim rests on the assumption that the local temperature extracted from kinetic energy via equipartition, together with the linear Fourier extrapolation near the interface, remains valid in the thin, strongly driven region next to graphene; if the velocity distribution near the interface is not quasi-equilibrium, the inferred temperature jump and hence the factor-of-two difference in Kapitza resistance would be artifacts of the post-processing.
Editorial extensions
If this is right
- Simulated Kapitza resistance for graphene–copper is not converged by enlarging the simulation domain alone: once strain-related density effects are controlled, no residual length dependence appears up to ~500 Å, implying that reported length trends in earlier studies may be confounded by initialization artifacts.
- The two initialization strategies imply that absolute interfacial conductance values for this interface carry an inherent configuration uncertainty of roughly a factor of two (about 290–560 MW/m²K), which should be quantified when comparing NEMD results to experiments or across different simulation studies.
- Because bulk phonon spectral overlap increases while conductance decreases, predictions based on acoustic or diffusive mismatch models using bulk vibrational densities of states are insufficient; interfacial structure and local disorder must be included.
- The copper lattice thermal conductivity in the same simulations shows clear domain-length and temperature dependence consistent with phonon mean-free-path limitation, meaning the interface resistance and the adjacent bulk conductivity have different sensitivities to simulation setup.
- NEMD results can carry small statistical error bars yet be systematically controlled by domain configuration choices, so error propagation should include setup uncertainties rather than only sampling noise.
Reading between the lines
- If this factor-two sensitivity generalizes, comparisons between published NEMD values for metal–graphene interfacial conductance should be treated with caution unless the initialization and equilibration protocol is reported in detail; even the same force field may yield answers that differ by up to a factor of two.
- The damping-layer interpretation suggests a testable extension: computing the local thermal conductivity profile or mode-resolved transmission across the interface as a function of graphene corrugation amplitude would directly link wrinkling to the added resistance, and could be probed by intentionally introducing controlled ripples in an otherwise flat sheet.
- The result implies that strain engineering of graphene–metal interfaces has an additional channel: residual strain affects not only phonon frequency shifts but also the structural order of the adjacent metal, which may dominate the interface conductance; this could guide experiments that anneal composites to modify interfacial thermal transport.
- Since Case I and Case II differ in average copper–copper separation by only about 0.1 Å, the mechanism is subtle; a sensitivity study varying the copper–carbon Lennard-Jones parameters could test whether the disordered boundary layer is force-field specific or robust across potentials.
Editorial analysis
A structured set of objections, weighed in public.
Referee Report
Summary. This paper uses direct non-equilibrium molecular dynamics (NEMD) to study thermal transport across Cu–graphene–Cu interfaces. It compares two lattice-initialisation strategies: Case I uses experimental lattice constants (a_Cu = 3.60 Å, a_G = 2.46 Å) in a fixed 50×50 Ų lateral cell, while Case II uses separately relaxed and NPT-equilibrated lattices (a_Cu ≈ 3.632 Å, a_G ≈ 2.422 Å) with a larger, equilibrated lateral cell. The authors also vary domain length L_z and use two boundary-temperature protocols (ΔT = const. and δT = const.). The implementation is validated against Zhu et al. (2022), reproducing ITC = 630 ± 7 MW/m²K versus 640.2 MW/m²K. The central finding is that ITC is almost a factor of two larger in Case I (≈ 552 MW/m²K for L_z > 250 Å) than in Case II (≈ 289 MW/m²K), despite modest differences in lattice parameters. The paper argues that this difference is controlled by initialisation-induced strain and density, not by domain length or boundary enforcement, and interprets the lower ITC of Case II via a 'damping boundary layer' associated with graphene wrinkling and broadened interfacial phonon spectra. The copper lattice conductivity is found to increase with domain length, consistent with phonon mean-free-path effects.
Significance. If the factor-of-two initialisation sensitivity is confirmed, this is an important methodological result for the NEMD community: it would show that conventional lattice-construction choices can dominate over domain length and thermostat effects in interfacial thermal conductance prediction, and that bulk spectral overlap alone is insufficient. The paper has clear strengths: a successful literature validation, transparent error propagation, detailed supplementary descriptions of the relaxation protocol, and a data-availability statement. No target quantity is fitted, so circularity is not a concern. However, the central Case I versus Case II comparison is not a controlled lattice-parameter sweep: it simultaneously changes lateral periodic-cell dimensions, the number of unit cells, and the relaxation history. The explanatory 'damping boundary layer' mechanism is inferred from diagnostics on the same simulations and is entangled with this confound. The result is significant and worth pursuing, but the causal attribution to initialisation-induced strain/density is not yet established.
major comments (3)
- [III C, Figs. 3 and 10; Table S1; Sec. IV] The two 'comparable' systems differ in more than lattice parameters: Case I uses (Lx,Ly)=(50.0,50.0) Å, while Case II uses (54.3,57.3) Å, i.e. an area increase of ~25%, plus a longer Lz and a completely different relaxation history (NVT fixed-cell vs NPT anisotropic relaxation). The concluding remark that 'the interface area was kept constant' (Sec. IV) is contradicted by these reported dimensions. Since lateral cell size directly sets the graphene flexural-mode cutoff and wrinkling propensity—the very mechanism invoked for Case II—the factor-of-two difference cannot be unambiguously attributed to initialisation-induced strain and density. A controlled test with identical Lx,Ly for both initialisations, or a lateral-size sweep within each case, is required to support the title claim.
- [III C, Figs. 7, 8, 11] The 'damping boundary layer' interpretation is built from post-hoc diagnostics of the same simulations: broadened regional VDOS, broader Cu–Cu nearest-neighbour distributions, and a nonlinear temperature profile in Case II. These diagnostics are consistent with the lateral-size/relaxation confound identified above and do not by themselves establish a causal mechanism. Moreover, the bulk spectral-overlap values (0.23 vs 0.25 in z) are presented without any uncertainty; a 0.02 difference is small relative to the factor-of-two ITC change, so the claim that 'spectral overlap alone cannot predict ITC' is not yet quantitatively supported. The paper should either provide an independent test (e.g., fixed lateral area, or artificially suppressing wrinkling) or explicitly present the damping layer as a hypothesis requiring further validation.
- [III B, Fig. 6] The central attribution of ITC variations to atomic density/strain is supported only by visual alignment of the ITC and density curves. No quantitative correlation, regression, or uncertainty interval is given. The density changes are a few per cent, and the ITC scatter is large for Lz < 100 Å (Case I) and throughout Case II. A simple Pearson/Spearman correlation with confidence intervals would substantially strengthen the claim that density is the primary controlling parameter. This point is secondary to the lateral-size confound but bears on the paper's mechanistic conclusion.
minor comments (6)
- [General typesetting] The manuscript text as received contains many garbled symbols (e.g., Å rendered as '8A', missing overlines and subscripts in several equations). Please correct these throughout, as they significantly impede readability.
- [II B, Eq. (6)] The text states that σ_Tbar_k is the standard error of the time-averaged temperature, but the least-squares formula does not show a weight 1/σ². Clarify whether the fit is weighted or unweighted.
- [II C and Table S1] The values a_G = 2.46 Å (Case I) and a_G = 2.422 Å (Case II) are from different thermodynamic states (unrelaxed experimental vs 300 K relaxed). Please state this explicitly and consider a main-text table comparing the two initialisations: lattice parameters, cell dimensions, number of atoms, and residual strain.
- [Fig. 6] The legend uses 'Atom/Volume' and the axis label 'N=LxLyLz' is unclear. Use 'number density (Å^{-3})' and define it explicitly in the caption.
- [Data availability] The data-availability statement says the data are in 4TU.ResearchData but gives no persistent identifier or link. Please provide a DOI or URL.
- [III C, local equilibrium] The velocity-distribution check in SI SIII is performed for 'arbitrary slabs' in the copper domains. It does not directly address the interfacial regions I–V used for the VDOS analysis. A statement noting that equipartition is assumed rather than verified in the interfacial regions would be appropriate.
Circularity Check
No circularity: ITC is computed from measured heat flux and temperature jump, lattice parameters are independent inputs or NPT relaxation outputs, and the spectroscopic diagnostics are explanatory rather than definitional.
full rationale
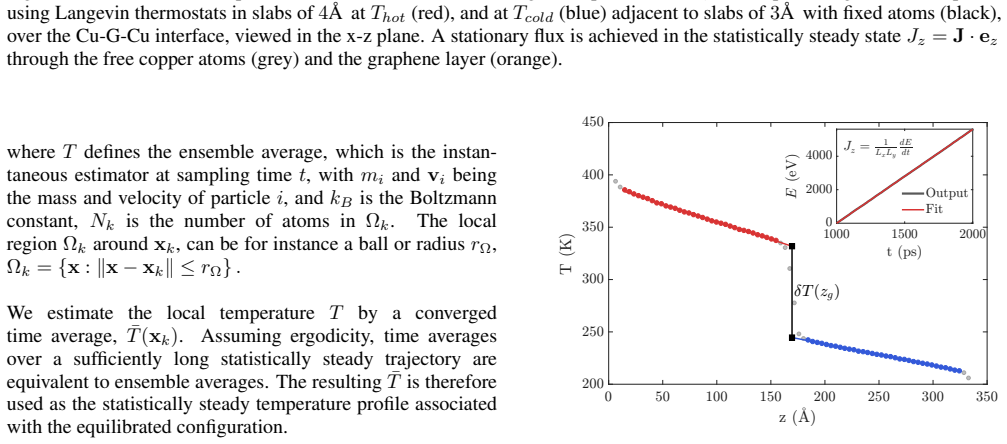
The derivation chain is self-contained. The Kapitza resistance is defined in Eq. 3 from the heat flux J_n and the interfacial temperature jump δT, where δT comes from linear fits to the simulated temperature profile (Eqs. 6–7). Neither J_n nor δT is constructed from lattice constants, density, or phonon overlap, so no target quantity is fitted or defined in terms of the explanatory variables. Case I lattice parameters are prescribed experimental inputs (a_Cu = 3.6 Å, a_G = 2.46 Å); Case II parameters are outputs of independent NPT relaxation runs (a_Cu = 3.632 Å, a_G = 2.422 Å). The factor-of-two ITC difference is an observed simulation outcome, not a parameter fitted to reproduce that difference. The VDOS, nearest-neighbour distributions, and local spectral broadening are diagnostics computed from the same trajectories but are not used in the definition of ITC, so the damping-layer interpretation is a post-hoc explanation, not an equation-level identification. Validation against Zhu et al. (2022) provides an external benchmark. The only self-citations (refs. [3] and [7]) support background statements about manufacturing and experimental composite conductivity ranges; they are not load-bearing for the ITC derivation. The concluding remark that 'the interface area was kept constant' is not strictly accurate across Case I and Case II (50×50 Ų vs 54.3×57.3 Ų), which is a potential confound for the strain attribution, but this is a correctness/design concern rather than circularity.
Assumptions & free parameters
free parameters (4)
- Langevin thermostat damping time t_damp =
0.1 ps
- Cu–C Lennard-Jones parameters ε, σ, r_c =
ε = 0.02578 eV, σ = 3.0825 Å, r_c = 10.0 Å
- Case I lattice constants a_Cu, a_G =
a_Cu = 3.6 Å, a_G = 2.46 Å
- Initial Cu–graphene separation d =
3 Å
assumptions (4)
- domain assumption Local temperature defined by equipartition (Eq. 4) is a valid equivalent-equilibrium temperature in thin slabs under NEMD.
- domain assumption Fourier's law and linear-response transport apply to the copper domains (Eqs. 1–3, 6–7).
- domain assumption The EAM + AIREBO + LJ combination of force fields adequately represents the Cu–graphene interface.
- domain assumption Classical MD with equipartition adequately resolves the phonon populations relevant to the extracted thermal conductivities.
invented entities (1)
-
Damping interfacial boundary layer
Cite this review
Pith. "Pith review of Lattice initialisation and finite-size effects of non-equilibrium molecular dynamics simulations for heat transfer across graphene-copper interfaces." pith.science (2026). https://pith.science/paper/O4DVIFLK
@misc{pith2026260716783,
  author       = {Pith},
  title        = {Pith review of: Lattice initialisation and finite-size effects of non-equilibrium molecular dynamics simulations for heat transfer across graphene-copper interfaces},
  year         = {2026},
  howpublished = {\url{https://pith.science/paper/O4DVIFLK}},
  note         = {Machine review of arXiv:2607.16783}
}
read the original abstract
We study thermal transport across copper-graphene-copper interfaces using Non-Equilibrium Molecular Dynamics (NEMD), focusing on the influence of finite domain length and domain configuration, including lattice initialisation and associated graphene wrinkling, on the predicted thermal conductivity and Kapitza resistance. In the literature, NEMD simulations identified trends in the Kapitza resistance of graphene-copper interfaces. However, the simulation outcomes and reliability may depend heavily on configuration choices that are underexplored in the literature. We identify a strong sensitivity of the Kapitza resistance to domain configuration choices that affect the lattice constants and atomic density. We show that two conventional lattice initialisation strategies yield a factor of two difference in the Kapitza resistance, despite differences of only a few per cent in the lattice parameters. This behaviour is accompanied by strain-dependent shifts in the graphene and copper phonon spectra, and by increased phonon overlap at lower strain. Counter to conventional expectations, greater phonon-mode overlap coincides with higher Kapitza resistance, showing that spectral overlap alone cannot capture the interfacial heat-transfer dynamics. We suggest that in lattices initialised with lower residual strain, a damping boundary layer develops near the interface, and increases thermal resistance, as indicated by increased local structural disorder and local spectral broadening over a wider interfacial region. Beyond strain- and density-related effects associated with the lattice constants, Kapitza resistance shows no significant dependence on domain length or boundary temperature enforcement in this study. By contrast, the copper lattice conductivity exhibits clear domain-size and temperature dependence, consistent with phonon mean-free-path limitations and supported by phonon spectral analysis.
Figures


Figures from the paper (11 more)


Reference graph
Works this paper leans on
-
[1]
Denoting the direction of the temperature gradient by unit vector e, the corresponding conductivityκ e is given by: κe =e·Ke=− J·e a , T(x) =a(x·e) +b(2)
The thermal conductivity tensorKis defined through Fourier’s constitutive relation between the gradient of the temperatureTand the heat fluxJ: J=−K∇T(1) For a material region that is homogeneous along the temperature-gradient direction and remains within the linear-response regime, a one-dimensional linear tem- perature profile is expected to emerge in th...
-
[2]
The equilibrium densi- ties and lattice constants required for lattice initialisa- tion are not always known for the specific composite system
A second source of uncertainty arises from the initial- isation of the atomic lattices. The equilibrium densi- ties and lattice constants required for lattice initialisa- tion are not always known for the specific composite system. Residual strain introduced during the initialisa- tion can affect thermal properties, including the thermal interface resista...
-
[3]
The interfacial thermal resistance is defined in terms of an effective discontinuity in the linear temperature pro- file at the location of the interface. From the normal heat flux and this discontinuity in the temperature pro- file, we define the interfacial thermal resistance, known as the Kapitza resistance, as [44]: RK = 1 ITC = δT Jn , δT=|T + −T −|(...
2001
-
[4]
This behaviour is consistent with effec- tive lattice constants obtained from Case I initialisation
In Case I, we observe large fluctuations in the ITC for domain lengths below100 ˚A , which decrease in size as the domain length increases, and become negligible above250 ˚A. This behaviour is consistent with effec- tive lattice constants obtained from Case I initialisation. Since Case I initialises the lattice with a constant param- eter, variations in d...
-
[5]
T=const. CaseI /T=const. CaseII
Case II demonstrates a different fluctuation pattern. The largest deviations of the ITC occur at domain lengths below70 ˚A , whereas the remaining domain lengths ex- hibit much smaller ITC fluctuations than in Case I, de- spite density fluctuations of similar magnitude. This may indicate a superlinear relation between density and ITC. Unlike in Case I, th...
2000
-
[6]
Corona, M
D. Corona, M. Beatrici, E. Sbardella, G. Di Domenico, F. Lu- cibello, M. Zarcone, and C. D. Gaudio, AIP Conf. Proc.2416, 020007 (2021)
2021
-
[7]
A. L. Moore and L. Shi, Mater. Today17, 163 (2014)
2014
-
[8]
Khosravi, O
A. Khosravi, O. R. Sandoval, M. S. Taslimi, T. Sahrakorpi, G. Amorim, and J. J. Garcia Pabon, Energy Build.323, 114834 (2024)
2024
Show all 70 references
-
[9]
H. Lee, A. Ardeshiri Lordejani, L. van Goor, A. Jurov, A. Kout- sioukis, S. Ruan, N. M. Santhosh, F. Zarei, C. Barreneche, U. Cvelbar, S. Dosta, B. J. Geurts, M. Guagliano, D. Jafari, V . Nicolosi, S. Yin, J. Zavaˇsnik, S. Bagherifard, R. Lupoi, and W. W. Wits, Renew. Sustain....
2025
-
[10]
A. A. Balandin, S. Ghosh, W. Bao, I. Calizo, D. Tewelde- brhan, F. Miao, and C. N. Lau, Nano Lett.8, 902 (2008), pMID: 18284217
2008
-
[11]
Qadir, T
A. Qadir, T. K. Le, M. Malik, K. A. Amedome Min-Dianey, I. Saeed, Y . Yu, J. R. Choi, and P. V . Pham, RSC Adv.11, 23860 (2021)
2021
-
[12]
P. A. Khomyakov, G. Giovannetti, P. C. Rusu, G. Brocks, J. van den Brink, and P. J. Kelly, Phys. Rev. B79, 195425 (2009)
2009
-
[13]
At the cold side, the temperature decreases from226 to66K, well below the Debye temperature. Within this low-temperature regime, Umklapp scattering is increasingly suppressed by frozen states until scattering is governed by constant temperature-independent defect and boundary ...
2024
-
[14]
H. Lee, S. Ruan, D. Jafari, A. Koutsioukis, R. Lupoi, S. Yin, L. van Goor, V . Nicolosi, B. Geurts, and W. Wits, (Under review at) Mater. Des. (2026)
2026
-
[15]
F. Wang, C. Ye, H. Yin, S. Pan, K. Liu, and Y . Zhu, Carbon244, 120695 (2025)
2025
-
[16]
C. Y . Ho, R. W. Powell, and P. E. Liley, J. Phys. Chem. Ref. Data1, 279 (1972)
1972
-
[17]
Boden, B
A. Boden, B. Boerner, P. Kusch, I. Firkowska, and S. Reich, Nano Lett.14, 3640 (2014)
2014
-
[18]
E. Pop, V . Varshney, and A. K. Roy, MRS Bulletin37, 1273 (2012)
2012
-
[19]
J. Zhu, S. Huang, Z. Xie, H. Guo, and H. Yang, Materials15, 7588 (2022), pMID: 36363179; PMCID: PMC9654340
2022
-
[20]
C. Li, J. Wang, Y . Sheng, L. Yang, and Y . Su, Int. J. Heat Mass Transf.198, 123383 (2022)
2022
-
[21]
J. Fang, Y . Zhang, and P. Zhao, Cell. Rep. Phys. Sci.6, 10.1016/j.xcrp.2025.102917 (2025)
2025
-
[22]
Casimir, Physica5, 495 (1938)
H. Casimir, Physica5, 495 (1938)
1938
-
[24]
X. Xu, L. F. C. Pereira, Y . Wang, J. Wu, K. Zhang, X. Zhao, S. Bae, C. T. Bui, R. Xie, J. T. L. Thong, B. H. Hong, K. P. Loh, D. Donadio, B. Li, and B. ¨Ozyilmaz, Nature Comm.5, 3689 (2014)
2014
-
[25]
S. Mei, L. N. Maurer, Z. Aksamija, and I. Knezevic, J. Appl. Phys.116, 164307 (2014)
2014
-
[26]
Fugallo, A
G. Fugallo, A. Cepellotti, L. Paulatto, M. Lazzeri, N. Marzari, and F. Mauri, Nano Lett.14, 6109 (2014)
2014
-
[27]
Z. Tong, S. Li, X. Ruan, and H. Bao, Phys. Rev. B100, 144306 (2019)
2019
-
[28]
Sæther, M
S. Sæther, M. F. Erichsen, S. Xiao, Z. Zhang, A. Lervik, and J. He, AIP Adv.12, 065301 (2022)
2022
-
[29]
M. E. Pumarol, M. C. Rosamond, P. Tovee, M. C. Petty, D. A. Zeze, V . Falko, and O. V . Kolosov, Nano Lett.12, 2906 (2012), pMID: 22524441
2012
-
[30]
W. Cai, A. L. Moore, Y . Zhu, X. Li, S. Chen, L. Shi, and R. S. Ruoff, Nano Lett.10, 1645 (2010), pMID: 20405895
2010
-
[31]
Park, S.-C
M. Park, S.-C. Lee, and Y .-S. Kim, J. Appl. Phys.114, 053506 (2013)
2013
-
[32]
T. Zhan, S. Minamoto, Y . Xu, Y . Tanaka, and Y . Kagawa, AIP Adv.5, 047102 (2015)
2015
-
[33]
Gordiz and A
K. Gordiz and A. Henry, J. Appl. Phys.121, 025102 (2017)
2017
-
[34]
Chalopin, K
Y . Chalopin, K. Esfarjani, A. Henry, S. V olz, and G. Chen, Phys. Rev. B85, 195302 (2012)
2012
-
[35]
E. S. Landry and A. J. H. McGaughey, Phys. Rev. B80, 165304 (2009)
2009
-
[36]
C. M. Stanley, Phys. Status Solidi B260, 2300095 (2023)
2023
-
[37]
Braun, J
E. Braun, J. Gilmer, H. B. Mayes, D. L. Mobley, J. I. Monroe, S. Prasad, and D. M. Zuckerman, Living J. Comput. Mol. Sci. 1, 5957 (2019), epub 2018-11-29
2019
-
[38]
M ¨uller-Plathe, J
F. M ¨uller-Plathe, J. Chem. Phys.106, 6082 (1997). 15
1997
-
[39]
R. Kubo, J. Phys. Soc. Jpn.12, 570 (1957)
1957
-
[40]
M. S. Green, J. Chem. Phys.22, 398 (1954)
1954
-
[41]
Onsager, Phys
L. Onsager, Phys. Rev.37, 405 (1931)
1931
-
[42]
S. R. de Groot and P. Mazur,Non-Equilibrium Thermodynamics (Courier Corporation, 1984)
1984
-
[43]
H. Dong, Z. Fan, L. Shi, A. Harju, and T. Ala-Nissila, Phys. Rev. B97, 094305 (2018)
2018
-
[44]
Nejatolahi, A
M. Nejatolahi, A. A. Golneshan, R. Kamali,et al., J. Therm. Anal. Calorim.144, 1467 (2021)
2021
-
[45]
M. H. Khadem and A. P. Wemhoff, Comp. Mat. Sci.69, 428 (2013)
2013
-
[46]
Matsubara, G
H. Matsubara, G. Kikugawa, M. Ishikiriyama, S. Yamashita, and T. Ohara, J. Chem. Phys.147, 114104 (2017)
2017
-
[47]
J. Chen, X. Xu, J. Zhou, and B. Li, Rev. Mod. Phys.94, 025002 (2022)
2022
-
[48]
Ghatage, G
D. Ghatage, G. Tomar, and R. K. Shukla, J. Chem. Phys.153, 164110 (2020)
2020
-
[49]
R. Kubo, M. Toda, and N. Hashitsume,Statistical Physics II (Springer, Berlin, Heidelberg, 1991)
1991
-
[50]
P. L. Kapitza, Zh. Eksp. Teor. Fiz.11, 1 (1941), english transl.: J. Phys. U.S.S.R. 4, 181 (1941)
1941
-
[51]
G. Chen,Nanoscale Energy Transport and Conversion: A Par- allel Treatment of Electrons, Molecules, Phonons, and Pho- tons, MIT-Pappalardo Series in Mechanical Engineering (Ox- ford University Press, 2005)
2005
-
[52]
A. P. Thompson, H. M. Aktulga, R. Berger, D. S. Bolintineanu, W. M. Brown, P. S. Crozier, P. J. in ’t Veld, A. Kohlmeyer, S. G. Moore, T. D. Nguyen, R. Shan, M. J. Stevens, J. Tranchida, C. Trott, and S. J. Plimpton, Comp. Phys. Comm.271, 10817 (2022)
2022
-
[53]
Verlet, Phys
L. Verlet, Phys. Rev.159, 98 (1967)
1967
-
[54]
S. P. N. Ernst Hairer, Gerhard Wanner,Solving Ordinary Dif- ferential Equations I(Springer Berlin, Heidelberg, 1993)
1993
-
[55]
Prohaska, J
T. Prohaska, J. Irrgeher, J. Benefield, J. K. B ¨ohlke, L. A. Ches- son, T. B. Coplen, T. Ding, P. J. H. Dunn, M. Gr ¨oning, N. E. Holden, H. A. J. Meijer, H. Moossen, A. Possolo, Y . Takahashi, J. V ogl, T. Walczyk, J. Wang, M. E. Wieser, S. Yoneda, X.-K. Zhu, and J. Meija, P...
2022
-
[56]
Mishin, M
Y . Mishin, M. J. Mehl, D. A. Papaconstantopoulos, A. F. V oter, and J. D. Kress, Phys. Rev. B63, 224106 (2001)
2001
-
[57]
M. S. Daw and M. I. Baskes, Phys. Rev. B29, 6443 (1984)
1984
-
[58]
S. J. Stuart, A. B. Tutein, and J. A. Harrison, J. Chem. Phys. 112, 6472 (2000)
2000
-
[59]
Guo and W
Y . Guo and W. Guo, Nanotechnology17, 4726 (2006)
2006
-
[60]
Schneider and E
T. Schneider and E. Stoll, Phys. Rev. B17, 1302 (1978)
1978
-
[61]
Bokdam, G
M. Bokdam, G. Brocks, and P. J. Kelly, Phys. Rev. B90, 201411 (2014)
2014
-
[62]
Cheng, R
Z. Cheng, R. Li, X. Yan, G. Jernigan, J. Shi, M. E. Liao, N. J. Hines, C. A. Gadre, J. C. Idrobo, E. Lee, K. D. Hobart, M. S. Goorsky, X. Pan, T. Luo, and S. Graham, Nature Comm.12, 6901 (2021)
2021
-
[63]
K. W. B¨oer and U. W. Pohl, Phonon-induced thermal properties, inSemiconductor Physics(Springer International Publishing, Cham, 2023) pp. 157–190
2023
-
[64]
X.-P. Wei, X. Li, and Y .-L. Zhang, AIP Adv.15, 065021 (2025)
2025
-
[65]
N. W. Ashcroft and N. D. Mermin,Solid State Physics(Cen- gage Learning, Inc., 1976)
1976
-
[66]
J. K. Viljas and T. T. Heikkil¨a, Phys. Rev. B81, 245404 (2010)
2010
-
[67]
Dunweg and W
B. Dunweg and W. Paul, Int. J. Mod. Phys. C02, 817 (1991)
1991
-
[68]
Parrinello and A
M. Parrinello and A. Rahman, J. Appl. Phys.52, 7182 (1981)
1981
-
[69]
S. Mun, A. L. Bowman, S. Nouranian, S. R. Gwaltney, M. I. Baskes, and M. F. Horstemeyer, J. Phys. Chem. A121, 1502 (2017)
2017
-
[70]
T. P. C. Klaver, S.-E. Zhu, M. H. F. Sluiter, and G. C. A. M. Janssen, Carbon82, 538 (2015). 16 SUPPLEMENTARY INFORMATION SI. THEORY AND FORCE FIELDS Molecular Dynamics (MD) simulations provide a method for investigating phonon dynamics and their contributions to thermal trans...
2015
-
[71]
The interactions between Cu atoms are calcu- lated following the Embedded Atom Method (EAM) poten- tial for copper atom interactions as developed by Mishin et al
[14][15]. The interactions between Cu atoms are calcu- lated following the Embedded Atom Method (EAM) poten- tial for copper atom interactions as developed by Mishin et al. (2001) using ab initio calculations [50]. The EAM potential considers both a pairwise potential function...
2001
Reviewed August 1, 2026 · model on record in the stance chip above.
Discussion (0). Continue with ORCID to comment.