REVIEW 3 major objections 5 minor 41 references
Harnessing X-ray Absorption Spectroscopy Data through Multimodal Mining of Battery Literature
T0 review · 3 major / 5 minor · reviewed 2026-08-03 · deepseek-v4-flash
Pith's one-line read A fully automated pipeline can extract X-ray absorption spectra from battery papers at scale, producing an open dataset of 13,740 spectra.
desk verdict A solid data-descriptor paper whose real contribution is the 13,740-spectrum XAS dataset, but the missing recall estimate for figure selection and the unreleased artifacts temper the coverage claims. read the letter →
The pith
A machine-rendered reading of the paper's core claim, the machinery that carries it, and where it could break.
The reading
What carries the argument
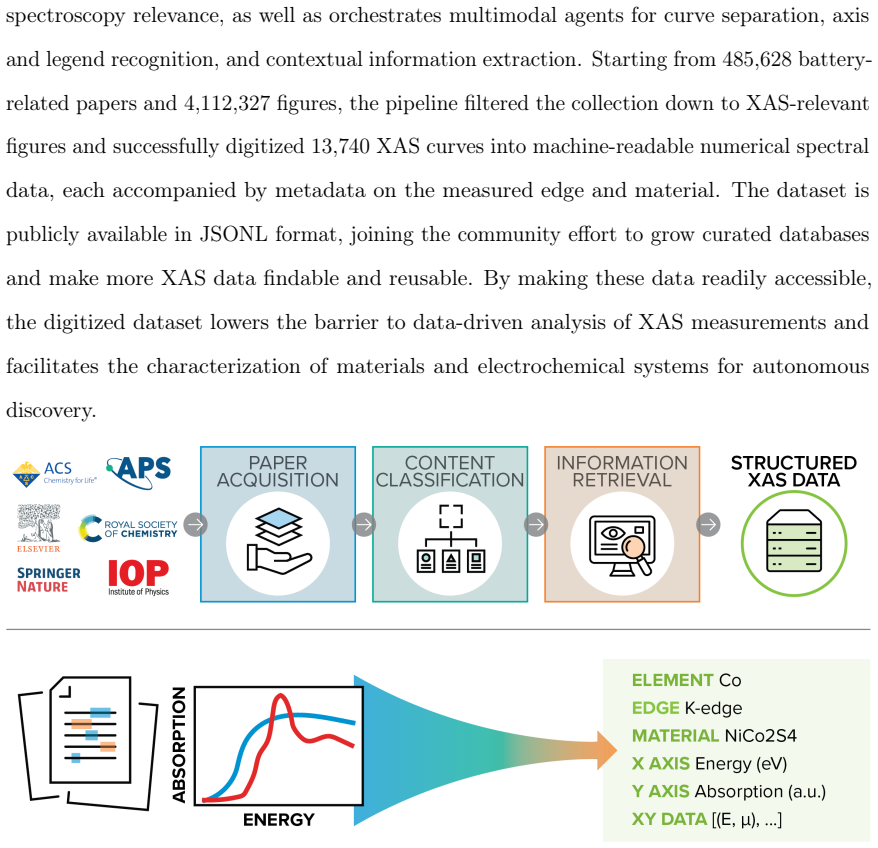
The pipeline's backbone is a multi-stage filter-and-retrieve architecture. A self-hosted language model reads captions to flag likely XAS figures; a vision-language model classifies each subfigure as a XANES line plot versus EXAFS, FT-EXAFS, or in-situ visualizations. Curve extraction uses a reward function that combines color-cluster consistency with a roughness penalty to stitch together segments of a single curve through overlaps and intersections. Axis ticks are read by OCR and cross-checked by a vision-language model to build a linear pixel-to-energy transformation. Legends are assigned by an ensemble of two vision-language model queries on inpainted highlighting visualizations, and acc
What would settle it
Select a random set of, say, 200 battery papers that a domain expert confirms contain at least one XAS line plot, run the full pipeline on exactly those papers, and count how many of the identified figures end up in the output. A recall below roughly 90% would invalidate coverage claims and require a redesign of the filtering stages.
Extended reading notes
Core claim
The central discovery is that a combination of inexpensive caption filtering, vision-language subfigure classification, connectivity/color-based curve segmentation, OCR-plus-VLM axis reading, and VLM-driven contextual extraction can convert figures in full-text articles into structured spectral records with high fidelity. On a random sample of 100 records, expert validation found axis labels and ticks 100% correct, legend attribution 97% correct, curve separation 91% correct, and material and element metadata 97–98% correct, with 89% of records entirely correct. The released dataset contains 13,740 spectra from 3,510 papers, each record including xy coordinates, axis labels, legend text, abs
Load-bearing premise
The caption and subfigure filters are assumed to catch essentially all XAS figures in the downloaded papers, but their recall is never measured; if they miss a substantial fraction, the 13,740 spectra are not a representative harvest of the battery XAS literature.
Editorial extensions
If this is right
- The 13,740 spectra give machine-learning models a large, source-traceable training set for predicting oxidation states, local coordination, and absorption edges from XANES.
- Aggregated same-material spectra enable quantitative cross-laboratory comparisons; the CoO example shows how outliers and plotting errors can be flagged automatically.
- The pipeline can be rerun on more papers or longer time windows to grow the dataset further, since it is automated and the pool of battery papers is still expanding.
- Because each record preserves axis units, legend text, and a DOI, the dataset complements curated XAS databases and connects spectra to their original experimental context.
Reading between the lines
- The paper leaves recall unmeasured, so a natural next test is to run the pipeline against a manually identified sample of XAS-containing papers and compute the fraction of figures recovered; until then, coverage claims should be treated as lower-bound estimates.
- The same architecture could be retargeted to other line-plot spectroscopies (XRD, Raman, NMR) or to energy-dispersive imaging data, since only the caption classifier and subfigure taxonomy need to change.
- The narrow interquartile range of post-edge peak spacings across laboratories suggests that internal energy differences, rather than absolute edge energies, are a promising robust target for cross-lab calibration and for training energy-registration models.
- Because the y-axis for many records is in raw image coordinates, users should either normalize intensities themselves or use the dataset for shape-based analyses rather than absolute intensity comparisons.
Signed reviews
Editorial analysis
A structured set of objections, weighed in public.
Referee Report
Summary. The paper reports a fully automatic pipeline that combines publisher-specific full-text acquisition, LLM/VLM-based figure filtering, OCR and VLM axis reading, connectivity/color-based curve segmentation, VLM legend attribution, and contextual metadata extraction to convert XAS figures from battery papers into machine-readable spectra. Applying the pipeline to 485,628 battery papers and 4,112,327 figures yields a claimed 13,740 XAS spectra from 3,510 papers, with metadata on absorbing element, edge, material, and constituent elements. Validation on 100 randomly sampled records reports 100% accuracy for axis labels/ticks, 97% for legends, 91% for curve separation, and 97–100% for metadata, with 89% of records fully correct. The dataset is offered as an open JSONL resource for XAS analysis, cross-laboratory comparison, and machine learning.
Significance. If the dataset is as clean and complete as claimed, it would be a valuable community resource: it is larger than prior manually curated XAS collections, spans many elements and chemistries, provides source traceability through DOI and figure labels, and could support machine-learning models for XAS interpretation and cross-laboratory standardization. The pipeline itself is also of interest, and the paper honestly reports per-component precision on a small expert-annotated sample. The main weakness is that the figure-selection cascade is never evaluated for recall, so the coverage and representativeness claims that motivate the dataset are not yet established. The abstract's claim of 'expert validation confirming accurate extraction' also overstates the 89% fully-correct rate.
major comments (3)
- [Technical Validation; Content classification] No recall estimate is reported for the figure-selection cascade (Mixtral caption filter, FigureSeparator, GPT-5.2 subfigure classification). The validation in Table 2 samples 100 records from the final 13,740-curve output and measures precision-style accuracy only. Missing recall matters directly for the paper's coverage claims: the 13,740 spectra are asserted to 'span 66 absorbing elements and diverse battery chemistries,' but if the selection stages systematically miss certain figure types, publishers, or caption phrasings, the retrieved set is a biased subset of the battery XAS literature. The Methods already acknowledge exclusions (dashed/dotted lines, FT-EXAFS, EXAFS oscillations, in-situ visualizations), which narrows the scope. A stratified recall check against a random sample of the original 4,112,327-figure pool—or at least per-publisher/per-year recall for the caption filter—is
- [Abstract; Technical Validation, Table 2] The abstract states that 'expert validation confirming accurate extraction of spectral and metadata information' was obtained, but Table 2 shows that only 89% of the 100 sampled records had all figure components and metadata correct; 11% had at least one error, with curve separation at 91% and legend recognition at 97%. This is good precision, but not 'confirming accurate extraction' without qualification. The abstract and the summary in 'Overall' should be revised to report the per-component rates and the 89% fully-correct rate, and to avoid implying that every extracted record is expert-confirmed accurate.
- [Dataset mining; Fig. 5(a)] The cross-laboratory demonstration in Fig. 5(a) rescales each spectrum to a 'common reference intensity, defined as the median peak intensity of comparable, consistently normalized literature spectra.' The criteria for 'comparable, consistently normalized' are not specified, and the exclusion of 'clearly identifiable errors' is described after the fact. If the reference set and the outlier exclusion are chosen using the same spectra that are then analyzed, the reported edge-energy and post-edge-peak distributions (Fig. 5(b,c)) may partially reflect the selection procedure. Specify the selection rules or perform a sensitivity analysis using alternative reference choices. This is not central to the dataset claim, but it affects one of the paper's illustrative uses.
minor comments (5)
- [Content classification] The phrase 'signal versus wavevector ink-space' appears to be a typo for 'k-space' or 'inverse space.' Also, the classifier is described as identifying 'typical XANES spectra,' while the abstract and dataset title refer to XAS. Since EXAFS oscillations and FT-EXAFS are explicitly excluded, the paper should clarify that the dataset contains XANES-type line spectra, not full EXAFS/XAS data, to avoid overstating the scope.
- [Curve segmentation, Eq. (1)] The roughness penalty weight λ is stated to be chosen empirically as 0.01, but no sensitivity analysis is provided. Given that curve separation is the least accurate component (91%), a brief test of λ values (e.g., 0.001–0.1) on a small validation set would strengthen confidence that the choice is not driving the error rate.
- [Technical Validation] The validation sample size is 100 records, which is reasonable for a first pass, but the reported percentages have wide confidence intervals (e.g., 91% corresponds to roughly 83–96% at 95% confidence). Reporting confidence intervals or increasing the sample size for the curve-separation and legend metrics would make the accuracy claims more robust.
- [Legend recognition] The ensemble strategy accepts a legend assignment only when two inpainting-based VLM inferences agree, explicitly 'trading recall for precision.' Since recall is not measured anywhere, the effect of this decision on the number of usable curves is unknown. A sentence quantifying how many curves were rejected by this agreement step would help readers gauge the pipeline's yield.
- [Data Availability / Code Availability] The manuscript states that the dataset and code 'will be available' upon publication. For a data-descriptor paper, providing a working repository or DOI at review time would allow referees and readers to verify the JSONL schema and reproduce the statistics in Figs. 2–5. At minimum, the final version should include the persistent identifiers.
Circularity Check
No circular derivation; dataset evaluation is externally anchored; recall gap is a coverage limitation, not circularity.
full rationale
The paper's central claim is the production of a 13,740-spectrum XAS dataset from the battery literature, not a derived law or prediction that reduces to its inputs. The curve-segmentation reward in Eq. 1 contains an empirically chosen regularization weight (λ=0.01), but this is a hyperparameter selected to balance color consistency against smoothness; it is not fitted to the validation labels or to the claimed spectral values, and the extraction quality is checked by independent expert annotation on 100 randomly sampled records (Table 2). The metadata extraction pipeline uses GPT-5.2 and OCR, and its outputs are likewise judged against expert reading of the original figures and text; this is an external benchmark, not a self-confirming loop. The paper does cite its own prior tools (EXSCLAIM, Plot2Spectra, optical-emissivity figure extraction), and it reuses them as components, but it does not invoke those citations to define the dataset's contents or to forbid alternative approaches; the load-bearing validation is external. The main weakness identified in the manuscript is that figure-selection recall is not measured—the 100-record validation is precision-oriented, and the pipeline explicitly excludes dashed/dotted lines, FT-EXAFS, EXAFS oscillations, and in-situ visualizations. That is a coverage/statistical limitation that affects representativeness claims, but it is not circularity: the extracted records themselves are not defined by the pipeline's own outputs, and no prediction is forced by construction. Therefore no significant circularity is present.
Assumptions & free parameters
free parameters (2)
- λ roughness penalty weight =
0.01
- Reference intensity for vertical rescaling =
median peak intensity of comparable CoO spectra
assumptions (4)
- domain assumption XAS spectra in battery papers are predominantly line plots of intensity vs. photon energy with linear axes.
- domain assumption Figure captions and paper text contain enough context to resolve legends to materials and edges.
- domain assumption At least two axis tick labels with correct values and positions are extractable for every included curve.
- standard math Standard tooling (BIRCH clustering, linear algebra) is correct.
Cite this review
Pith. "Pith review of Harnessing X-ray Absorption Spectroscopy Data through Multimodal Mining of Battery Literature." pith.science (2026). https://pith.science/paper/XPTHLDAO
@misc{pith2026260723886,
  author       = {Pith},
  title        = {Pith review of: Harnessing X-ray Absorption Spectroscopy Data through Multimodal Mining of Battery Literature},
  year         = {2026},
  howpublished = {\url{https://pith.science/paper/XPTHLDAO}},
  note         = {Machine review of arXiv:2607.23886}
}
read the original abstract
X-ray absorption spectroscopy (XAS) is central to understanding the local electronic and atomic structure of materials, yet most published spectra remain inaccessible to data-driven analysis because they are embedded in figures and described through fragmented textual context in the literature. Here, we use multimodal (image and text) literature mining to transform this dispersed knowledge into an AI-ready experimental data resource. We developed a scalable spectroscopy data digitization pipeline that identifies XAS figures in full-text articles, digitizes spectral curves, and links each spectrum to accompanying metadata on the measured edge and material. Applying this pipeline to the battery literature produced an open dataset of 13,740 XAS spectra, spanning 66 absorbing elements and diverse battery chemistries, with expert validation confirming accurate extraction of spectral and metadata information. By converting literature-embedded spectra into structured numerical data, this dataset provides a foundation for large-scale XAS analysis, cross-laboratory comparison, high-throughput characterization, and autonomous discovery of advanced materials.
Figures


Figures from the paper (2 more)


Reference graph
Works this paper leans on
-
[1]
XASLIB: X-ray absorption data library.https: //xaslib.xrayabsorption.org(2026)
International X-ray Absorption Society. XASLIB: X-ray absorption data library.https: //xaslib.xrayabsorption.org(2026). Accessed: 2026-06-28
2026
-
[2]
URLhttps://journals.iucr.org/s/issues/2025/03/00/ing5006/
Ishii, M.et al.Global cross-database search system for X-ray absorption spectra32, 661–668. URLhttps://journals.iucr.org/s/issues/2025/03/00/ing5006/
2025
-
[3]
XASDB – Design and Implementation of an Open-Access Spectral Database
Spasyuk, D. XASDB – Design and Implementation of an Open-Access Spectral Database. URLhttp://arxiv.org/abs/2509.13566.2509.13566
-
[4]
URLhttps://journals.iucr.org/s/issues/2024/05/00/up5002/
Paripsa, S.et al.RefXAS: An open access database of X-ray absorption spectra31, 1105–1117. URLhttps://journals.iucr.org/s/issues/2024/05/00/up5002/
2024
-
[5]
French absorption spectroscopy beamline in material and environmental science
Kieffer, I. & Testemale, D. SSHADE/FAME: “French absorption spectroscopy beamline in material and environmental science” database service. SSHADE (OSUG Data Center). Service/Database.https://doi.org/10.26302/SSHADE/FAME(2016). 20
-
[6]
URL https://doi.org/10.1021/acs.chemmater.3c02584
Chen, Y.et al.Robust machine learning inference from X-ray absorption near edge spectra through featurization.Chemistry of Materials36, 2304–2313 (2024). URL https://doi.org/10.1021/acs.chemmater.3c02584
-
[7]
URL https://doi.org/10.1021/acsn ano.5c16942
Jia, H.et al.Revealing local structures through machine-learning-fused multimodal spectroscopy.ACS Nano20, 4228–4240 (2026). URL https://doi.org/10.1021/acsn ano.5c16942
-
[8]
& Cole, J
Liu, S. & Cole, J. M. Automated determination of the molecular substructure from nuclear magnetic resonance spectra using neural networks.Journal of Chemical Information and Modeling65, 8435–8447 (2025). URL https://doi.org/10.102 1/acs.jcim.5c00499
2025
Show all 41 references
-
[9]
Fei, Y.et al.Agentic llm reasoning in a self-driving laboratory for air-sensitive lithium halide spinel conductors.arXiv preprint arXiv:2604.11957(2026)
2026 arXiv
-
[10]
Huang, X.et al.Cascade: Cumulative agentic skill creation through autonomous development and evolution.arXiv preprint arXiv:2512.23880(2025)
2025
-
[11]
& Ceder, G
Huang, X., Chen, J., Schwaller, P. & Ceder, G. Skillpuzzler: A self-evolving agentic framework for materials and chemistry research with minimal reliance on predefined tools. InNeurIPS 2025 AI for Science Workshop
2025
-
[12]
Penfold, T.et al.Machine-learning strategies for the accurate and efficient analysis of x-ray spectroscopy.Machine Learning: Science and Technology5, 021001 (2024)
2024
-
[13]
arXiv:2504.18554v1(2025)
Wang, Y.et al.An x-ray absorption spectrum database for iron-containing proteins. arXiv:2504.18554v1(2025)
2025
-
[14]
URLhttps://www.science.org/doi/10.1126/sciadv.adg8180
He, T.et al.Precursor recommendation for inorganic synthesis by machine learning materials similarity from scientific literature.Science Advances9, eadg8180 (2023). URLhttps://www.science.org/doi/10.1126/sciadv.adg8180
2023 doi
-
[15]
URL https://doi.org/10 .1021/acs.chemmater.2c01293
Huo, H.et al.Machine-learning rationalization and prediction of solid-state synthesis conditions.Chemistry of Materials34, 7323–7336 (2022). URL https://doi.org/10 .1021/acs.chemmater.2c01293. 21
2022
-
[16]
X., Pablo-García, S., Wong, B
Leong, S. X., Pablo-García, S., Wong, B. & Aspuru-Guzik, A. MERMaid: Universal multimodalminingofchemicalreactionsfromPDFsusingvision-languagemodels.Matter 8(2025). URLhttps://www.cell.com/matter/abstract/S2590-2385(25)00374-1
2025
-
[17]
X., Pablo-García, S., Zhang, Z
Leong, S. X., Pablo-García, S., Zhang, Z. & Aspuru-Guzik, A. Automated electrosynthesis reaction mining with multimodal large language models (MLLMs). Chemical Science15, 17881–17891 (2024). URL https://pubs.rsc.org/en/content/ articlelanding/2024/sc/d4sc04630g
2024
-
[18]
Digital Discovery3, 491–501 (2024)
Zheng, Z.et al.Image and data mining in reticular chemistry powered by GPT-4V. Digital Discovery3, 491–501 (2024). URL https://pubs.rsc.org/en/content/arti clelanding/2024/dd/d3dd00239j
2024
-
[19]
& Cole, J
Dong, Q. & Cole, J. M. Auto-generated database of semiconductor band gaps using ChemDataExtractor.Scientific Data9, 193 (2022)
2022
-
[20]
Scientific Data13, 269 (2026)
Liu, Y.et al.A multimodal dataset of causal mechanisms in materials science literature. Scientific Data13, 269 (2026). URL https://www.nature.com/articles/s41597-0 26-06598-5
2026
-
[21]
& Ammar, W
Siegel, N., Lourie, N., Power, R. & Ammar, W. Extracting scientific figures with distantly supervised neural networks. InProceedings of the 18th ACM/IEEE Joint Conference on Digital Libraries, 223–232 (2018)
2018
-
[22]
& Pouchard, L
Park, G. & Pouchard, L. Advances in scientific literature mining for interpreting materials characterization.Machine Learning: Science and Technology2, 045007 (2021)
2021
-
[23]
Chemical Science17, 3031–3042 (2026)
Zhang, D.et al.“DIVE” into hydrogen storage materials discovery with AI agents. Chemical Science17, 3031–3042 (2026). URL https://pubs.rsc.org/en/content/ar ticlelanding/2026/sc/d5sc09921h
2026
-
[24]
M., Smallwood, W., Baird, S
Sayeed, H. M., Smallwood, W., Baird, S. G. & Sparks, T. D. NLP meets materials science: Quantifying the presentation of materials data in literature.Matter7, 723–727 (2024). URLhttps://www.cell.com/matter/abstract/S2590-2385(23)00645-8. 22
2024
-
[25]
& Kim, J
Lee, J., Lee, W. & Kim, J. MatGD: Materials Graph Digitizer.ACS Applied Materials & Interfaces16, 723–730 (2024). URLhttps://doi.org/10.1021/acsami.3c14781
2024 doi
-
[26]
InLLM for Scientific Discovery: Reasoning, Assistance, and Collaboration(2025)
Circi, D.et al.Information extraction from diverse charts in materials science. InLLM for Scientific Discovery: Reasoning, Assistance, and Collaboration(2025)
2025
-
[27]
Qian, Y., Guo, J., Tu, Z., Coley, C. W. & Barzilay, R. RxnScribe: A sequence generation model for reaction diagram parsing.Journal of Chemical Information and Modeling63, 4030–4041 (2023). URLhttps://doi.org/10.1021/acs.jcim.3c00439
2023 doi
-
[28]
URL https://www.cell.com/patterns/abst ract/S2666-3899(23)00222-2
Schwenker, E.et al.EXSCLAIM!: Harnessing materials science literature for self-labeled microscopy datasets.Patterns4(2023). URL https://www.cell.com/patterns/abst ract/S2666-3899(23)00222-2
2023
-
[29]
URLhttps://pubs.rsc.org/en/content/articlelanding/2022/ dd/d1dd00036e
Jiang, W.et al.Plot2Spectra: An automatic spectra extraction tool.Digital Discovery 1, 719–731 (2022). URLhttps://pubs.rsc.org/en/content/articlelanding/2022/ dd/d1dd00036e
2022
-
[30]
& Jain, A
Baibakova, V., Elzouka, M., Lubner, S., Prasher, R. & Jain, A. Optical emissivity dataset of multi-material heterogeneous designs generated with automated figure extraction. Scientific Data9, 589 (2022). URL https://www.nature.com/articles/s41597-022 -01699-3
2022
-
[31]
Playwright: Fast and reliable end-to-end testing for modern web apps
Microsoft. Playwright: Fast and reliable end-to-end testing for modern web apps. https://playwright.dev(2026). Accessed: 2026-06-28
2026
-
[32]
URLhttps://www.nature.com/articles/s41597-019-0224-1
Kononova, O.et al.Text-mined dataset of inorganic materials synthesis recipes.Scientific Data6, 203 (2019). URLhttps://www.nature.com/articles/s41597-019-0224-1
2019
-
[33]
In2021 IEEE International Conference on Image Processing (ICIP), 1204–1208 (IEEE, 2021)
Jiang, W.et al.A two-stage framework for compound figure separation. In2021 IEEE International Conference on Image Processing (ICIP), 1204–1208 (IEEE, 2021). URL https://ieeexplore.ieee.org/document/9506171
2021
-
[34]
URL https://arxiv.org/abs/2507.05595
Cui, C.et al.PaddleOCR 3.0 Technical Report.ArXiV 2507.05595(2025). URL https://arxiv.org/abs/2507.05595. 23
2025 arXiv
-
[35]
& Livny, M
Zhang, T., Ramakrishnan, R. & Livny, M. Birch: an efficient data clustering method for very large databases.ACM SIGMOD Record25, 103–114 (1996)
1996
-
[36]
& Schwaller, P
Chen, J., Huang, X., Hua, C., He, Y. & Schwaller, P. A multi-modal transformer for predicting global minimum adsorption energy.Nature Communications16, 3232 (2025)
2025
-
[37]
& Schwaller, P
Chen, J., Huang, X., Hua, C., He, Y. & Schwaller, P. Adsgt: Graph transformer for predicting global minimum adsorption energy. InNeurIPS 2023 AI for Science Workshop (2023)
2023
-
[38]
URLhttps://www
Chen, Y.et al.Precise solid-phase synthesis of CoFe@FeOx nanoparticles for efficient polysulfide regulation in lithium/sodium-sulfur batteries14, 7487. URLhttps://www. nature.com/articles/s41467-023-42941-9
-
[39]
URL https://www.sciencedirect.com/science/article/pii/S2211285520309861
Wu, M.et al.Cobalt (II) oxide nanosheets with rich oxygen vacancies as highly efficient bifunctional catalysts for ultra-stable rechargeable Zn-air flow battery79, 105409. URL https://www.sciencedirect.com/science/article/pii/S2211285520309861
-
[40]
W.Exploratory Data Analysis(Addison-Wesley, Reading, MA, 1977)
Tukey, J. W.Exploratory Data Analysis(Addison-Wesley, Reading, MA, 1977)
1977
-
[41]
L., García-Prieto, A., Alonso, J
Fdez-Gubieda, M. L., García-Prieto, A., Alonso, J. & Meneghini, C. X-ray absorption fine structure spectroscopy in Fe oxides and oxyhydroxides. In Faivre, D. (ed.)Iron Oxides: From Nature to Applications, 397–422 (Wiley-VCH Verlag GmbH & Co. KGaA, 2016). URLhttps://doi.org/10....
2016 doi
Reviewed August 3, 2026 · model on record in the stance chip above.
Discussion (0). Continue with ORCID to comment.