REVIEW 3 major objections 7 minor 37 references
This paper proposes a fail-degraded perception system that lowers an object detector's confidence threshold when a normalizing-flow monitor judges incoming images to be of poor quality, improving recall for pedestrians in degraded images wh
Reviewed by Pith at T0; open to challenge. T0 means a machine referee read the full paper against a public rubric. the ladder, T0–T4 →
T0 review · deepseek-v4-flash
2026-08-01 01:36 UTC pith:G5XHRDO5
load-bearing objection A plausible fail-degraded perception monitor, but the paper's central benefit is not isolated from a uniform threshold reduction. the 3 major comments →
Image Quality Dependent Degradation for AI Systems
The pith
A machine-rendered reading of the paper's core claim, the machinery that carries it, and where it could break.
Core claim
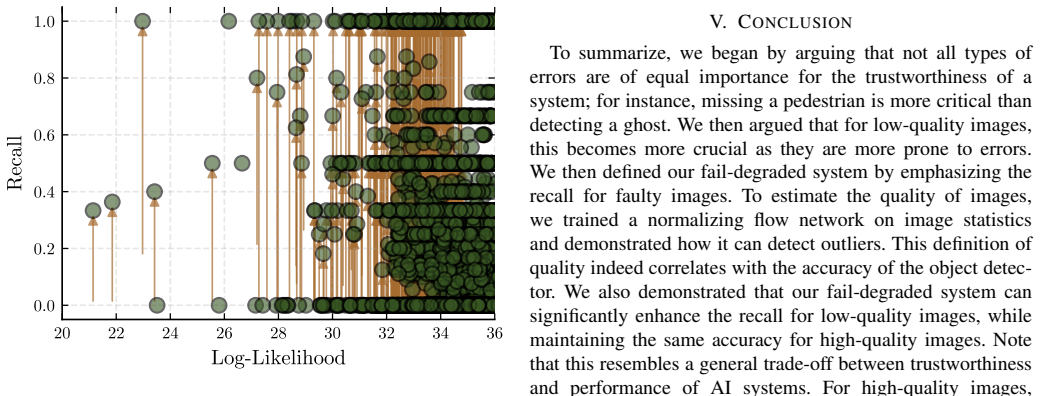
The central claim is that forcing the object detector to be more cautious exactly when the input image is unusual—quantified by a low log-likelihood under a normalizing flow trained on handcrafted quality statistics—reduces the most safety-critical error, the missed pedestrian, in low-quality images while preserving precision-oriented behavior on high-quality images. The authors report that their fail-degraded system increases average per-frame recall (YOLO: 0.428 to 0.474; DETR: 0.605 to 0.627) with only a minor precision drop (YOLO: 0.996 to 0.984; DETR: 0.366 to 0.349), and that recall improves on many low-likelihood images. They also show the same normalizing flow separates simulated CAR
What carries the argument
The central mechanism is a normalizing flow (an invertible neural network, here a real-valued volume-preserving Real-NVP) trained on twelve handcrafted no-reference image-quality statistics—brightness, colorfulness, contrast, energy, overexposure, PSNR, saturation, sharpness, SNR, skewness, spectral center, underexposure—computed from the training images. Its log-likelihood L(x) measures how well an incoming image matches the training data's quality distribution, and Eq. (5), a tanh profile motivated by phase-transition theory, converts L(x) into a detector confidence threshold; tau is set near the training median and alpha controls the transition width. Low L(x) lowers the threshold, tradin
Load-bearing premise
The load-bearing premise is that the normalizing-flow log-likelihood built from twelve handcrafted image statistics reliably tracks how likely the pedestrian detector is to miss a person; the paper shows scatter and trend plots but reports no correlation coefficient, significance test, or calibration, and the detector was trained without augmentations, which may strengthen the relationship beyond what a realistic detector would show.
What would settle it
Compare the adaptive-threshold policy against a fixed lower threshold with the same average confidence: if the fixed threshold recovers the same number of missed pedestrians, the quality signal itself adds nothing beyond a global recall-precision trade-off. A direct version is a rank correlation (e.g., Spearman) between L(x) and per-image recall on a held-out set with an augmentation-trained detector; a correlation near zero would falsify the trigger logic.
If this is right
- If the quality monitor reliably tracks detector reliability, a camera-only perception stack can keep operating safely through degradations that would otherwise require a fallback sensor, extending the AI component's functional range.
- The monitor is detector-agnostic: because it only changes the confidence threshold at inference time, it can be combined with different object detectors without retraining them.
- The normalizing-flow quality score doubles as an out-of-distribution detector, separating simulated data and common corruptions from real training data, which supports broader input monitoring.
- The tanh mapping gives a tunable operating point: alpha and tau control how aggressively the system trades precision for recall, allowing safety behavior to be set per deployment.
- In the authors' implementation, quality assessment and object detection run in parallel, so the adaptive behavior adds no sequential latency at runtime.
Where Pith is reading between the lines
- Because the detectors in the experiments were trained without image augmentations, the observed recall-versus-quality gradient may be stronger than what a deployment detector trained with augmentations would show; testing the same scheme with an augmentation-trained detector is the natural next experiment.
- The quality score could be used beyond thresholding—for example, to weight detections in sensor fusion or to trigger a controlled handover—since it provides a continuous, real-time confidence estimate of the input image itself.
- Global image quality may miss local degradations that matter for a single pedestrian; extending the flow to local image patches or bounding-box features is a direct extension the authors themselves flag as future work.
- The safety benefit is only as strong as the calibration between L(x) and miss probability; reporting rank correlations and calibration curves would turn the observed trend into a quantitative guarantee.
Editorial analysis
A structured set of objections, weighed in public.
Referee Report
Summary. The paper proposes a fail-degraded object-detection system for automated driving. A normalizing flow is trained on twelve handcrafted no-reference image-quality features extracted from the training distribution, producing a per-image log-likelihood L(x). This value is converted by Eq. (5) into a confidence threshold: images judged low-quality use a lower threshold, increasing recall, while high-quality images keep a higher, capped threshold. Experiments evaluate the normalizing flow on OOD detection (BDD100k vs. ZOD vs. CARLA), on six synthetic corruption types, and on pedestrian detection with YOLOv11 and DETR, comparing a fixed confidence threshold of 0.7 with the proposed adaptive threshold. The authors report improved recall on low-quality images at the cost of some precision, and a ROS 2 implementation for real-time use.
Significance. If the central claim is established, the work offers a practical, detector-agnostic way to shift an object-detection system toward recall when input quality is poor, potentially reducing missed pedestrians without requiring a fallback sensor. The use of handcrafted image statistics with a normalizing flow is a reasonable and explainable monitor design, and the paper includes several useful elements: a public GitHub implementation, a plug-and-play architecture that does not require detector retraining, and a demonstration that latent features from a ResNet-18 are less reliable than handcrafted features for detecting the considered corruptions. However, the main experimental evidence for the fail-degraded behavior is currently incomplete: the recall improvement is not isolated from the mechanical effect of lowering a confidence threshold, and the quality-to-recall relationship is only shown qualitatively.
major comments (3)
- [Section IV-C, Table II, Eq. (5)] The central claim that the quality-adaptive threshold is beneficial is not supported without a matched-recall uniform-threshold baseline. The comparison in Table II is between the fixed threshold 0.7 and the adaptive schedule of Eq. (5) with tau=33, alpha=0.15, clipped at 0.7. For low-likelihood images, the adaptive schedule simply lowers the confidence threshold relative to 0.7, which mechanically increases recall and decreases precision. The reported YOLO recall increase from 0.428 to 0.474 may therefore be entirely due to threshold lowering rather than to quality-dependence. The authors should compare against a constant threshold c chosen to match the same overall recall (or the same recall on the low-quality subset), and should report precision-recall operating points across a range of fixed thresholds. Without such a baseline, the contribution of the quality monitor itself is not is
- [Section III-A, Eq. (4); Section IV-C, Figs. 4-5] The premise that L(x) is a valid proxy for detector reliability is supported only by qualitative scatter plots. Figs. 4 and 5 show per-image recall and precision against log-likelihood with hand-drawn trend arrows, but the paper reports no correlation coefficient, no significance test, and no calibration analysis for Eq. (4). In addition, the detector was intentionally trained without image augmentations (Section IV-C), which likely strengthens the recall-quality relationship beyond what a realistically trained detector would exhibit. The authors should quantify the L-recall correlation (e.g., Spearman rank correlation with confidence intervals) and repeat the object-detection experiment with an augmentation-trained detector, at least as a robustness check. This point is load-bearing because Eq. (4) is the justification for the entire adaptive thresholding scheme.
- [Section IV-C, Eq. (5)] The method's parameters are hand-set and no sensitivity analysis is provided. The values alpha=0.15, tau=33, and the clipping cap of 0.7 determine the operating point, yet the paper does not show how the results vary with these choices. Since the whole approach is a design strategy for fail-degraded systems, the lack of a sensitivity study weakens the generality claim. The authors should vary alpha and tau around the chosen values, test the effect of removing the clipping cap, and report the resulting recall/precision trade-offs. Ideally, tau should be tied to a principled quantile of the training likelihood distribution rather than set to a single value.
minor comments (7)
- [Abstract and Introduction] Typographical issues: 'automatic emergency breaking' should be 'emergency braking'; 'neglecteble' should be 'negligible'; 'chasis' should be 'chassis'; 'quiet similar' should be 'quite similar'.
- [Section IV-A, Fig. 2] The OOD detection claim is based only on a violin plot of 100 images per dataset. Quantitative separation metrics, such as AUROC or the overlap between likelihood distributions, would make the claim more convincing.
- [Section IV-C, Table II] The DETR results are reported in the table but not discussed beyond 'quite similar'. Also, the DETR average precision of 0.366 is much lower than YOLO's 0.996; this discrepancy deserves at least a sentence of explanation.
- [Section IV-C] The statement 'we only focus on the YOLO results as the DETR results are quiet similar' is imprecise: Table II shows different absolute numbers for DETR. Please specify which qualitative pattern is similar.
- [Section IV-D] The real-time capability section describes the ROS 2 architecture but reports no runtime measurements. Either add latency/throughput numbers or soften the claim from 'truly real-time capable' to 'designed for real-time operation'.
- [Section III-B, Eq. (5)] The phrase 'accuracy' is used in the conclusion and elsewhere to mean different things (precision, recall, overall correctness). Please use consistent terminology.
- [References] Reference [25] contains duplicated volume/issue information; reference [35] is credited to a GitHub username and should be replaced with a proper citation if available.
Circularity Check
Reported recall gain is entailed by the threshold schedule; no matched-recall uniform-threshold baseline isolates the quality monitor.
specific steps
-
fitted input called prediction
[Section III-B (Eq. 5) and Section IV-C (Table II, Figs. 4-5)]
"for a low-quality image, we decrease the confidence threshold, emphasizing recall and avoiding the risk of missing any object... conf(x) = 1/2 tanh (α(L(x)−τ)) + 1/2 ... we set τ = 33 and α = 0.15. Additionally, we clip the confidence values above at 0.7... we observe that, as expected, our approach yields a decrease in precision and an increase in recall, as shown in table II."
Eq. (5) is a strictly increasing function of L(x); with τ=33, α=0.15 and the clip at 0.7, every low-L image receives a confidence threshold below the fixed 0.7 baseline. Lowering a confidence threshold can only add candidate detections, so recall is non-decreasing and precision non-increasing by construction. The reported recall rise (0.428 -> 0.474 in Table II) is therefore a mechanical consequence of the schedule, which the paper itself calls 'as expected.' Because no uniform-threshold baseline matched for overall recall or low-quality recall is reported, the experiment cannot show that the quality estimate L(x) contributes anything beyond a global threshold reduction; and 'maintaining the same accuracy for high-quality images' is likewise guaranteed by clipping conf at 0.7. Thus the hea
full rationale
The central object-detection claim reduces to the designed threshold schedule: the paper defines the fail-degraded system as decreasing the confidence threshold for low-quality images, and then reports, 'as expected,' that recall increases. That is a threshold-monotonicity effect, not evidence for the quality monitor. The independent content of the paper lies in the normalizing-flow monitor: the OOD separation of BDD100k vs ZOD vs CARLA (Fig. 2) and the monotone log-likelihood response to six augmentation types (Fig. 3) are parameter-free external validations that do not depend on the object detector, so the paper is not wholly circular. However, the connection between L(x) and detector recall is weakened by design choices: the detector is trained without augmentations 'to showcase the connection to the training data,' and no correlation coefficient or significance test is reported for Figs. 4-5. These are correctness risks rather than circularity, but they reinforce that the paper's headline recall benefit is not isolated from a trivial threshold reduction. No load-bearing self-citation chain is present; [32] is an external reference and only motivates the tanh profile. Score 6 reflects that one central 'prediction' reduces by construction while the monitor itself retains independent empirical support.
Axiom & Free-Parameter Ledger
free parameters (3)
- alpha (phase transition width) =
0.15
- tau (likelihood threshold) =
33
- confidence cap =
0.7
axioms (5)
- domain assumption L(x) as defined in Eqs. (3)-(4) is a valid proxy for object-detector reliability on a given image.
- domain assumption Missing a pedestrian is more critical for safety than a false positive.
- ad hoc to paper The confidence threshold should follow the specific tanh profile conf(x) = 0.5 tanh(alpha(L(x)-tau)) + 0.5.
- domain assumption Handcrafted quality features contain performance-limiting degradation information that deep latent features lack.
- domain assumption Neural networks interpolate well and extrapolate poorly, so similarity to training data defines 'good quality'.
read the original abstract
Perception is one of the primary applications where neural networks outperform conventional algorithms. One example is AI systems for automated driving, which can detect pedestrians based on image data and avoid them accordingly. A substantial challenge with these AI systems is that their output depends heavily on the quality of the input images. For example, if an image is of inferior quality due to heavy contamination, such as noise or darkness, accurate predictions are hardly feasible. Additionally, various types of errors can occur, each with varying relevance to the trustworthiness of the underlying AI system. In particular, it may be more critical not to detect an existing person than to detect a person where there is none. Therefore, we want to show that we can still avoid the most critical errors in situations of inferior image quality. To achieve this, we aim to establish a fail-degraded system by lowering the network's confidence threshold based on the estimated image quality, enabling it to detect objects more cautiously in uncertain situations. Additionally, we present a novel method for estimating the quality of incoming images by comparing them to the training data using normalizing flows. We will also conduct experiments applying our method to state-of-the-art object detection. In summary, we will present a design strategy for AI-based systems in automated driving that can deal with poor-quality input data without resorting to fallback solutions. Such measures enhance trust in AI-based systems and lead to an increased provision of the AI component.
Figures



Reference graph
Works this paper leans on
-
[1]
A survey of autonomous driving: Common practices and emerging technologies,
E. Yurtsever, J. Lambert, A. Carballo, and K. Takeda, “A survey of autonomous driving: Common practices and emerging technologies,” IEEE access, vol. 8, pp. 58 443–58 469, 2020
2020
-
[2]
Abschluss- bericht ki absicherung,
G. A. des Verbundprojektes KI Absicherung, “Abschluss- bericht ki absicherung,” VDA Leitinitiative autonomes und vernetztes Fahren, Tech. Rep., 2022. [Online]. Avail- able: https://www.ki-absicherung-projekt.de/fileadmin/KI Absicherung/ Downloads/KI-A Abschlussberich PU final.pdf
2022
-
[3]
Taxonomy to unify fault tolerance regimes for automotive systems: Defining fail-operational, fail-degraded, and fail-safe,
T. Stolte, S. Ackermann, R. Graubohm, I. Jatzkowski, B. Klamann, H. Winner, and M. Maurer, “Taxonomy to unify fault tolerance regimes for automotive systems: Defining fail-operational, fail-degraded, and fail-safe,”IEEE Transactions on Intelligent Vehicles, vol. 7, no. 2, pp. 251–262, 2022
2022
-
[4]
Formal verification of a fail-operational automotive driving system,
T. Schmid, S. Schraufstetter, J. Fritzsch, D. Hellhake, G. Koelln, and S. Wagner, “Formal verification of a fail-operational automotive driving system,”arXiv preprint arXiv:2101.07307, 2021
Pith/arXiv arXiv 2021
-
[5]
Reliability analysis of gracefully degrading automotive systems,
P. Weiss, A. Younessi, and S. Steinhorst, “Reliability analysis of gracefully degrading automotive systems,” 2023. [Online]. Available: https://arxiv.org/abs/2305.07401
Pith/arXiv arXiv 2023
-
[6]
Revisiting the evaluation of deep neural networks for pedestrian detection,
P. Feifel, F. Bonarens, B. Franke, A. P. Raulf, F. K ¨oster, and F. Schwenker, “Revisiting the evaluation of deep neural networks for pedestrian detection,” in2022 Workshop on Artificial Intelligence Safety, AISafety 2022, Juli 2022. [Online]. Available: https://elib.dlr.de/195574/
2022
-
[7]
Toward robust lidar based 3d ob- ject detection via density-aware adaptive thresholding,
E. Lee, M. Jung, and A. Kim, “Toward robust lidar based 3d ob- ject detection via density-aware adaptive thresholding,”arXiv preprint arXiv:2404.13852, 2024
Pith/arXiv arXiv 2024
-
[8]
Towards safety-aware pedestrian detection in autonomous systems,
M. Lyssenko, C. Gladisch, C. Heinzemann, M. Woehrle, and R. Triebel, “Towards safety-aware pedestrian detection in autonomous systems,” in2022 IEEE/RSJ International Conference on Intelligent Robots and Systems (IROS). IEEE, Oct. 2022, pp. 293–300
2022
-
[9]
Safety in adas/ad –sotif, a risk-based approach,
K. Z. Benjamin Koller, Fabian Frey, “Safety in adas/ad –sotif, a risk-based approach,” T ¨UV S ¨UD AG, Qual- comm Technologies, Inc., Whitepaper TR-2023-04, 2023. [Online]. Available: https://www.tuvsud.com/-/jssmedia/global/pdf-files/ whitepaper-report-e-books/tuvsud-sotif.pdf
2023
-
[10]
I. Fursa, E. Fandi, V . Musat, J. Culley, E. Gil, I. Teeti, L. Bilous, I. V . Sluis, A. Rast, and A. Bradley, “Worsening perception: Real-time degra- dation of autonomous vehicle perception performance for simulation of adverse weather conditions,”arXiv preprint arXiv:2103.02760, 2021
Pith/arXiv arXiv 2021
-
[11]
Perception and sensing for autonomous vehicles under adverse weather conditions: A survey,
Y . Zhang, A. Carballo, H. Yang, and K. Takeda, “Perception and sensing for autonomous vehicles under adverse weather conditions: A survey,” ISPRS Journal of Photogrammetry and Remote Sensing, vol. 196, pp. 146–177, Feb. 2023
2023
-
[12]
Emergent visual sensors for autonomous vehicles,
Y . Li, J. Moreau, and J. Ibanez-Guzman, “Emergent visual sensors for autonomous vehicles,”IEEE Transactions on Intelligent Transportation Systems, vol. 24, no. 5, pp. 4716–4737, 2023
2023
-
[13]
Im- age data augmentation for deep learning: A survey,
S. Yang, W. Xiao, M. Zhang, S. Guo, J. Zhao, and F. Shen, “Im- age data augmentation for deep learning: A survey,”arXiv preprint arXiv:2204.08610, 2022
Pith/arXiv arXiv 2022
-
[14]
The role of noisy data in improving cnn robustness for image clas- sification,
O. H. Ram ´ırez-Agudelo, N. Gorea, A. Reif, L. Bonasera, and M. Karl, “The role of noisy data in improving cnn robustness for image clas- sification,” inApplications of Machine Learning 2025, B. Narayanan, M. E. Zelinski, T. M. Taha, A. A. Awwal, and K. M. Iftekharuddin, Eds. SPIE, Sep. 2025, p. 27
2025
-
[15]
Scalable fail-degraded systems for autonomous vehicles: A survey,
A. Hossam, J. Villagra, F. Navas, and V . Milan´es, “Scalable fail-degraded systems for autonomous vehicles: A survey,”IEEE Transactions on Intelligent Transportation Systems, pp. 1–19, 2025
2025
-
[16]
A deeper look into aleatoric and epistemic uncertainty disentanglement,
M. Valdenegro-Toro and D. Saromo, “A deeper look into aleatoric and epistemic uncertainty disentanglement,” 2022. [Online]. Available: https://arxiv.org/abs/2204.09308
Pith/arXiv arXiv 2022
-
[17]
No-reference image quality assessment in the spatial domain,
A. Mittal, A. K. Moorthy, and A. C. Bovik, “No-reference image quality assessment in the spatial domain,”IEEE Transactions on Image Processing, vol. 21, no. 12, pp. 4695–4708, Dec. 2012
2012
-
[18]
Making a “completely blind
A. Mittal, R. Soundararajan, and A. C. Bovik, “Making a “completely blind” image quality analyzer,”IEEE Signal Processing Letters, vol. 20, no. 3, pp. 209–212, Mar. 2013
2013
-
[19]
Blind image quality evaluation using perception based features,
V . N, P. D, M. C. Bh, S. S. Channappayya, and S. S. Medasani, “Blind image quality evaluation using perception based features,” in 2015 Twenty First National Conference on Communications (NCC). IEEE, 2015, pp. 1–6
2015
-
[20]
Deep cnn-based blind image quality predictor,
J. Kim, A.-D. Nguyen, and S. Lee, “Deep cnn-based blind image quality predictor,”IEEE Transactions on Neural Networks and Learning Systems, vol. 30, no. 1, pp. 11–24, Jan. 2019
2019
-
[21]
Aciqa: A dataset and method for assessing the imaging quality of automotive cameras,
Y . Huang, H. Ni, K. Zhang, Z. Jia, F. Lu, X. Min, and G. Zhai, “Aciqa: A dataset and method for assessing the imaging quality of automotive cameras,” in2024 IEEE International Conference on Visual Communications and Image Processing (VCIP). IEEE, Dec. 2024, pp. 1–5
2024
-
[22]
Rankiqa: Learning from rankings for no-reference image quality assessment,
X. Liu, J. Van De Weijer, and A. D. Bagdanov, “Rankiqa: Learning from rankings for no-reference image quality assessment,” inProceedings of the IEEE international conference on computer vision, 2017, pp. 1040– 1049
2017
-
[23]
Variational inference with normalizing flows,
D. Rezende and S. Mohamed, “Variational inference with normalizing flows,” inInternational conference on machine learning. PMLR, 2015, pp. 1530–1538
2015
-
[24]
Density estimation using real NVP,
L. Dinh, J. Sohl-Dickstein, and S. Bengio, “Density estimation using real NVP,”CoRR, vol. abs/1605.08803, 2016. [Online]. Available: http://arxiv.org/abs/1605.08803
Pith/arXiv arXiv 2016
-
[25]
Learning densities in feature space for reliable segmentation of indoor scenes,
N. Marchal, C. Moraldo, R. Siegwart, H. Blum, C. Cadena, and A. Gawel, “Learning densities in feature space for reliable segmentation of indoor scenes,”IEEE Robotics and Automation Letters, vol. 5, no. 2, pp. 1032-1038, April 2020, vol. 5, no. 2, pp. 1032–1038, Apr. 2019
2020
-
[26]
Do deep generative models know what they don’t know?
E. Nalisnick, A. Matsukawa, Y . W. Teh, D. Gorur, and B. Lakshmi- narayanan, “Do deep generative models know what they don’t know?” arXiv preprint arXiv:1810.09136, 2018
Pith/arXiv arXiv 2018
-
[27]
Why normalizing flows fail to detect out-of-distribution data,
P. Kirichenko, P. Izmailov, and A. G. Wilson, “Why normalizing flows fail to detect out-of-distribution data,”Advances in neural information processing systems, vol. 33, pp. 20 578–20 589, 2020
2020
-
[28]
Feature density estimation for out-of-distribution detection via normalizing flows,
E. D. Cook, M.-A. Lavoie, and S. L. Waslander, “Feature density estimation for out-of-distribution detection via normalizing flows,”arXiv preprint arXiv:2402.06537, 2024
Pith/arXiv arXiv 2024
-
[29]
Deep residual learning for image recognition,
K. He, X. Zhang, S. Ren, and J. Sun, “Deep residual learning for image recognition,” inProceedings of the IEEE conference on computer vision and pattern recognition, 2016, pp. 770–778
2016
-
[30]
Emerging properties in self-supervised vision transformers,
M. Caron, H. Touvron, I. Misra, H. J ´egou, J. Mairal, P. Bojanowski, and A. Joulin, “Emerging properties in self-supervised vision transformers,” inProceedings of the IEEE/CVF international conference on computer vision, 2021, pp. 9650–9660
2021
-
[31]
Measuring colorfulness in natural images,
D. Hasler and S. E. Suesstrunk, “Measuring colorfulness in natural images,” inHuman Vision and Electronic Imaging VIII, B. E. Rogowitz and T. N. Pappas, Eds. SPIE, 2003
2003
-
[32]
Un esempio diΓ −-convergenza,
L. Modica and S. Mortola, “Un esempio diΓ −-convergenza,”Bollettino dell’Unione Matematica Italiana, vol. 14-B, pp. 285–299, 1977
1977
-
[33]
Bdd100k: A diverse driving dataset for heterogeneous multitask learning,
F. Yu, H. Chen, X. Wang, W. Xian, Y . Chen, F. Liu, V . Madhavan, and T. Darrell, “Bdd100k: A diverse driving dataset for heterogeneous multitask learning,” inProceedings of the IEEE/CVF conference on computer vision and pattern recognition, 2020, pp. 2636–2645
2020
-
[34]
Zenseact open dataset: A large-scale and diverse multimodal dataset for autonomous driving,
M. Alibeigi, W. Ljungbergh, A. Tonderski, G. Hess, A. Lilja, C. Lind- str¨om, D. Motorniuk, J. Fu, J. Widahl, and C. Petersson, “Zenseact open dataset: A large-scale and diverse multimodal dataset for autonomous driving,” inProceedings of the IEEE/CVF International Conference on Computer Vision, 2023, pp. 20 178–20 188
2023
-
[35]
Carla-object-detection-dataset,
DanielHfnr, “Carla-object-detection-dataset,” https://github.com/DanielHfnr/Carla-Object-Detection-Dataset, 2023, accessed: 2025-11-02
2023
-
[36]
Ultralytics yolo11,
G. Jocher and J. Qiu, “Ultralytics yolo11,” https://github.com/ultralytics/ultralytics, 2024
2024
-
[37]
End-to-end object detection with transformers,
N. Carion, F. Massa, G. Synnaeve, N. Usunier, A. Kirillov, and S. Zagoruyko, “End-to-end object detection with transformers,” in European conference on computer vision. Springer, 2020, pp. 213– 229
2020
discussion (0)
Sign in with ORCID, Apple, or X to comment. Anyone can read and Pith papers without signing in.