General Economics · arXiv:2608.00038 v1 · submitted 22 Jul 2026 · 58 references
Google's AI & Economy ATLAS v1.0: Mapping Gemini Usage in the Economy
The paper says
“This paper introduces the AI & Economy ATLAS (Activity, Task, Landscape, and Adoption Study), an ongoing economic research initiative using Google AI usage data.”
more of the abstract
The first iteration of ATLAS is built on 15 million de-identified interactions across the Gemini App, Google AI Mode, and Gemini API. Using privacy-preserving algorithms as well as established and bespoke classification methods, we map AI usage to over 800 occupations, 4000 tasks, 300 household activities, 150 countries, and 140 languages. We then make a number of observations on what the data reveals about AI's diffusion, and its usage at work and in day-to-day life. In the workplace, we show that while AI adoption spans occupations covering just above 88% of US employment, penetration remains shallow and overwhelmingly collaborative in nature, with end-to-end task automation limited in scope. Outside of work, AI spans activities making up about 98% of Americans' non-sleep time, with disproportionately high use in high-friction tasks such as engaging with government and professional service providers, likely delivering economic value that standard national accounts may miss. Globally, adoption scales with national wealth and has broad linguistic distribution, with English queries representing only around a third of volume. As we build upon ATLAS and expand its scope and capabilities, we will continue to provide large-scale empirical evidence to inform the public, policy and academic questions about the ongoing AI transformation.
from the abstract
Pith says
Machine review · deepseek-v4-flash · 4 Aug 2026 · what was read was not recorded · not checked by a person
It can be wrong. Challenge this review or reply to it.
Holds up, with conditions. Big, careful descriptive snapshot of real AI usage, but the headline '<10% automation' figure rests on a cluster-level intent classifier validated only on synthetic data. This line is wrong
4 major objections · 5 minor
How often objections from reviews like this one are right: not yet measured
Not checked: figures, code, what the 58 references say.
The paper says, at §3.6, Fig. 7
The review did not quote this passage.
Pith says: Objection 1 of 4 · major
The claim that end-to-end automation is less than 10% of non-routine cognitive conversations is load-bearing and rests on an intent classifier applied to cluster summaries, not individual conversations. The paper itself acknowledges that clusters 'could nest multiple user intents'; assigning one label per cluster means mixed-intent clusters will be labeled by the dominant content of an auto-generated summary, potentially undercounting automation.
more of objection 1
Validation in §2.1 and Appendix A.2.2 uses synthetic data generated by the same model family and reports no human-labeled conversation-level test for the intent construct. Please provide precision/recall against human raters on real conversations, or restrict the headline to a preliminary, classifier-relative share.
The paper says, at §3.4, Figs. 3–4
The review did not quote this passage.
Pith says: Objection 2 of 4 · major
The occupational coverage (68%) and median task saturation (21%) are defined relative to arbitrary thresholds—50 unique users per occupation and 25 unique users per task—and no sensitivity analysis is reported. Because the 'broad but shallow' conclusion is central, these thresholds should be varied (e.g., 10/25/100 users) or replaced with a continuous concentration measure to show that the qualitative finding is not an artifact of the chosen cutoffs. Without this, the 'shallow penetration' inference is partly built into the threshold choice.
The paper says, at §2.3, §3.6
The review did not quote this passage.
Pith says: Objection 3 of 4 · major
The sample is a two-week window (April 6–19, 2026) from consumer surfaces and free API only; paid/enterprise API is excluded. The paper correctly lists this as a limitation, but the <10% automation figure in the executive summary is not consistently qualified.
more of objection 3
Enterprise usage is likely the most automation-intensive, and a two-week window may be seasonally atypical (tax-related queries are noted in §3.3). Please restate all 'automation is rare' conclusions as applying to the included consumer/free surfaces and period, and provide robustness checks on alternative windows or partial enterprise data if available.
The paper says, at §2.1, App. A.2.2, App. B
The review did not quote this passage.
Pith says: Objection 4 of 4 · major
The accuracy of the work/non-work classifier, the O*NET/ATUS mapping, and the bespoke intent/expertise classifiers is validated only with synthetic ground truth and internal human ratings; no public validation item set or external benchmark is provided. Because all headline percentages inherit any systematic misclassification (e.g., a bias toward 'collaborative' labels), the authors should release a de-identified validation sample with human labels, or at minimum report per-category precision/recall against a held-out human-annotated set of real conversations.
more of objection 4
Without this, the mapping accuracy cannot be independently assessed.
5 minor objections
The paper says, at Abstract & §4.3
Pith says: minor objection 1 of 5
The Executive Summary states household time savings of 'just 30 minutes per week' while the model in §4.3 uses a range of 0.5–5% (≈5.4–53 minutes/week). Clarify that 30 minutes is an illustrative scenario within the range, not the conservative lower bound.
The paper says, at Abstract & §3.4
Pith says: minor objection 2 of 5
The abstract says '68% of occupations globally' and '88% of US employment' without noting that the 68% is an unweighted occupation share while the 88% is employment-weighted; please make this distinction explicit in the abstract.
show 3 more
The paper says, at §3.4, fn. 14
Pith says: minor objection 3 of 5
The upper/lower bounds on employment coverage at different task-saturation thresholds are informative; consider presenting them in the main text rather than a footnote, since they qualify the 'shallow diffusion' claim.
The paper says, at References
Pith says: minor objection 4 of 5
Several references have formatting issues: 'BLS , 2025' contains a stray space; Comin and Mestieri is listed as 'None 2014'; some NBER working papers and arXiv items are missing complete identifiers. Please standardize.
The paper says, at General
Pith says: minor objection 5 of 5
No data or code availability statement is provided. Even if the full data cannot be released, a statement about what ancillary materials (e.g., synthetic validation prompts, human rating instruments) will be made available would aid replicability.
What would settle it
Draw a stratified random sample of ~5,000 raw work conversations from the same surfaces (or, if privacy rules prohibit, use cluster summaries together with per-cluster conversation counts), have independent human annotators label each conversation/cluster with the five intent categories defined in Section 3.6, and compare against the pipeline's cluster-level labels. Recompute the automation share for non-routine cognitive work using human labels, weighted by cluster size. If the human-labeled share is materially above 10%, or if human annotators frequently disagree with the automated label on mixed-intent clusters, the central 'mostly assistive' conclusion is not robust. Ideally also release the human-labeled validation set and classifier code for independent reproduction.
from the skeptic's reading
How the review went
4 readings by deepseek-v4-flash · 4 Aug 2026
- Reader holds up, with conditions
- Skeptic agrees
- Editor wrote the verdict above
- Referee major revision: 4 major objections, 5 minor
Not run on this paper: the simulated authors' defence.
Pith did not check this review's objections against the paper.
The review in full
The review in brief, machine-written
Top of mind: this is the most detailed real-usage map of a consumer AI assistant we have, and it is a genuinely careful descriptive study. But the headline 'less than 10% automation' number is softer than the abstract implies, because it comes from a cluster-level intent classifier validated mostly on synthetic data. The paper is more hedged than its own press would suggest; still, that one number should not be treated as measured.
What is actually new and valuable: the scale (15M interactions across Gemini App, AI Mode, and API), the mapping to O*NET occupations and ATUS activities, the penetration-adjusted cross-country comparisons, and the language-switching analysis. The distinction between occupation coverage (68%) and task saturation (21% median) is a genuinely useful way to frame shallow diffusion. The wage-intensity gradient and the ATUS time-use regressions are plausible and, importantly, do not depend on the contested intent classifier. The authors are transparent about the pipeline and compare themselves to Anthropic and OpenAI rather than ignoring them.
The soft spots, in proportion: the stress-test concern about the intent classifier lands. The classifier labels cluster summaries, and clusters can nest multiple user intents; a single label per cluster will push mixed clusters toward the dominant surface intent. Validation on synthetic data generated by the same model family cannot catch model-specific bias in the 'automation' construct. So the '<10%' figure is a directional signal, not a firm estimate. The two-week window and the exclusion of paid/enterprise API usage mean work-related automation-intensive use is likely underrepresented. The 68% and 21% numbers also depend on arbitrary user thresholds (50 and 25), which the paper acknowledges but which make point estimates fragile. I would push back on the 'circularity' framing in the Pith Report: every classifier-based study defines its outcome; the real issue is validation, not self-reference. The household $100B value is properly presented as a scenario range, so it is less concerning than the automation claim.
Bottom line: this is a valuable descriptive contribution for labor economists and anyone studying AI diffusion. It deserves a serious referee, and I would bring it to a reading group. The main revision I would ask for is a human-labeled conversation-level validation of the intent classifier, or a clear downgrade of the automation claim to 'preliminary cluster-based estimate.'
The strongest objection
The most consequential claim—that end-to-end task automation represents less than 10% of AI conversations in non-routine cognitive work, implying AI is mostly assistive—depends entirely on the bespoke intent classifier in Section 3.6. The classifier does not label individual conversations; it labels cluster summaries, and the paper itself notes that clusters 'could nest multiple user intents.' With one label per cluster, any mixed-intent cluster will be assigned to whichever intent dominates the auto-generated summary. If those summaries are optimized for O*NET/ATUS taxonomy assignment rather than for intent, automation signals could be systematically underrepresented. Validation (Section 2.1, Appendix A.2.2) uses synthetic ground truth generated by the same model family used for classification, so it cannot detect model-specific biases in the 'automation' construct. Additionally, the sample is a two-week window from consumer surfaces plus free API; paid enterprise API logs are excluded (Section 2.3), so the work statistics may miss the most automation-intensive usage. The paper is carefully hedged, but the quantitative '<10%' figure is not yet established at the precision required to support the central policy claim.
The reader's weakest assumption already identifies the pipeline's classification accuracy—including the intent classifiers—as the key uncertainty. My stress-test sharpens this to the specific cluster-level intent classifier behind the <10% automation figure, which is the most policy-relevant and least externally validated component. The paper's own caveats in Section 3.6 and Section 2.3 support this concern: clusters can nest multiple intents, and paid enterprise usage is excluded. A human-labeled validation test would directly settle whether the automation share is robust or an artifact of classifier design. Since the reader already issued a CONDITIONAL verdict, my concern does not change the verdict; it reinforces the need to release validation data or an independent benchmark before the headline should be taken as established.
The referee's report
If the measurement pipeline is valid, this is one of the largest and most detailed empirical maps of real-world AI usage, directly informing debates on AI and labor, task-based models, household production, and the global digital divide. It complements existing industry studies (Anthropic, OpenAI) with a wider set of surfaces and introduces a household time-use taxonomy, a penetration-correction method for cross-country comparisons, and new evidence on language usage. The paper explicitly frames its findings as early observations and provides extensive methodological detail and privacy safeguards. However, the central quantitative claims—especially the <10% automation share and the 21% median task saturation—rest on proprietary LLM classifiers validated only on synthetic data and internal human ratings, with no public benchmark or released validation items. The economic correlations (wage elasticity, GDP elasticity) are descriptive and are not yet backed by causal identification. Thus the paper's significance is conditional on substantial external or human validation of the classification pipeline.
Pith's reading of the paper (a machine's summary, not the authors')
The paper builds a privacy-preserving census of AI use by mapping 15 million de-identified Gemini conversations to standard economic categories: occupations and tasks (O*NET/SOC), daily activities (ATUS), countries, and languages. Its central claim is that generative AI has diffused remarkably widely—touching 68% of occupations and activities covering 98% of Americans' waking hours—but has penetrated shallowly: the median occupation uses AI for only 21% of its tasks, and end-to-end automation accounts for under 10% of conversations in non-routine cognitive work. A sympathetic reader would see this as the first large-scale behavioral evidence that, at this stage, AI is a complement to human work and household life rather than a substitute. The paper also argues that home use, especially in high-friction bureaucratic tasks, generates value that GDP misses, and that global adoption tracks national wealth closely. Why it matters: it moves the debate from exposure projections to observed usage, giving policymakers an empirical foundation for questions about displacement, productivity, and the digital divide.
What carries the argument. The load-bearing machinery is the ATLAS measurement pipeline: 14.65 million de-identified interactions (Gemini App, AI Mode, and API, April 6–19, 2026) are PII-redacted, summarized, clustered by the OCTO tool, and then assigned to the O*NET/SOC work taxonomy and the ATUS time-use taxonomy, plus bespoke intent and expertise classifiers. A penetration adjustment using web-traffic referral shares is applied for cross-country comparisons. This machinery converts unstructured chat into statistically comparable task- and activity-level counts, which is what makes the headline percentages possible; every one of those percentages inherits the pipeline's classification accuracy.
Core claim. On its own terms, the paper's discovery is that actual AI usage is broad but shallow and overwhelmingly collaborative. At work, usage spans 68% of detailed occupations representing 88% of US employment, yet only 3% of occupations show AI usage for more than three-quarters of their tasks, and the median occupation shows usage for 21% of tasks. For non-routine cognitive work—the category that dominates interactions—the intent classifier attributes end-to-end automation to fewer than 10% of conversations, with the rest falling into partial drafting, review, ideation, or information retrieval. Outside work, over 86% of conversational interactions occur, and AI is over-represented in exactly the
The premise it rests on. The entire statistical picture rests on the automated classifiers—work/non-work triage, O*NET task and occupation assignment, intent, and expertise—being accurate on real conversations; they were validated only on synthetic ground truth and internal human ratings, with no public benchmark, and the sample is a two-week window from one provider's consumer surfaces.
If the paper is right (Pith's inferences, not the authors')
If correct, exposure-based projections of massive white-collar displacement are not matched by current real-world usage: the gap between 'affected' and 'automated' is large and measurable.
Household AI use in planning, research, and bureaucracy implies a flow of non-market time savings (the authors' scenario range is roughly $15–150 billion per year in the US) that standard GDP accounting omits.
The steep income and education gradient of usage implies that, absent deliberate diffusion measures, AI benefits may concentrate among higher-wage workers and wealthier countries, widening existing divides.
The 9–12% higher turn counts and 18–20% more tokens for non-primary-language interactions suggest investments in multilingual capability carry a measurable efficiency dividend for users.
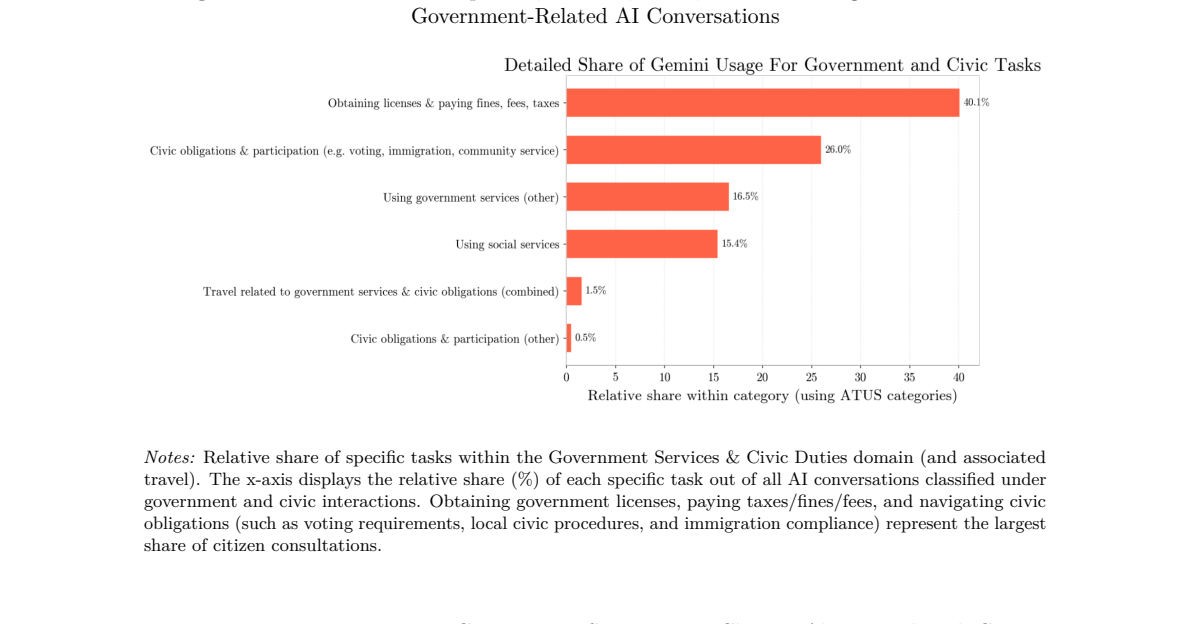
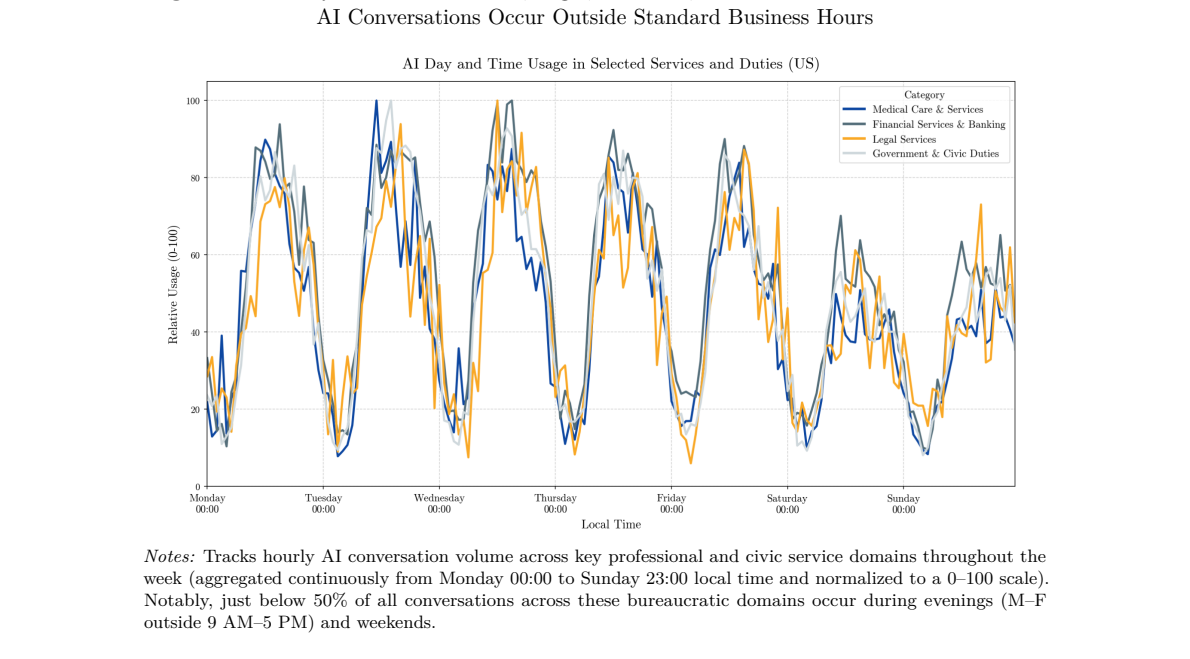
The government-services over-representation (roughly 20 times its time share) and off-hours usage suggest AI is already functioning as a de facto extension of public-service access, with implications for digital-government design.
If the shallow-usage pattern reflects current capability rather than intrinsic demand, the 21% median task saturation is a lower bound; one testable extension is to track whether saturation rises as model capabilities improve in the same panel.
The paper's own limitation—no outcome data—suggests a natural extension: link usage clusters to downstream task completion or time-use diaries to estimate actual productivity gains rather than conversation counts.
The language-symmetry result (work and non-work code-switching nearly identical) could be tested against other providers' data; if it holds, it implies that perceived multilingual quality gaps are not driving task-sorting behavior.
The 'interest-adoption gap' between search interest and usage in emerging markets invites a causal study: does lowering access costs (e.g., cheaper data plans, SMS-based AI) convert interest into usage, as suggested by some cited pilots?
Check this review
Pith stored no record of this review's passes and took no fingerprint of it. Reviews made by code from 13 Nov 2026 on carry both.
How often reviews like this one are right
Reviews like this one: written by deepseek-v4-flash, where what was read was not recorded.
How often objections from reviews like this one are right: not yet measured
Reviews by people
This review was written by a machine. No person has reviewed this paper on Pith yet. A scientist listed on Pith can review it for a fee, and their review is published here whatever it concludes.
The paper
Abstract
This paper introduces the AI & Economy ATLAS (Activity, Task, Landscape, and Adoption Study), an ongoing economic research initiative using Google AI usage data. The first iteration of ATLAS is built on 15 million de-identified interactions across the Gemini App, Google AI Mode, and Gemini API. Using privacy-preserving algorithms as well as established and bespoke classification methods, we map AI usage to over 800 occupations, 4000 tasks, 300 household activities, 150 countries, and 140 languages. We then make a number of observations on what the data reveals about AI's diffusion, and its usage at work and in day-to-day life. In the workplace, we show that while AI adoption spans occupations covering just above 88% of US employment, penetration remains shallow and overwhelmingly collaborative in nature, with end-to-end task automation limited in scope. Outside of work, AI spans activities making up about 98% of Americans' non-sleep time, with disproportionately high use in high-friction tasks such as engaging with government and professional service providers, likely delivering economic value that standard national accounts may miss. Globally, adoption scales with national wealth and has broad linguistic distribution, with English queries representing only around a third of volume. As we build upon ATLAS and expand its scope and capabilities, we will continue to provide large-scale empirical evidence to inform the public, policy and academic questions about the ongoing AI transformation.
The paper's own sentences, arranged, kept beside the review and separate from it. Each label is drawn from a closed vocabulary; the number beside it is the probability the classifier gave that label. No sentence in this record was written by a model.
abstract compiled · 2026-09-23
The authors' main claim, as the classifier picked it out 0.69
“In the workplace, we show that while AI adoption spans occupations covering just above 88% of US employment, penetration remains shallow and overwhelmingly collaborative in nature, with end-to-end task automation limited in scope.”
How the main claim is stated: asserted 1.00
What the abstract itself states, as probabilities: claims first 0.15 · states limitation 0.65 · human participants 0.54 · controlled comparison 0.03 · randomized assignment 0.01 · states quantitative result 0.99 · compares with prior results 0.07 · mentions code or data availability 0.04
The abstract, sentence by sentence
This table labels the abstract only (arXiv listing abstract v1). The number is the probability the classifier gave the label.
| Sentence | Role | The authors' own work | States the main conclusion | Strength |
|---|---|---|---|---|
| This paper introduces the AI & Economy ATLAS (Activity, Task, Landscape, and Adoption Study), an ongoing economic research initiative using Google AI usage data. | contribution 0.99 | 0.76 | 0.03 | asserted 0.99 |
| The first iteration of ATLAS is built on 15 million de-identified interactions across the Gemini App, Google AI Mode, and Gemini API. | method 0.92 | 0.88 | 0.03 | asserted 1.00 |
| Using privacy-preserving algorithms as well as established and bespoke classification methods, we map AI usage to over 800 occupations, 4000 tasks, 300 household activities, 150 countries, and 140 languages. | method 0.93 | 0.94 | 0.04 | asserted 1.00 |
| We then make a number of observations on what the data reveals about AI's diffusion, and its usage at work and in day-to-day life. | contribution 0.76 | 0.82 | 0.07 | unclear 0.56 |
| In the workplace, we show that while AI adoption spans occupations covering just above 88% of US employment, penetration remains shallow and overwhelmingly collaborative in nature, with end-to-end task automation limited in scope. | result 0.99 | 0.96 | 0.23 | asserted 1.00 |
| Outside of work, AI spans activities making up about 98% of Americans' non-sleep time, with disproportionately high use in high-friction tasks such as engaging with government and professional service providers, likely delivering economic value that standard national accounts may miss. | result 0.79 | 0.93 | 0.19 | hedged possibility 0.73 |
| Globally, adoption scales with national wealth and has broad linguistic distribution, with English queries representing only around a third of volume. | result 1.00 | 0.91 | 0.08 | asserted 1.00 |
| As we build upon ATLAS and expand its scope and capabilities, we will continue to provide large-scale empirical evidence to inform the public, policy and academic questions about the ongoing AI transformation. | future work 1.00 | 0.13 | 0.04 | asserted 0.78 |
What kind of paper the classifier reports this is: empirical study 0.68 · evidence from analysis of existing data 0.90
What was examined, and what was not
Sources read
- arXiv listing abstract v1
Not examined
- full text
- figures and tables
- references and citing sentences
- relations to other papers
Levels run
- P abstract
Not run
- S sections
- T body sentences
- C citations
- R cross-paper relations
How the labels were made
Compiled by classifier-1.13.0 via TypeSafe API, question bank abstract-p1-20260923, 2026-09-23: 1 request, 6,435 input tokens.
Every quoted sentence on this record is the authors'. Every label is from Pith's closed vocabulary, with the probability shown beside it. This record as JSON
Figures (45)































Showing 41 of the paper's 45 figures. Figures are the authors', reproduced from the paper.
References (58)
- [1] Acemoglu, Daron and David Autor, “Skills, Tasks and Technologies: Implications for Employment and Earnings,”Chapter 12, Handbook of Labor Economics, 2011, p. 1043–1171. and Pascual Restrepo, “Automation and New Tasks: How Technology Displaces and Reinstates Labor,”Journal of E... on Pith
- [4] Autor, David H., Frank Levy, and Richard J. Murnane, “The Skill Content of Recent Technological Change: An Empirical Exploration,”The Quarterly Journal of Economics, 11 2003,118(4), 1279–1333. Barop, Johanna and Joseph Levine, “AfriGPT: LLMs over SMS,” on Pith
- [6] Becker, Gary S., “A Theory of the Allocation of Time,”The Economic Journal, 9 1965,75 (299), 493–517. Bick, Alexander, Adam Blandin, and David J. Deming, “The Rapid Adoption of Generative AI,” Working Paper 32966, National Bureau of Economic Research September on Pith
- [7] , , , Nicola Fuchs-Schündeln, and Jonas Jessen, “Mind the Gap: AI Adoption in Europe and the US,”Brookings Papers on Economic Activity, 2026,Spring. Björkegren, Daniel, Jun Ho Choi, Divya Budihal, Dominic Sobhani, Oliver Garrod, and Paul Atherton, “Could AI Leapfrog the Web? E... on Pith
- [8] BLS, “2024 American Time Use Survey (ATUS) Activity Lexicon,” U.S. Bureau of Labor Statistics on Pith
- [9] BLS,2018 Standard Occupational Classification ManualU.S. Bureau of Labor Statistics on Pith
- [11] or Business and Financial Operations Occupation (SOC 13). The same issues apply to time use categories: an adult asking AI for instructions on building a nest box with a 10-year old could do so for their own child (‘Arts and crafts with household children’) or their visiting n... on Pith
- [12] , Avinash Collis, W. Erwin Diewert, Felix Eggers, and Kevin J. Fox, “GDP-B: Ac- counting for the Value of New and Free Goods,”American Economic Journal: Macroeconomics, October 2025,17(4), 312–44. , Bharat Chandar, and Ruyu Chen, “Canaries in the Coal Mine? Six Facts about the... on Pith
- [13] , Danielle Li, and Lindsey Raymond, “Generative AI at Work,”The Quarterly Journal of Economics, February 2025,140(2), 889–942. Bureau of Labor Statistics, “Educational attainment for workers 25 years and older by detailed occupation,” U.S. Department of Labor on Pith
- [14] , “Occupational Employment and Wage Statistics May 2024 National Data,” U.S. Department of Labor on Pith
- [16] Charikar, Moses S., “Similarity estimation techniques from rounding algorithms,” in “Pro- ceedings of the thiry-fourth annual ACM symposium on Theory of computing” STOC02 ACM May 2002, p. 380–388. Chatterji, Aaron, Thomas Cunningham, David J Deming, Zoe Hitzig, Christopher Ong... on Pith
- [17] Comin, Diego and Bart Hobijn, “An Exploration of Technology Diffusion,”American Economic Review, December 2010,100(5), 2031–59. and Marti Mestieri, “Technology Diffusion: Measurement, Causes, and Consequences,” None on Pith
- [19] Original version October 2024, revised May on Pith
- [20] Dell’Acqua, Fabrizio, Edward McFowland, Ethan Mollick, Hila Lifshitz, Katherine C. Kellogg, Saran Rajendran, Lisa Krayer, François Candelon, and Karim R. Lakhani, “Navigating the Jagged Technological Frontier: Field Experimental Evidence of the Effects of Artificial Intelligen... on Pith
- [21] Eloundou, Tyna, Sam Manning, Pamela Mishkin, and Daniel Rock, “GPTs are GPTs: Labor market impact potential of LLMs,”Science, 2024,384(6702), 1306–1308. England, Paula, Michelle Budig, and Nancy Folbre, “Wages of Virtue: The Relative Pay of Care Work,”Social Problems, November... on Pith
- [23] Gentzkow, Matthew, Bryan Kelly, and Matt Taddy, “Text as Data,”Journal of Economic Literature, September 2019,57(3), 535–74. Gimbel, Martha, Joshua Kendall, and Ryan Nunn, “What We Do and Don’t Know About How AI is Affecting the Labor Market,” The Budget Lab May on Pith
- [25] , “Google Search’s I/O 2026 updates: AI agents and more,” Google Blog May on Pith
- [26] Gottfried, Jeffrey, William Bishop, Monica Anderson, Michelle Faverio, Eugenie Park, and Colleen McClain, “Americans and AI 2026: Chatbots, Smart Devices and Views on Impact,” Report, Pew Research Center June on Pith
- [28] Hertog, Ekaterina, Setsuya Fukuda, Rikiya Matsukura, Nobuko Nagase, and Vili Lehdonvirta, “The future of unpaid work: Estimating the effects of automation on time spent on housework and care work in Japan and the UK,”Technological Forecasting and Social Change, 2023,191, 12244... on Pith
- [29] Substack blog. International Monetary Fund, “World Economic Outlook Database, October 2024,” Wash- ington, DC: International Monetary Fund on Pith
show 38 more
- [30] Ipsos and Google, “Google / Ipsos Multi-Country AI Survey 2026,” Report, Ipsos January on Pith
- [31] Jones, Charles I. and Peter J. Klenow, “Beyond GDP? Welfare across Countries and Time,” American Economic Review, 2016,106(9), 2426–2457. Kalyani, Aakash, Nicholas Bloom, Marcela Carvalho, Tarek Hassan, Josh Lerner, and Ahmed Tahoun, “The Diffusion of New Technologies,”The Qua... on Pith
- [32] Korinek, Anton, “Generative AI for Economic Research: Use Cases and Implications for Economists,”Journal of Economic Literature, January 2023,61(4), 1281–1317. and Joseph E Stiglitz, “Artificial Intelligence, Globalization, and Strategies for Economic Development,” Working Pap... on Pith
- [34] Light, Richard J., “Measures of response agreement for qualitative data: Some generalizations and alternatives.,”Psychological Bulletin, November 1971,76(5), 365–377. Lindenlaub, Ilse, Ryungha Oh, Maria Alejandra Rodriguez, and Laura Veldkamp, “Beyond Exposure: Predicting AI A... on Pith
- [35] Lundin, JessicaM., AdaZhang, NihalKarim, HamzaLouzan, GuohaoWei, DavidIfe- oluwa Adelani, and Cody Carroll, “The Token Tax: Systematic Bias in Multilingual Tokenization,” in “Proceedings of the 7th Workshop on African Natural Language Processing (AfricaNLP 2026)” Association f... on Pith
- [36] Mathiowetz, Nancy A., “Errors in Reports of Occupation,”Public Opinion Quarterly, 01 1992,56(3), 352–355. Mellow, Wesley and Hal Sider, “Accuracy of Response in Labor Market Surveys: Evidence and Implications,”Journal of Labor Economics, 10 1983,1(4), 331–344. 68 METR, “Task-C... on Pith
- [37] Milkie, Melissa A., Liana C. Sayer, Kei Nomaguchi, and Hope Xu Yan, “Who’s Doing the Housework and Childcare in America Now? Differential Convergence in Twenty-First- Century Gender Gaps in Home Tasks,”Socius: Sociological Research for a Dynamic World, February 2025,11. Misra,... on Pith
- [38] , , , , and Juan M. Lavista Ferres, “Measuring AI Diffusion Across U.S. Geographies: County, State, and Metro Estimates,” Technical Report MSR-TR-2026-18, Microsoft Research May on Pith
- [39] Møgelvang, Anja, Camilla Bjelland, Simone Grassini, and Kristine Ludvigsen, “Gen- der Differences in the Use of Generative Artificial Intelligence Chatbots in Higher Education: Characteristics and Consequences,”Education Sciences, 2024,14(12). National Center for O*NET Develop... on Pith
- [41] Ramey, Valerie A., “Time Spent in Home Production in the Twentieth-Century United States: New Estimates from Old Data,”The Journal of Economic History, 2009,69(1), 1–47. Reid, Margaret,Economics of Household Production, London: Chapman and Hall, on Pith
- [42] Sajadieh, Sha, Loredana Fattorini, Raymond Perrault, Yolanda Gil, Vanessa Parli, Lapo Santarlasci, Juan Pava, Nestor Maslej, Russ Altman, Erik Brynjolfsson, Carla Brodley, Jack Clark, Virginia Dignum, Vipin Kumar, James Landay, Terah Lyons, James Manyika, Juan Carlos Niebles, ... on Pith
- [43] Schreyer, Paul and W. Erwin Diewert, “Household Production, Leisure, and Living Standards,” September 2014, pp. 89–114. Scur, Daniela, Raffaella Sadun, John Van Reenen, Renata Lemos, and Nicholas Bloom, “The World Management Survey at 18: lessons and the way forward,”Oxford Re... on Pith
- [44] Syverson, Chad, “What Determines Productivity?,”Journal of Economic Literature, June 2011,49(2), 326–65. Tamkin, Alex, Miles McCain, Kunal Handa, Esin Durmus, Liane Lovitt, Ankur Rathi, Saffron Huang, Alfred Mountfield, Jerry Hong, Stuart Ritchie, Michael Stern, Brian Clarke, ... on Pith
- [45] Verma, Gaurav, Siddharth Suri, and Scott Counts, “How Copilot Changed the Pace of Work in Word — And How We Measured It,” Technical Report MSR-TR-2026-24, Microsoft June on Pith
- [46] 70 Warrens, Matthijs J., “A Formal Proof of a Paradox Associated with Cohen’s Kappa,”Journal of Classification, October 2010,27(3), 322–332. Wilmers, Nathan, “Generative AI and the Future of Inequality,”An MIT Exploration of Generative AI, mar 27 on Pith
- [47] 71 Appendix A Data and Methodology This section provides further detail about the data sources for ATLAS, the methodological steps in preparing the dataset and privacy preservation measures we took at every step. In brief, the fully automated pipeline for data processing proce... on Pith
- [48] On each of the surfaces noted above, we sample approximately 5 million interactions—full conversations (for Gemini App and AIM) and request-response pairs (for Gemini API)—which satisfy basic data cleaning and materiality filters.65 These samples are then re-weighted by the ov... on Pith
- [49] and industry (Tamkin et al., 2024; Eloundou et al., 2024; Tomlinson et al., 2025; Verma et al., 2026; Chatterji et al., 2025). To support research, as well as other internal use cases, Google DeepMind has developed Observation Clustering and Taxonomy Organisation (OCTO), a too... on Pith
- [51] to ensure classification outputs conform to one of the provided taxa only. This approach is then applied recursively to traverse the taxonomy, assigning clusters at each level to the most suitable category within the set of descendants from the category selected at a higher le... on Pith
- [54] for examples of classified conversations for human raters to review to protect the privacy of our users. B.3.1 Inter-rater Agreement We start the measurement of inter-rater agreement by identifying the plurality consensus among the three human annotators, defined as the catego... on Pith
- [56] to omit tasks that are not important. We exclude any occupation for which fewer than 50% of tasks have available importance ratings. 89 Figure 33:Distribution of Task Expertise Scores Across the O*NET Task Universe Notes:We calculate scores measuring the expertise of tasks in ... on Pith
- [57] 90 D Additional Tables and Figures, Household Section Figure 34:Granular Task Comparison Highlights AI Over-Representation in Specialized Knowledge and Under-Representation in Routine Chores Notes:Compares U.S. AI conversation shares against ATUS human time shares across the 1... on Pith
- [100] GDP per capita data is sourced from the World Bank (2024a) WDI database (or International Monetary Fund (2024) WEO where missing). Only countries/regions with more than 1,000,000 inhabitants with official availability of Gemini Apps are featured; Mainland China is excluded. Th... on Pith
- [1977] kappa evaluation scale. Mean pairwise Cohen’s and Fleiss’ kappas show ‘moderate’ or ‘substantial’ agreement between the LLM classifiers and human annotators. For example, the SOC major groups classification achieved a plurality agreement kappa of 0.83, and Fleiss’ kappa of 0.6... on Pith
- [1983] Caselli, Francesco and Wilbur John Coleman, “Cross-Country Technology Diffusion: The Case of Computers,”American Economic Review, May 2001,91(2), 328–335. Cerutti, Eugenio, Antonio Garcia Pascual, Yosuke Kido, Longji Li, Giovanni Melina, Marina Mendes Tavares, and Philippe Win... on Pith
- [1988] Noy, Shakked and Whitney Zhang, “Experimental evidence on the productivity effects of generative artificial intelligence,”Science, 2023,381(6654), 187–192. OECD,OECD Policy Insights on Well-being, Inclusion and Equal OpportunityDecember on Pith
- [1992] Bridgman, Benjamin, “A Disaggregated View of Household Production Trends,”AEA Papers and Proceedings, May 2023,113, 619–22. , Andrew Craig, and Danit Kanal, “Accounting for Household Production in the National Accounts: An Update 1965–2020,”Survey of Current Business, 2022,102... on Pith
- [2001] can best improve economic research on AI use. B.1.2 Classifier Validation Under Information Constraints Assessing classifier performance in contexts like ATLAS is inherently difficult due to lack of ground truth data. Even if unrestricted access to raw logs were possible, the ... on Pith
- [2002] to avoid evaluating probabilistically distant pairs. To maximize recall, this process is repeated across multiple independent projection vectors to yield an approximate nearest neighbor graph. Finally, the resulting graph acts as the input to affinity clustering, a large-scale... on Pith
- [2014] , “Do-it-yourself Digital: the Production Boundary, the Productivity Puzzle and Economic Welfare,”Economica, August 2018,86(344), 750–774. and Leonard Nakamura, “Time Use, Productivity, and Household-Centric Measurement of Welfare in the Digital Economy,” on Pith
- [2018] Bound, John, Charles Brown, and Nancy Mathiowetz, “Measurement Error in Survey Data,” 2001, p. 3705–3843. Bresnahan, Timothy F and Manuel Trajtenberg, “General Purpose Technologies, Engines of Growth?,” Working Paper 4148, National Bureau of Economic Research August on Pith
- [2019] , , and , “Occupational, industry, and geographic exposure to artificial intelligence: A novel dataset and its potential uses,”Strategic Management Journal, May 2021,42(12), 2195–2217. Fleiss, Joseph L., “Measuring nominal scale agreement among many raters.,”Psychological Bull... on Pith
- [2021] Kuznets, Simon, “National Income, 1929-1932,” in “National Income, 1929-1932,” National Bureau of Economic Research, June 1934, pp. 1–12. Lancaster, Kelvin J., “A New Approach to Consumer Theory,”Journal of Political Economy, 1966,74(2). 67 Landis, J. Richard and Gary G. Koch,... on Pith
- [2022] Gronau, Reuben, “Leisure, Home Production, and Work–the Theory of the Allocation of Time Revisited,”Journal of Political Economy, 1977,85(6), 1099–1123. Gupta, Ashim, MaitreyMehta, ZhichaoXu, andVivekSrikumar, “FoundinTranslation: Measuring Multilingual LLM Consistency as Simp... on Pith
- [2023] Ahuja, Kabir, Harshita Diddee, Rishav Hada, Millicent Ochieng, Krithika Ramesh, Prachi Jain, Akshay Nambi, Tanuja Ganu, Sameer Segal, Mohamed Ahmed, Kalika Bali, and Sunayana Sitaram, “MEGA: Multilingual Evaluation of Generative AI,” in Houda Bouamor, Juan Pino, and Kalika Bal... on Pith
- [2024] Google, “Google I/O 2026: Sundar Pichai’s opening keynote,” Google Blog May on Pith
- [2025] Artificial Analysis, “Multilingual AI Model Benchmark,”https://artificialanalysis.ai/ models/multilingual2026. Audoly, Richard, Miles Guerin, and Giorgio Topa, “Do Job Postings Show Early Labor-Market Effects of AI?,”Liberty Street Economics, 2026, (May 14). Liberty Street Eco... on Pith
- [2026] Work in progress, Oxford Internet Institute in partnership with Africell. Bateni, MohammadHossein, Soheil Behnezhad, Mahsa Derakhshan, Mohammad- TaghiHajiaghayi, RaimondasKiveris, SilvioLattanzi, andVahabMirrokni, “Affinity Clustering: Hierarchical Clustering at Scale,” in “NI... on Pith
Cited by 4 Pith papers
Reviewed papers on Pith that cite this one. The full citation record
- Creative destruction: Human-AI competition in an experimental market econ.GN · Oct 2026
- LLMs and the Organization of Scientific Work cs.CY · Nov 2026
- What is Work For? Labor, Politics, and Meaning in the Age of AI econ.GN · Oct 2026
- Characterizing Agentic Flooding of Government Services cs.CY · Aug 2026
How the literature uses it
What this paper does with the arXiv papers it cites
What it cites · 8 sentences without a confident label
Uses data or values from 2 papers
-
[ref] analyzed AI task usage, determining 57% of usage suggests augmentation while 43% of usage suggests automation of human capabilities.
Which Economic Tasks are Performed with AI? Evidence from Millions of Claude Conversations · The Broad Picture · 0.86
-
[ref] use household internet browsing data from US home devices to find that household AI adoption may translate to an effective time savings of roughly 43%–64%, but these estimates may differ for non-browsing activities.
2603.03144 · Non-Market Welfare: Valuing Household Time Savings · 0.83
Compares with 1 paper
-
Around 30% of occupations had at least a quarter of their tasks observed with Gemini usage above our threshold.[Comparing this to data from the Anthropic Economic Index, this is slightly lower than the 36% from [ref] and the reported “combined across reports” figure of 49% from [ref] .
Which Economic Tasks are Performed with AI? Evidence from Millions of Claude Conversations · Occupation and Task Coverage · 0.99
Cites as support 1 paper
-
In this scenario, existing advantages are locked in and potentially amplified through several channels: * Task Selection: When task choice is left to the worker, lower-skilled workers may apply AI inappropriately, resulting in performance drops, whereas higher-skilled workers select tasks where the tool provides high utility [ref] . * Complementary Judgment: Effective utilization of AI in non-routine cognitive work requires high-level human capital inputs such as architectural judgment, error-detection, and code-reading ability to verify and integrate AI outputs [ref] . * Seniority-Biased Demand: If senior workers leverage AI more effectively, firms may substitute away from entry-level hiring while keeping senior employment stable, leading to a seniority-biased technological change that shifts career ladders and exacerbates wage premiums [ref] .
How much does AI impact development speed? An enterprise-based randomized controlled trial · Discussion: The Adoption Margin and Implications for Inequality · 0.97
Cites as background 1 paper
-
Even after isolating the language effect from task sorting via granular ATUS activity and language fixed effects[We note a related NLP literature on “tokenization bias” [ref] .
Do All Languages Cost the Same? Tokenization in the Era of Commercial Language Models · Languages of AI Usage · 0.80
Challenges and discussion
Disagree with the review, or know something it missed? Leave a comment, or challenge this review formally: a challenge becomes a permanent entry in this paper's record, and its decision is published here.
Come back by email
A short list of the week's newly reviewed papers. Nothing is sent until you confirm from your inbox, and every email has a link that stops it. No account.
No comments yet.
Sign in to comment