REVIEW 4 major objections 4 minor 63 references
Open-source vision-language models, prompted on street-view photos, can estimate residential blight citywide, and stacking three models' outputs into an XGBoost ensemble yields more accurate and robust assessments than any single model.
Reviewed by Pith at T0; open to challenge. T0 means a machine referee read the full paper against a public rubric. the ladder, T0–T4 →
Open-source vision-language models with an XGBoost ensemble can assess residential blight from street-view images, but reported performance is inflated by test-set threshold tuning.
T0 review reviewed 2026-08-04 challenge →
load-bearing objection A useful applied paper whose central ensemble-advantage claim is undermined by test-set threshold tuning and an internal contradiction. the 4 major comments →
Can Urban Blight Be Accessed with Vision-language Models: A Case Study in Detroit
The pith
A machine-rendered reading of the paper's core claim, the machinery that carries it, and where it could break.
The reading
Core claim
The paper's central claim is that residential blight can be assessed from street-level imagery by open-source vision-language models when each house is viewed from multiple perspectives and the models are asked, via structured prompts, for both a binary judgment and a calibrated probability of damage for roof, openings, and facade. Evaluated against 18,886 Detroit Land Bank Authority professional in-person assessments in Detroit, the three VLMs show complementary inference strengths, and an XGBoost meta-learner trained on their outputs—including probability summaries and agreement/difference features—outperforms every individual model on accuracy, F1, and Kappa. The ensemble also has the low
What carries the argument
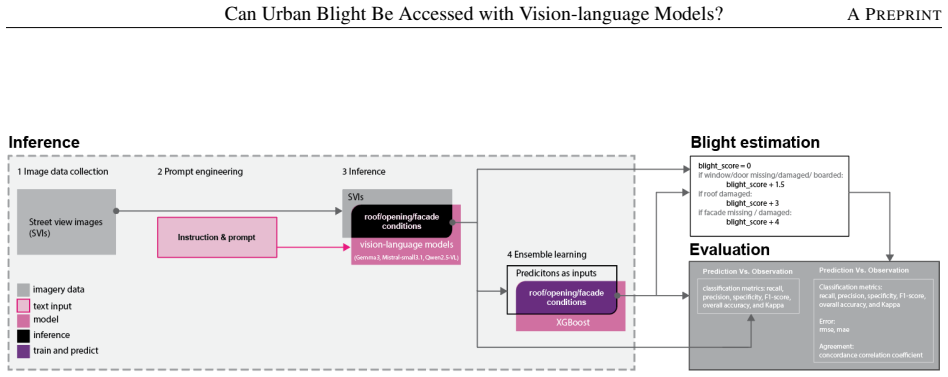
The load-bearing mechanism is stacked generalization: three open-source VLMs (Gemma3 27B, Mistral-small3.1 24B, Qwen2.5-VL 32B), quantized to 4 bits and run at temperature 0, independently score each of three street views per property on roof, window/door, and facade damage. Their outputs are condensed into 18 engineered features—per-model binary vote, vote count, mean/min/max/SD probability, and pairwise agreement and difference—which an XGBoost meta-learner combines. A blight score weights damages by severity (+3 roof, +1.5 opening, +4 facade). The decision threshold is chosen on the test set to maximize Cohen's Kappa or F1, and the threshold objective controls the precision–recall trade-o
Load-bearing premise
The evaluation tunes the decision threshold on the held-out test set to maximize Cohen's Kappa; the central claim assumes this is an honest measure of generalization, rather than fixing thresholds before seeing the test set.
What would settle it
Recompute the ensemble-versus-best-base comparison with the threshold fixed on a validation split, or via nested cross-validation, before any test-set evaluation. If the ensemble's Kappa or accuracy advantage over the best single model disappears, the claim that the ensemble learner outperforms individual base models is not supported by this data.
If this is right
- Multiple street views of the same property reliably improve kappa, accuracy, recall, and F1 over any single view, at the cost of some precision and specificity.
- Different VLMs are complementary: Gemma3 leads on openings but overpredicts, Qwen2.5-VL is conservative with high precision and low recall, and Mistral-small3.1 is balanced.
- The stacked ensemble beats every base model on accuracy, F1, Kappa, RMSE, MAE, and concordance, with the largest gains on facade and window/door conditions.
- Practitioners can tune the threshold to prioritize recall for broad screening or precision for enforcement, and use probability surfaces to identify high-risk hotspots.
- The framework provides a low-cost, regularly updatable complement to formal blight surveys, guiding field-inspection triage.
Where Pith is reading between the lines
- Because thresholds are tuned on the held-out test set to maximize Kappa, the reported ensemble gains likely overstate what a deployment would see; fixing thresholds on a validation split before test evaluation is the natural follow-up re-analysis.
- The SHAP result that mean predicted probability dominates feature importance suggests a simple average of model probabilities may capture much of the ensemble's benefit; the paper's more elaborate agreement features contribute less.
- The framework should transfer to other cities and to storefront vacancy, yard maintenance, or post-disaster damage screening, but transferability is untested here—Detroit's housing styles, image distribution, and blight base rates may differ.
- A testable extension is to check whether increasing ensemble diversity, through more base VLMs or varied temperature settings, improves robustness without fine-tuning, which the authors list as future work.
Editorial analysis
A structured set of objections, weighed in public.
Referee Report
Summary. The paper proposes a scalable framework for estimating residential blight in Detroit using three open-source vision-language models (Gemma 3, Mistral-small 3.1, Qwen2.5-VL) applied to multiple street-view images per property. Structured prompts elicit binary damage judgments and probabilistic estimates for roof, window/door, and facade conditions, which are compared with professional Detroit Land Bank Authority annotations. A weighted blight score is derived, and an XGBoost stacked ensemble combines the base-model outputs with engineered features. The authors report that multiple street views help, that the three models have complementary strengths, and that the ensemble learner outperforms all individual models. They position the framework as a low-cost, regularly updatable complement to in-person surveys.
Significance. The application is timely and practically important: if validated, the framework could give municipalities a low-cost, scalable, and regularly updatable complement to labor-intensive blight surveys. The evaluation against independent professional annotations is a genuine strength and is not circular. The use of open-source models and a stacking approach is also a sensible design choice. However, the paper's central empirical claim—ensemble superiority over all base models—is not supported by the evaluation as reported because the decision threshold is tuned on the test set, the comparison with base models is asymmetric, and the paper's own numbers contain a direct contradiction with the abstract. The practical relevance is high, but the current evidence base needs substantial revision before the claims can be accepted.
major comments (4)
- [§3.3 and §4.3] The decision threshold for the ensemble is selected by sweeping 0.10–0.90 and choosing the threshold that maximizes Cohen's Kappa, and then the reported metrics are 'based on the test set' (§4.3). No separate validation split is described. This makes the threshold a test-set-fitted parameter, so the reported Kappa/F1/accuracy values are in-sample estimates for that threshold choice. If base models are evaluated with their native binary decision rule and did not receive the same threshold sweep, the comparison is also asymmetric. A clean protocol would fix thresholds on a training/validation split (or via nested cross-validation) before any test-set evaluation. As presented, the headline claim that the ensemble learner outperforms all base models is not supported.
- [§4.3, Fig. 6, Abstract, Conclusion] The text states that the ensemble 'attains higher accuracy (0.7–0.77), F1-score (0.71–0.84), and kappa (0.41–0.43) across all residential conditions compared to the base models, with a slight drop in accuracy and F1-score compared to Gemma3.' Gemma3 is one of the base models, so the unqualified statements in the abstract and conclusion ('the ensemble learner outperforms individual base models', 'outperforming each base model') are contradicted by the paper's own reported numbers. The authors should re-specify the primary metric and provide a statistical comparison; if the claim is only 'better on Kappa and error measures, but not on all metrics', the abstract and conclusion must be revised accordingly.
- [§4.1, Fig. 3, Appendix C] The claimed benefit of multiple street views is partly an artifact of the OR-aggregation rule. Appendix C defines the property-level binary prediction as the OR of the three street-view predictions: 'If any of the three street views is predicted as positive, the property-level outcome is set to 1.' Under this rule, adding views mechanically increases recall and decreases precision/specificity, which is exactly the pattern reported in Fig. 3b. This does not by itself establish that multiple views contribute information. The authors should compare OR aggregation with alternatives (AND, majority vote, mean-probability threshold) and report single-view baselines under the same evaluation. Without this, claim (i) is not fully supported.
- [§3.4 and §4] All classification metrics are computed on a single 30% split with no confidence intervals, bootstrap resampling, or significance tests for accuracy, F1, and Kappa. Given that the ensemble's advantage over the best base model is modest and partially contradicted by the text, point estimates without uncertainty are insufficient. Please provide confidence intervals or paired tests (e.g., bootstrap over properties, McNemar's test) for at least accuracy, F1, and Kappa, and ideally for the threshold-tuning procedure as well.
minor comments (4)
- [Title] The title appears to contain a typo: 'Accessed' should likely be 'Assessed'.
- [§5.4] The phrase 'moderate agreement between prepositions and observations' should read 'between predictions and observations'.
- [§6, Conclusion] The statement 'it proved accurate compared to trained in-person assessors' overstates the results, given the paper's own report that Kappa is below 0.6 for the residential conditions.
- [References] Some citations are inconsistent, e.g., 'Zuo & Wang et al., 2022' appears where the second author's name is likely 'Wang'; please check the reference list for correctness.
Circularity Check
Ensemble advantage rests in part on a decision threshold fitted to the test labels, making the headline comparison partly an in-sample fit rather than an independent prediction.
specific steps
-
fitted input called prediction
[Section 3.3 (threshold selection) and Fig. 6 caption / Section 4.3 (test-set evaluation)]
"Following training, predicted probabilities were converted into binary classifications by sweeping thresholds from 0.10 to 0.90 (in increments of 0.01). The threshold maximizing Cohen’s Kappa (McHugh, 2012) was selected ... The resulting model and tuned threshold were then fixed for all downstream ensemble predictions. ... Comparison between ensemble and base models based on the test set: the performance of the ensemble learner and base models with threshold selected for maximizing kappa (a) ..."
The paper describes a 70/30 train/test split but no validation split for threshold selection, and the reported metrics are explicitly 'based on the test set.' The decision threshold is therefore optimized on the same labels used to compute the headline Kappa, F1, and accuracy values. The ensemble's reported advantage over the base models is thus partly a function of fitting a threshold to the test set, rather than an out-of-sample prediction. Since no analogous threshold search is reported for the base models, the comparison is lopsided and the central claim 'the ensemble learner outperforms individual base models' is partially forced by the fitting procedure.
full rationale
The core evaluation is not wholly circular: the VLM outputs are zero-shot, the ground truth is an independent professional survey, and the XGBoost meta-learner is trained on a separate 70% split. However, one load-bearing step is a fitted input presented as a prediction: §3.3 sweeps thresholds and selects the value maximizing Cohen's Kappa, and §4.3 reports test-set metrics from that same threshold selection, with the figure caption explicitly stating the comparison is 'based on the test set.' This makes the ensemble's Kappa/F1/accuracy values in-sample optima of the decision threshold, and the comparison to base models is not controlled for threshold tuning. The paper also notes in §4.3 a 'slight drop in accuracy and F1-score compared to Gemma3,' which conflicts with the abstract's unqualified 'outperforms individual base models' claim; that is a consistency/correctness issue rather than a circularity issue. No self-citation chain, imported uniqueness theorem, or ansatz-by-citation was found; the weighted blight rubric is stated as coming from city assessor feedback, not from the model outputs. Overall, the central ensemble-advantage claim is partly circular because one of its reported performance metrics is optimized on the test data, but the underlying framework remains independently benchmarked against external annotations.
Axiom & Free-Parameter Ledger
free parameters (3)
- Blight score weights =
roof +3, opening +1.5, facade +4
- Decision threshold (Kappa) =
Selected per condition from 0.10-0.90 sweep to maximize test-set Kappa
- Decision threshold (F1) =
Selected per condition from 0.10-0.90 sweep to maximize test-set F1
axioms (4)
- domain assumption Professional DLBA annotations are accurate ground truth for roof, opening, and facade damage
- domain assumption Three street-view images per property provide sufficient visual coverage of the assessed conditions
- domain assumption The weighting of blight components (roof +3, opening +1.5, facade +4) reflects the construct of blight severity
- ad hoc to paper The 70/30 stratified split gives an unbiased evaluation when the threshold is selected on the test set
Cite this review
Pith. "Pith review of Can Urban Blight Be Accessed with Vision-language Models: A Case Study in Detroit." pith.science (2026). https://pith.science/paper/RT5YUIRH
@misc{pith2026260801753,
  author       = {Pith},
  title        = {Pith review of: Can Urban Blight Be Accessed with Vision-language Models: A Case Study in Detroit},
  year         = {2026},
  howpublished = {\url{https://pith.science/paper/RT5YUIRH}},
  note         = {Machine review of arXiv:2608.01753}
}
read the original abstract
Addressing urban blight has seen increased focus in the past 15 years. Assessing urban blight is essential for guiding urban planning, targeting rehabilitation, and safeguarding public health, yet traditional residential blight surveys are difficult to maintain at scale due to the labor-intensive cost and long-term cycle. This study introduced a scalable framework for estimating residential blight using open-source large vision-language models on multiple views. Structured prompts guided models to evaluate housing attributes, including roof integrity, wall damage, and broken or boarded openings, producing both binary assessments and probabilistic estimates of disrepair. To evaluate the performance of these visual assessments, we compared professional human annotations of these features across several models, including an ensemble stacking approach based on XGBoost and a weighted scoring system. Results showed that (i) multiple street views can contribute to the improvement of accuracy, (ii) large vision-language models have different strengths of inference, (iii) the ensemble learner outperforms individual base models, enhancing robustness across all residential conditions and blight assessment. The practical application of the method allows low-cost tracking and management of housing stock conditions, providing a regularly updatable complement to traditional blight surveys.
Figures


Reference graph
Works this paper leans on
-
[1]
Alam, F., Ofli, F., & Imran, M. (2018, June). Crisismmd: Multimodal twitter datasets from natural disasters. In Proceedings of the international AAAI conference on web and social media (V ol. 12, No. 1)
work page 2018
-
[2]
Atkinson, R. (2004). The evidence on the impact of gentrification: new lessons for the urban renaissance?. European journal of housing policy, 4(1), 107-131
work page 2004
-
[3]
Bai, S., Chen, K., Liu, X., Wang, J., Ge, W., Song, S., ... & Lin, J. (2025). Qwen2. 5-vl technical report. arXiv preprint arXiv:2502.13923. 16 Can Urban Blight Be Accessed with Vision-language Models?A PREPRINT
Pith/arXiv arXiv 2025
-
[4]
Beers, A., Daley, C., McLaughlin, I., & Pavlek, G. (2011). Quick guide: New tools to address blight and abandonment. Pennsylvania: The Housing Alliance of Pennsylvania
work page 2011
-
[5]
Bibri, S. E. (2019). On the sustainability of smart and smarter cities in the era of big data: an interdisciplinary and transdisciplinary literature review. Journal of Big Data, 6(1), 25
work page 2019
-
[6]
Bieri, V ., Zamboni, M., Blumer, N. S., Chen, Q., & Engelmann, F. (2025, February). Opencity3d: What do vision-language models know about urban environments?. In 2025 IEEE/CVF Winter Conference on Applications of Computer Vision (W ACV) (pp. 5147-5155). IEEE
work page 2025
-
[7]
Bonnefoy, X. (2007). Inadequate housing and health: an overview. International journal of environment and pollution, 30(3-4), 411-429
work page 2007
-
[8]
Board on Health Promotion, Disease Prevention, & Committee on Damp Indoor Spaces. (2004). Damp indoor spaces and health
work page 2004
-
[9]
Buckland, M., & Gey, F. (1994). The relationship between recall and precision. Journal of the American society for information science, 45(1), 12-19
work page 1994
-
[10]
Cao, J., Wang, H., Li, J., Tian, Q., & Niyogi, D. (2022). Improving the forecasting of winter wheat yields in Northern China with machine learning–dynamical hybrid subseasonal-to-seasonal ensemble prediction. Remote Sensing, 14(7), 1707
work page 2022
-
[11]
Chai, T., & Draxler, R. R. (2014). Root mean square error (RMSE) or mean absolute error (MAE). Geoscientific model development discussions, 7(1), 1525-1534
work page 2014
-
[12]
Chen, T., He, T., Benesty, M., & Khotilovich, V . (2019). Package ’xgboost’. R version, 90(1-66), 40
work page 2019
- [13]
-
[14]
Chen, Z., Li, J., Chen, P., Li, Z., Sun, K., Luo, Y ., ... & Yu, P. S. (2025). Harnessing multiple large language models: A survey on llm ensemble. arXiv preprint arXiv:2502.18036
Pith/arXiv arXiv 2025
-
[15]
Cho, D., Yoo, C., Im, J., Lee, Y ., & Lee, J. (2020). Improvement of spatial interpolation accuracy of daily maximum air temperature in urban areas using a stacking ensemble technique. GIScience & Remote Sensing, 57(5), 633-649
work page 2020
-
[16]
Detroit Land Bank Authority. (2025). City Council quarterly report: Q1 FY25. Detroit Land Bank Authority. https://dlba-production-bucket.s3.us-east- 2.amazonaws.com/City_Council_Quarterly_Report/DLBA+Q1+FY25+CCQR+FINAL.pdf
work page 2025
-
[17]
Dona, M. A. M., Cabrero-Daniel, B., Yu, Y ., & Berger, C. (2024). Evaluating and enhancing trustworthiness of LLMs in perception tasks. arXiv preprint arXiv:2408.01433. https://arxiv.org/abs/2408.01433
Pith/arXiv arXiv 2024
-
[18]
Erb-Downward, J., & Merchant, S. (2020). Losing home: Housing instability & availability in Detroit. Retrieved from Poverty Solutions website: https://poverty. umich. edu/files/2020/05/200358_Poverty- Solutions_Detroit-Housing-Instability-policy-brief_051120. Pdf
work page 2020
-
[19]
Feng, J., Du, Y ., Liu, T., Guo, S., Lin, Y ., & Li, Y . (2024). CityGPT: Empowering urban spatial cognition of large language models. arXiv preprint arXiv:2406.13948. https://arxiv.org/abs/2406.13948
Pith/arXiv arXiv 2024
-
[20]
Ghosh, S. M., Behera, M. D., Jagadish, B., Das, A. K., & Mishra, D. R. (2021). A novel approach for estimation of aboveground biomass of a carbon-rich mangrove site in India. Journal of Environmental Management, 292, 112816
work page 2021
-
[21]
E., Ruffley, M., & Exposito-Alonso, M
Gillespie, L. E., Ruffley, M., & Exposito-Alonso, M. (2024). Deep learning models map rapid plant species changes from citizen science and remote sensing data. Proceedings of the National Academy of Sciences, 121(37), e2318296121
work page 2024
-
[22]
Healey, S. P., Cohen, W. B., Yang, Z., Brewer, C. K., Brooks, E. B., Gorelick, N., ... & Zhu, Z. (2018). Mapping forest change using stacked generalization: An ensemble approach. Remote Sensing of Environment, 204, 717-728
work page 2018
-
[23]
Huang, Z., Qi, H., Kang, C., Su, Y ., & Liu, Y . (2020). An ensemble learning approach for urban land use mapping based on remote sensing imagery and social sensing data. Remote Sensing, 12(19), 3254
work page 2020
-
[24]
Jiang, Y ., Chao, Q., Chen, Y ., Li, X., Liu, S., & Cong, G. (2024). UrbanLLM: Autonomous ur- ban activity planning and management with large language models. arXiv preprint arXiv:2406.12360. https://arxiv.org/abs/2406.12360
work page internal anchor Pith review Pith/arXiv arXiv 2024
-
[25]
Jiang, Y ., & Sun, P. (2024). Does shrinkage have an impact on urban livability? An empirical analysis from Northeast China. Sustainable Cities and Society, 113, 105725. 17 Can Urban Blight Be Accessed with Vision-language Models?A PREPRINT
work page 2024
-
[26]
S., Reid, M., Matsuo, Y ., & Iwasawa, Y
Kojima, T., Gu, S. S., Reid, M., Matsuo, Y ., & Iwasawa, Y . (2022). Large language models are zero-shot reasoners. Advances in neural information processing systems, 35, 22199-22213
work page 2022
-
[27]
Lawrence, I., & Lin, K. (1989). A concordance correlation coefficient to evaluate reproducibility. Biometrics, 255-268
work page 1989
-
[28]
Li, Y ., & Long, Y . (2024). Inferring storefront vacancy using mobile sensing images and computer vision approaches. Computers, Environment and Urban Systems, 108, 102071
work page 2024
-
[29]
Li, Z., Xia, L., Tang, J., Xu, Y ., Shi, L., Xia, L., Yin, D., & Huang, C. (2024). UrbanGPT: Spatio-temporal large language models. In Proceedings of the 30th ACM SIGKDD Conference on Knowledge Discovery and Data Mining (pp. 5351–5362). Association for Computing Machinery. https://doi.org/10.1145/3637528.3671578
-
[30]
Liang, X., Brainerd, B., Hicks, T., & Andris, C. (2024). Lessons from a human-in-the-loop machine learning approach for identifying vacant, abandoned, and deteriorated properties in Savannah, Georgia. Journal of Planning Education and Research, 0739456X241273945
work page 2024
-
[31]
Liang, X., Xie, J., Zhao, T., Stouffs, R., & Biljecki, F. (2025). OpenFACADES: An Open Framework for Ar- chitectural Caption and Attribute Data Enrichment via Street View Imagery. arXiv preprint arXiv:2504.02866
arXiv 2025
-
[32]
Lv, L., Chen, T., Dou, J., & Plaza, A. (2022). A hybrid ensemble-based deep-learning framework for landslide susceptibility mapping. International Journal of Applied Earth Observation and Geoinformation, 108, 102713
work page 2022
-
[33]
Malekzadeh, M., Willberg, E., Torkko, J., & Toivonen, T. (2025). Urban attractiveness according to ChatGPT: Contrasting AI and human insights. Computers, Environment and Urban Systems, 117, 102243
work page 2025
-
[34]
McHugh, M. L. (2012). Interrater reliability: the kappa statistic. Biochemia medica, 22(3), 276-282
work page 2012
-
[35]
Mistral AI. (2025, March 17). Mistral Small 3.1. Mistral AI. https://mistral.ai/news/mistral-small-3-1
work page 2025
-
[36]
Neidert, L., Farley, R., & Morenoff, J. (2025). How Census Undercount Became a Civil Rights Issue and Why It Is Increasingly Important. RSF: The Russell Sage Foundation Journal of the Social Sciences, 11(1), 26–43
work page 2025
-
[37]
Niimi, J. (2025, July). A simple ensemble strategy for llm inference: Towards more stable text classification. In International Conference on Applications of Natural Language to Information Systems (pp. 189-199). Cham: Springer Nature Switzerland
work page 2025
-
[38]
Ochodo, C., Ndetei, D. M., Moturi, W. N., & Otieno, J. O. (2014). External built residential environment characteristics that affect mental health of adults. Journal of Urban Health, 91, 908-927
work page 2014
-
[39]
Peng, Q., Zhao, G., & Ye, X. (2025). Assessing the impact of maintenance condition on multifamily rents: an integrated approach of machine learning and hedonic modelling. Journal of Housing and the Built Environment, 1-18
work page 2025
-
[40]
J., Reeves, A., Baker, E., & Bentley, R
Pevalin, D. J., Reeves, A., Baker, E., & Bentley, R. (2017). The impact of persistent poor housing conditions on mental health: A longitudinal population-based study. Preventive medicine, 105, 304-310
work page 2017
-
[41]
Pinto, A. M., Ferreira, F. A., Spahr, R. W., Sunderman, M. A., Govindan, K., & Meidut˙e-Kavaliauskien˙e, I. (2021). Analyzing blight impacts on urban areas: A multi-criteria approach. Land Use Policy, 108, 105661
work page 2021
-
[42]
Pinto, B. M., Ferreira, F. A., Spahr, R. W., Sunderman, M. A., & Pereira, L. F. (2023). Analyzing causes of urban blight using cognitive mapping and DEMATEL. Annals of operations research, 325(2), 1083-1110
work page 2023
-
[43]
Ruggiero, R., Rivera, J., & Cooney, P. (2020). A decent home: The status of home repair in Detroit. Ann Arbor: Poverty Solutions University of Michigan
work page 2020
-
[44]
Sagi, O., & Rokach, L. (2018). Ensemble learning: A survey. Wiley interdisciplinary reviews: data mining and knowledge discovery, 8(4), e1249
work page 2018
-
[45]
Team, G., Kamath, A., Ferret, J., Pathak, S., Vieillard, N., Merhej, R., ... & Iqbal, S. (2025). Gemma 3 technical report. arXiv preprint arXiv:2503.19786
Pith/arXiv arXiv 2025
-
[46]
Ting, K. M., & Witten, I. H. (1999). Issues in stacked generalization. Journal of artificial intelligence research, 10, 271-289
work page 1999
-
[47]
Trevethan, R. (2017). Sensitivity, specificity, and predictive values: foundations, pliabilities, and pitfalls in research and practice. Frontiers in public health, 5, 307
work page 2017
-
[48]
American Community Survey 2018 1-year estimates [Dataset and codebook]
US Bureau of the Census (2018). American Community Survey 2018 1-year estimates [Dataset and codebook]. Retrieved from https://censusreporter.org/profiles/16000US2622000-detroit-mi/
work page 2018
-
[49]
U.S. Congress. (2021). Exploring How Community Development Financial Institutions Support Underserved Communities: Hearing Before the Committee on Banking, Housing, and Urban Affairs, United States Senate, One Hundred Seventeenth Congress, First Session. U.S. Senate Committee on Banking, Housing, and Urban Affairs. 18 Can Urban Blight Be Accessed with Vis...
work page 2021
-
[50]
Verma, D., Mumm, O., & Carlow, V . M. (2023). Generative agents in the streets: Exploring the use of large language models (LLMs) in collecting urban perceptions. arXiv preprint arXiv:2312.13126. https://arxiv.org/abs/2312.13126
arXiv 2023
-
[51]
tidycensus: Load US Census Boundary and Attribute Data as ’tidyverse’ and ’sf’-Ready Data Frames
Walker K, Herman M (2025). tidycensus: Load US Census Boundary and Attribute Data as ’tidyverse’ and ’sf’-Ready Data Frames. R package version 1.7.1, https://walker-data.com/tidycensus/
work page 2025
-
[52]
Wang, Z., Majumdar, A., & Rajagopal, R. (2023). Geospatial mapping of distribution grid with machine learning and publicly-accessible multi-modal data. Nature Communications, 14(1), 5006
work page 2023
-
[53]
& Zhou, D
Wei, J., Wang, X., Schuurmans, D., Bosma, M., Xia, F., Chi, E., ... & Zhou, D. (2022). Chain-of-thought prompting elicits reasoning in large language models. Advances in neural information processing systems, 35, 24824-24837
2022
-
[54]
Wolpert, D. H. (1992). Stacked generalization. Neural networks, 5(2), 241-259
work page 1992
-
[55]
Wolpert, D. H., & Macready, W. G. (2002). No free lunch theorems for optimization. IEEE transactions on evolutionary computation, 1(1), 67-82
work page 2002
-
[56]
Yan, Y ., Wen, H., Zhong, S., Chen, W., Chen, H., Wen, Q., Zimmermann, R., & Liang, Y . (2024). UrbanCLIP: Learning text-enhanced urban region profiling with contrastive language-image pretraining from the web. In Proceedings of the ACM Web Conference 2024 (pp. 4006–4017). Association for Computing Machinery. https://doi.org/10.1145/3589334.3645378
arXiv 2024
-
[57]
Yan, Y ., Zeng, Q., Zheng, Z., Yuan, J., Feng, J., Zhang, J., Xu, F., & Li, Y . (2024). OpenCity: A scal- able platform to simulate urban activities with massive LLM agents. arXiv preprint arXiv:2410.21286. https://arxiv.org/abs/2410.21286
Pith/arXiv arXiv 2024
-
[58]
Yang, Y ., & Liu, X. (1999, August). A re-examination of text categorization methods. In Proceedings of the 22nd annual international ACM SIGIR conference on Research and development in information retrieval (pp. 42-49)
work page 1999
-
[59]
Yue, X., Wang, Y ., Zhao, Y ., & Zhang, H. (2022). Estimation of urban housing vacancy based on daytime housing exterior images–a case study of Guangzhou in China. ISPRS International Journal of Geo-Information, 11(6), 349
work page 2022
-
[60]
Zeng, T., Wu, L., Peduto, D., Glade, T., Hayakawa, Y . S., & Yin, K. (2023). Ensemble learning framework for landslide susceptibility mapping: Different basic classifier and ensemble strategy. Geoscience Frontiers, 14(6), 101645
work page 2023
-
[61]
Zhang, Y ., Liu, J., & Shen, W. (2022). A review of ensemble learning algorithms used in remote sensing applications. Applied Sciences, 12(17), 8654
work page 2022
-
[62]
Zhou, Z. H. (2025). Ensemble methods: foundations and algorithms. CRC press
work page 2025
-
[63]
Zou, S., & Wang, L. (2022). Mapping individual abandoned houses across cities by integrating VHR remote sensing and street view imagery. International Journal of Applied Earth Observation and Geoinformation, 113, 103018. 19
work page 2022
This paper was first reviewed by deepseek-v4-flash on August 4, 2026.
discussion (0)
Sign in with ORCID, Apple, or X to comment. Anyone can read and Pith papers without signing in.