REVIEW 3 major objections 4 minor 55 references
GenGA: Editable and Data-Grounded Graphical Abstract Generation for Academic Papers
T0 review · 3 major / 4 minor · reviewed 2026-08-08 · deepseek-v4-flash
Pith's one-line read This paper claims graphical abstracts should be generated as editable vector graphics, and that a new score—SIC—can measure how easy a figure is to edit.
desk verdict A well-built vector GA generation system with a plausible editability metric, but the headline SIC comparison across vector and raster formats is apples-to-oranges and needs a vectorized human control before the central claim can stand. read the letter →
The pith
A machine-rendered reading of the paper's core claim, the machinery that carries it, and where it could break.
The reading
What carries the argument
The load-bearing innovation is the Structural Independence Coefficient (SIC), a number in [0,1] computed by modeling a figure as a weighted complete graph of visual elements, activating each edge with probability equal to its dependency weight, and taking one minus the expected fraction of other elements connected to a randomly chosen edited element. In the vector instantiation, edges exist only where the SVG has explicit grouping, shared transforms, or clipping, so ungrouped elements are independent by definition; in the raster instantiation, elements come from Felzenszwalb segmentation and edge weights decay exponentially with boundary strength. SIC is what lets the paper call editability a measurable quantity, and what the GenGA framework is designed to maximize by emitting hierarchical, non-overlapping, semantically tagged SVG groups.
What would settle it
Run a blind editing study in which participants receive two visually identical figures, one a GenGA SVG and one a raster abstract whose SIC is equal under the raster formula, and must perform the same eight edits in draw.io; if editing time and success rate do not differ, SIC is not capturing practical editing cost. A second decisive test would give two figures with identical SIC but different perceptual grouping and check whether edit time tracks SIC or grouping.
Extended reading notes
Core claim
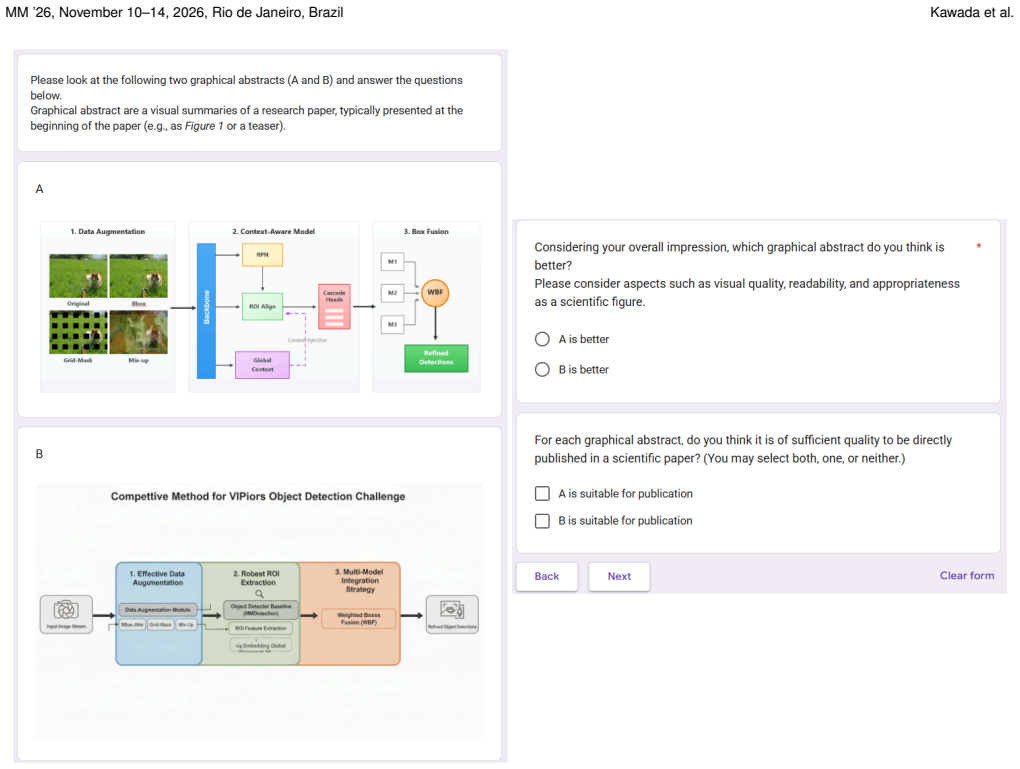
The central claim is that editable GA generation is a well-defined task—producing a vector representation of a graphical abstract with explicit hierarchy and geometry metadata—and that GenGA solves it by combining four stages: semantic retrieval of a reference GA, vectorization of that reference into layout guidance, asset-aware generation that treats user-supplied images as fixed placeholders rather than generative targets, and a self-correction loop that iteratively improves semantic alignment and layout. Alongside the framework, the paper proposes SIC, computed from a weighted dependency graph of figure elements, as a metric of editing simplicity. In the evaluation, GenGA with the Gemini backbone reaches SIC 0.943 while human-authored GAs sit at 0.119 and raster-generation baselines stay below 0.19; GenGA also beats human-authored GAs on CLIP-S semantic alignment and contribution-QA accuracy, and wins 76.7 percent of pairwise user preferences with a 66.7 percent publishable rate. The authors read these results as evidence that editability and grounding in real data can be achieved without sacrificing visual quality.
Load-bearing premise
The editability comparison rests on the assumption that SIC computed from explicit SVG grouping (where any ungrouped element is independent by definition) measures the same quantity as SIC computed from raster segmentation, so the headline vector-versus-raster numbers can be directly compared.
Editorial extensions
If this is right
- Graphical abstract generation is repositioned as a structural editing problem: the output is a set of named, grouped SVG elements that any common drawing tool can open and modify.
- SIC gives a concrete, automatable target for editability, so future systems can optimise or filter generated figures by predicted editing cost.
- Treating user-provided assets as fixed placeholder slots prevents the model from hallucinating or distorting real experimental data during generation.
- The self-correction loop shows measurable gains in semantic alignment, readability, and conciseness across iterations, converging after about four passes.
- Because vector SVGs can be rasterised for review and re-edited afterwards, the same figure can be automatically improved and still manually refined.
Reading between the lines
- SIC is not limited to graphical abstracts: any figure format—posters, diagrams, dashboards—could be scored with the same dependency-graph recipe, giving a general 'edit costs' metric for structured graphics.
- The paper validates SIC by correlation with human edit time, but a stronger test would use SIC as a reward signal during generation; nothing in the framework prevents adding that optimisation loop.
- The headline editability comparison mixes representations: vector SIC counts only explicit SVG grouping, while raster SIC infers elements from segmentation, so the two scores are not obviously measuring the same quantity across formats.
- The method's dependence on proprietary vision-language models, which the paper names as a limitation, means a useful next step is distilling the pipeline into smaller open models that researchers could run locally on confidential papers.
Signed reviews
Editorial analysis
A structured set of objections, weighed in public.
Referee Report
Summary. The paper introduces Editable GA Generation, a task in which graphical abstracts are produced as structured, editable vector graphics rather than raster images. It proposes GenGA, a VLM-based pipeline with reference retrieval, raster-to-SVG reference vectorization, asset-aware SVG generation using placeholder constraints for user-provided images, and a self-correction loop. It also defines the Structural Independence Coefficient (SIC), a graph-based metric intended to measure editing simplicity. The evaluation uses 2,053 test papers from SciGA-145k; GenGA is compared with author-created GAs, NanoBanana-Pro, PaperBanana, and AutoFigure, including vectorized versions of the raster baselines. The paper reports higher SIC, competitive or higher CLIP-S and contribution QA accuracy, and strong user preference for GenGA.
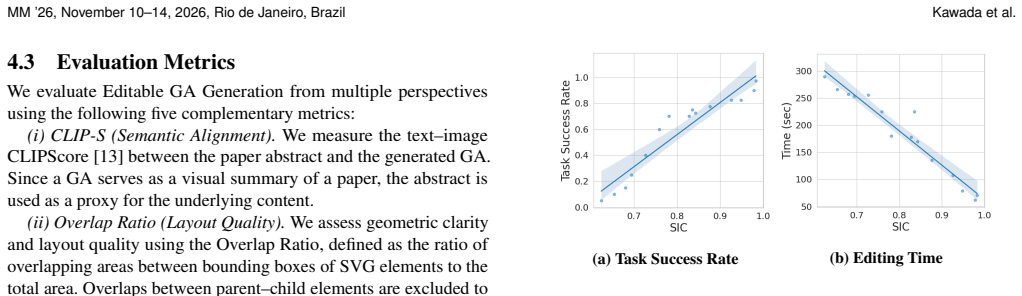
Significance. If the cross-format SIC claim were established, the paper would be a useful step: it reframes GA generation as an editable structure-generation problem, provides a concrete vector-generation framework with detailed prompts, and introduces a metric for editing simplicity. The paper's strengths include a pipeline that preserves user-provided data as immutable assets, an unusually detailed supplementary prompt section, and a user study with 15 experienced researchers in which editing time and success rate correlate strongly with SIC (Figure 3). The central quantitative claim, however, rests on comparing SIC values computed with different instantiations of the metric, so the current evidence does not yet support the statement that GenGA surpasses human-authored GAs in editing simplicity.
major comments (3)
- [Section 3.2, Eqs. (2)-(4); Table 2] SIC is instantiated differently for vector and raster figures, so the headline comparison in Table 2 is not apples-to-apples. In the vector instantiation, w_jk=1 only when elements share explicit grouping, transforms, or clipping; in the raster instantiation, nodes are segmentation regions and w_jk=exp(-b_jk). A human-authored GA, when rasterized and segmented, will typically have many weakly bounded regions and hence low SIC, but this does not mean it is harder to edit once opened in a vector editor. The authors vectorized NanoBanana-Pro and PaperBanana outputs before computing SIC, but did not apply the same vectorization to author-created GAs. The claim that GenGA 'surpasses human-authored GAs' in editing simplicity therefore requires either a vectorized human control or a careful argument that the two instantiations measure the same construct. Without this, the 0.885-0.943 vs. 0.119 comparison in Table 2 could be an artifact of format rather than of editing quality.
- [Section 4.4, Figure 3] The manual-editing user study does not isolate SIC from representation. Participants were given 'visually identical figures that differ in SIC due to representation and structural complexity' (Section 4.4), so the observed correlation between SIC and editing time/success may be driven by the vector-vs-raster dichotomy rather than by the SIC value itself. As a validation of SIC as an editing-cost proxy, the experiment should vary structural independence within a fixed representation (e.g., different grouping or edge structure in otherwise matched SVGs), or report the correlation separately for vector and raster figures. As written, Figure 3 supports the statement that vector figures with high SIC are easier to edit than raster figures with low SIC, which is a weaker and less interesting claim.
- [Section 3.2, vector instantiation; Prompt 2] The binary edge definition makes SIC highly sensitive to the authoring style of the SVG rather than to the perceptual independence of elements. For example, if the generator places two visually separate but spatially aligned elements in the same <g> for convenience, they receive w_jk=1, lowering SIC; if the same layout is emitted with separate groups, SIC increases. The paper does not quantify this sensitivity, and the generator prompt (Prompt 2) explicitly enforces nested grouping, so the reported SIC values partly measure compliance with the prompt. A robustness analysis or a comparison with an independent re-grouping of the same figures is needed before SIC can be claimed as a general measure of editing cost.
minor comments (4)
- [Section 6] The conclusion contains a broken sentence: 'This work establishes GA generation a foundation for grounded in real research workflows'; please revise.
- [Figure 3] Please report the number of data points and whether the 15 participants are treated as repeated measures; the reported p-values (<10^-7, <10^-8) assume independence, which is not justified for 15 participants contributing multiple editing tasks.
- [Table 4] Several rows without the self-correction loop achieve higher SIC (e.g., 0.948-0.959) than the full model (0.943), yet the text says the full model gives the best overall performance; please clarify this trade-off and state explicitly that the full model does not maximize SIC.
- [Table 2, Overlap Ratio] GenGA's Overlap Ratio (0.146/0.163) is comparable to the vectorized raster baselines (0.164/0.169) and much higher than AutoFigure's 0.000, but the text explains this as intentional layout design. Since Overlap Ratio is defined as a layout-quality metric, please provide evidence (e.g., a breakdown excluding parent-child overlap) that the overlaps are benign.
Circularity Check
No significant circularity: GenGA's generation pipeline is not a reduction to its inputs, and SIC has independent human-editing validation; the cross-format SIC comparison is a validity limitation rather than a circular step.
full rationale
GenGA's derivation chain is self-contained. The generation pipeline (full text and assets into SVG via retrieval, vectorization, asset-aware generation, and self-correction) does not fit any parameter to the headline evaluation metrics, and the claimed outputs do not reduce by construction to the inputs. SIC is introduced in Section 3.2 as a definitional metric, but it is not fitted to GenGA's outputs; it is independently validated in Section 4.4 and Figure 3 against human editing time and success rate with strong correlations (r=0.950 and r=-0.967). No equation in the paper makes the headline editability result equivalent to the input by construction. The vector/raster asymmetry in SIC's edge instantiations (binary structural-relationship edges for vector graphics vs. exp(-boundary-strength) edges for raster graphics) raises a measurement-equivalence concern for the Table 2 comparison between vector-format GenGA and raster human-authored GAs, but this is a validity limitation, not a logical circularity. Self-citations to SciGA-145k and Long-CLIP-4-Inter-GA-Rec are component reuse for dataset construction and retrieval, and are not load-bearing justifications of the central claim. Thus, under the required evidence standard, no circular step is established.
Assumptions & free parameters
free parameters (2)
- Self-correction iterations N_t =
4
- Minimum asset region size threshold =
unstated
assumptions (5)
- domain assumption An SVG with explicit primitive elements and no shared structural constraints is a faithful proxy for editability in drawing tools.
- domain assumption Raster editability can be approximated by Felzenszwalb segmentation regions and Sobel boundary strengths.
- domain assumption GPT-5.2 and Gemini VLM judgments are valid measures of faithfulness, conciseness, readability, and aesthetics.
- domain assumption The retrieval model returns semantically relevant GAs that serve as good structural references.
- domain assumption Bernoulli edge activations with transitive connected components model real edit propagation.
invented entities (1)
-
Structural Independence Coefficient (SIC)
independent evidence
Cite this review
Pith. "Pith review of GenGA: Editable and Data-Grounded Graphical Abstract Generation for Academic Papers." pith.science (2026). https://pith.science/paper/CZSUSO3Q
@misc{pith2026260805478,
  author       = {Pith},
  title        = {Pith review of: GenGA: Editable and Data-Grounded Graphical Abstract Generation for Academic Papers},
  year         = {2026},
  howpublished = {\url{https://pith.science/paper/CZSUSO3Q}},
  note         = {Machine review of arXiv:2608.05478}
}
read the original abstract
Graphical Abstracts (GAs) visually summarize the key findings of academic papers, playing a crucial role in facilitating the understanding of research content. Recently, advancements in vision-language models and image generation models have enabled the automatic generation of scientific figures based on paper content. However, most conventional methods output the generated results as raster graphics, making post-editing (e.g., text modification and layout changes) highly difficult. This poses a significant challenge, as they are unsuitable for the iterative figure revision process inherent in paper writing and peer review. To tackle these challenges, we define the novel task of generating editable GAs from paper content and propose GenGA, a new GA generation framework that directly produces figures in vector format. By generating figures as a collection of vector elements with a hierarchical structure, GenGA produces outputs that can be seamlessly imported into existing drawing tools for intuitive, element-level editing. Furthermore, we introduce the Structural Independence Coefficient (SIC), a metric that quantifies the editing simplicity of a figure based on the degree to which local modifications propagate to other elements. Experimental results show that GenGA achieves superior editing simplicity compared to conventional methods, and even surpasses human-authored GAs in conciseness and semantic alignment. We also validate SIC as an effective metric correlated with manual editing costs. This study fundamentally redefines GA generation as an editable vector graphic generation problem grounded in the practical workflows of researchers, significantly promoting effective scientific communication.
Figures


Figures from the paper (8 more)


Reference graph
Works this paper leans on
-
[1]
Jinheon Baek, Sujay Kumar Jauhar, Silviu Cucerzan, and Sung Ju Hwang. 2025. ResearchAgent: Iterative Research Idea Generation over Scientific Literature with Large Language Models. InNAACL
work page 2025
-
[2]
Jonas Belouadi, Anne Lauscher, and Steffen Eger. 2024. Automatikz: Text- guided synthesis of scientific vector graphics with tikz. InICLR
work page 2024
-
[3]
Jonas Belouadi, Simone P Ponzetto, and Steffen Eger. 2024. Detikzify: Syn- thesizing graphics programs for scientific figures and sketches with tikz. In NeurIPS
work page 2024
-
[4]
Hunter Bennett and Flynn Slattery. 2023. Graphical abstracts are associated with greater Altmetric attention scores, but not citations, in sport science.Scien- tometrics, 128, 3793–3804
work page 2023
-
[5]
Ralph Allan Bradley and Milton E. Terry. 1952. Rank Analysis of Incomplete Block Designs: I. The Method of Paired Comparisons.Biometrika, 39, 3/4, 324–345
work page 1952
-
[6]
Bruce G. Buchanan and Edward A. Feigenbaum. 1978. Dendral and Meta- Dendral: Their Applications Dimension.Artificial Intelligence, 11, 1, 5–12
work page 1978
-
[7]
S. J. Chapman, R. C. Grossman, M. E. B. FitzPatrick, and R. R. W. Brady
-
[8]
Arpad E. Elo. 1978.The Rating of Chessplayers, Past and Present. Arco Pub- lishing, New York
work page 1978
Show all 55 references
-
[9]
Pedro F Felzenszwalb and Daniel P Huttenlocher. 2004. Efficient Graph-Based Image Segmentation.Int. J. Comput. Vis., 59, 2, 167–181
2004
-
[10]
Tsu-Jui Fu, William Yang Wang, Daniel McDuff, and Yale Song. 2022. DOC2PPT: Automatic Presentation Slides Generation from Scientific Documents. InAAAI
2022
-
[11]
Google. 2025. Gemini-3. https://ai.google.dev/gemini- api/docs/gemini- 3. (2025)
2025
-
[12]
Google. 2025. NanoBanana-Pro. https://ai.google.dev/gemini-api/docs/image-g eneration. (2025)
2025
-
[13]
Jack Hessel, Ari Holtzman, Maxwell Forbes, Ronan Le Bras, and Yejin Choi
-
[14]
Hoffberg, Joe Huggins, Audrey Cobb, Jeri E
Adam S. Hoffberg, Joe Huggins, Audrey Cobb, Jeri E. Forster, and Nazanin H. Bahraini. 2020. Beyond Journals—Visual Abstracts Promote Wider Suicide Prevention Research Dissemination and Engagement: A Randomized Crossover Trial.Frontiers in Research Metrics and Analytics, 5
2020
-
[15]
Martin, Calvin H
Simon Huang, Lynsey J. Martin, Calvin H. Yeh, Alvin Chin, Heather Murray, William B. Sanderson, Rohit Mohindra, Teresa M. Chan, and Brent Thoma
-
[16]
Siyuan Huang et al. 2026. SciFig: Towards Automating Scientific Figure Gener- ation.arXiv preprint arXiv:2601.04390
2026 arXiv
-
[17]
Ibrahim, Keith D
Andrew M. Ibrahim, Keith D. Lillemoe, Mary E. Klingensmith, and Justin B. Dimick. 2017. Visual Abstracts to Disseminate Research on Social Media A Prospective, Case-control Crossover Study.Annals of Surgery, 266, 6, 46–48
2017
-
[18]
Ajay Jain, Amber Xie, and Pieter Abbeel. 2023. Vectorfusion: text-to-svg by abstracting pixel-based diffusion models. InCVPR
2023
-
[19]
Madhan Jeyaraman, Harish V . K. Ratna, Naveen Jeyaraman, Nicola Maffulli, Filippo Migliorini, Arulkumar Nallakumarasamy, and Sankalp Yadav. 2023. Graphical Abstract in Scientific Research.Cureus, 15, 9
2023
-
[20]
Madhan Jeyaraman and Raju Vaishya. 2023. Attract readers with a graphical abstract – The latest clickbait. Journal of Orthopaedics.Journal of Orthopaedics, 38, 1, 30–31
2023
-
[21]
Takuro Kawada, Shunsuke Kitada, Sota Nemoto, and Hitoshi Iyatomi. 2026. SciGA: A Comprehensive Dataset for Designing Graphical Abstracts in Aca- demic Papers. InFindings of CVPR
2026
-
[22]
Yohan Kim, Ji-Eun Lee, Jeong-Ju Yoo, Eun-Ae Jung, Sang Gyune Kim, and Young Seok Kim. 2022. Seeing Is Believing: The Effect of Graphical Abstracts on Citations and Social Media Exposure in Gastroenterology & Hepatology Journals.Journal of Korean Medical Science, 37
2022
-
[23]
Krukowski and Carly M
Rebecca A. Krukowski and Carly M. Goldstein. 2023. The potential for graph- ical abstracts to enhance science communication.Transl Behav Med, 13, 12, 891–895
2023
-
[24]
Kunze, Amar Vadhera, Ritika Purbeyc, Harsh Singh, Gregory S
Kyle N. Kunze, Amar Vadhera, Ritika Purbeyc, Harsh Singh, Gregory S. Kazar- ian, and Jorge Chahla. 2021. Infographics are more effective at increasing social media attention in comparison with original research articles: an altmetrics- based analysis.Canadian Journal of Emerge...
2021
-
[25]
Jieun Lee and Jeong-Ju Yoo. 2023. The current state of graphical abstracts and how to create good graphical abstracts.Science Editing, 10, 1, 19–26
2023
-
[26]
Douglas B. Lenat. 1977. Automated Theory Formation in Mathematics. In IJCAI
1977
-
[27]
Lenat and John Seely Brown
Douglas B. Lenat and John Seely Brown. 1983. Why am and eurisko appear to work. InAAAI
1983
-
[28]
Zhen Lin et al. 2026. Autofigure-edit: generating editable scientific illustration. (2026)
2026
-
[29]
Chris Lu, Cong Lu, Robert Tjarko Lange, Jakob Foerster, Jeff Clune, and David Ha. 2024. The AI Scientist: Towards Fully Automated Open-Ended Scientific Discovery.arXiv preprint arXiv:2408.06292
2024 arXiv
-
[30]
Lennart Meincke, Karan Girotra, Gideon Nave, Christian Terwiesch, and Karl T. Ulrich. 2023. Using Large Language Models for Idea Generation in Innovation. SSRN Electronic Journal
2023
-
[31]
Schoenholz, Muratahan Aykol, Gowoon Cheon, and Ekin Dogus Cubuk
Amil Merchant, Simon Batzner, Samuel S. Schoenholz, Muratahan Aykol, Gowoon Cheon, and Ekin Dogus Cubuk. 2023. Scaling deep learning for mate- rials discovery.Nature, 624, 80–85
2023
-
[32]
Beverley C Millar and Michelle Lim. 2022. The Role of Visual Abstracts in the Dissemination of Medical Research.Ulster Medical Journal, 91, 2, 67–78
2022
-
[33]
OpenAI. 2025. GPT-5. https://platform.openai.com/docs/models/gpt-5. (2025)
2025
-
[34]
OpenAI. 2025. GPT-Image. https://developers.openai.com/api/docs/models/gpt- image-1.5. (2025)
2025
-
[35]
Wei Pang, Kevin Qinghong Lin, Xiangru Jian, Xi He, and Philip Torr. 2025. Paper2Poster: Towards Multimodal Poster Automation from Scientific Papers. InNeurIPS Dataset and Benchmark Track
2025
-
[36]
Pyzer-Knapp, Jed W
Edward O. Pyzer-Knapp, Jed W. Pitera, Peter W. J. Staar, Seiji Takeda, Teodoro Laino, Daniel P. Sanders, James Sexton, John R. Smith, and Alessandro Curi- oni. 2022. Accelerating materials discovery using artificial intelligence, high performance computing and robotics.npj Com...
2022
-
[37]
Nils Reimers and Iryna Gurevych. 2019. Sentence-BERT: Sentence Embeddings using Siamese BERT-Networks. InEMNLP
2019
-
[38]
Juan A Rodriguez, Abhay Puri, Shubham Agarwal, Issam H Laradji, Pau Ro- driguez, Sai Rajeswar, David Vazquez, Christopher Pal, and Marco Pedersoli
-
[39]
Rodriguez, David Vazquez, Issam Laradji, Marco Pedersoli, and Pau Rodriguez
Juan A. Rodriguez, David Vazquez, Issam Laradji, Marco Pedersoli, and Pau Rodriguez. 2023. FigGen: Text to Scientific Figure Generation. InICLR
2023
-
[40]
Robin Rombach, Andreas Blattmann, Dominik Lorenz, Patrick Esser, and Björn Ommer. 2022. High-resolution Image Synthesis with Latent Diffusion Models. InCVPR
2022
-
[41]
Tomoyuki Suzuki, Kang-Jun Liu, Naoto Inoue, and Kota Yamaguchi. 2025. LayerD: Decomposing Raster Graphic Designs into Layers. InICCV
2025
-
[42]
Szymanski et al
Nathan J. Szymanski et al. 2023. An autonomous laboratory for the accelerated synthesis of novel materials.Nature, 624, 86–91
2023
-
[43]
Zihang Wang, Yilun Zhao, Kaiyan Zhang, Chen Zhao, Manasi Patwardhan, and Arman Cohan. 2025. SciSketch: An Open-source Framework for Automated Schematic Diagram Generation in Scientific Papers. InEMNLP
2025
-
[44]
Jingxuan Wei, Cheng Tan, Qi Chen, Gaowei Wu, Siyuan Li, Zhangyang Gao, Linzhuang Sun, Bihui Yu, and Ruifeng Guo. 2025. From Words to Structured Visuals: A Benchmark and Framework for Text-to-Diagram Generation and Editing. InCVPR
2025
-
[45]
Haomin Wen, Zhenjie Wei, Yan Lin, Jiyuan Wang, Yuxuan Liang, and Huaiyu Wan. 2024. OverleafCopilot: Empowering Academic Writing in Overleaf with Large Language Models.arXiv preprint arXiv:2403.09733
2024 arXiv
-
[46]
Yiying Yang et al. 2025. OmniSVG: A Unified Scalable Vector Graphics Gener- ation Model. InNeurIPS
2025
-
[47]
Ma Yuanyuan and Jiang Kevin. 2023. Verbal and visual resources in graphi- cal abstracts: Analyzing patterns of knowledge presentation in digital genres. Ibérica, 46, 129–154
2023
-
[48]
Dawei Zhu, Rui Meng, Yale Song, Xiyu Wei, Sujian Li, Tomas Pfister, and Jin- sung Yoon. 2026. Paperbanana: automating academic illustration for ai scientists. arXiv preprint arXiv:2601.23265
2026
-
[49]
{W}" height=
Minjun Zhu, Zhen Lin, Yixuan Weng, Panzhong Lu, Qiujie Xie, Yifan Wei, Sifan Liu, QiYao Sun, and Yue Zhang. 2026. Autofigure: generating and refining publication-ready scientific illustrations. InICLR. 9 MM ’26, November 10–14, 2026, Rio de Janeiro, Brazil Kawada et al. GenGA:...
-
[531]
exclusive
geom-policy="exclusive" 54- This element must NOT overlap with other 'exclusive' elements at the same hierarchy level. 55- Used for structural layout blocks
-
[562]
placeholder
geom-policy="overlay" 57- This element MAY overlap other elements at the same hierarchy level. 58- It must still remain inside its parent bounds. 59- Used for connectors, arrows, or minor annotations. 60 61## TEXT ELEMENT RULES 62- Use short labels only. 63- Avoid full sentenc...
-
[2018]
The effect of an infographic promotion on research dissemination and readership: a randomized controlled trial.Canadian Journal of Emergency Medicine, 20, 6, 826–833
-
[2019]
Randomized controlled trial of plain English and visual abstracts for disseminating surgical research via social media.British Journal of Surgery, 106, 12, 1611–1616
-
[2021]
CLIPScore: A Reference-free Evaluation Metric for Image Captioning. InEMNLP
-
[2025]
Starvector: Generating scalable vector graphics code from images and text. InCVPR
Reviewed August 8, 2026 · model on record in the stance chip above.
Discussion (0). Continue with ORCID to comment.