REVIEW 3 major objections 6 minor 28 references
ElectroLens: Understanding Atomistic Simulations Through Spatially-resolved Visualization of High-dimensional Features
T0 review · 3 major / 6 minor · reviewed 2026-08-14 · deepseek-v4-flash
Pith's one-line read ElectroLens links high-dimensional ML features to atoms and electron clouds in 3D, enabling visual diagnosis of model failures.
desk verdict A solid, well-written tool paper that fills a real gap in linking ML features to 3D atomistic structure; the main caveat is an under-specified point-cloud sampling that should be clarified before the linking claim is taken at face value. read the letter →
The pith
A machine-rendered reading of the paper's core claim, the machinery that carries it, and where it could break.
The reading
What carries the argument
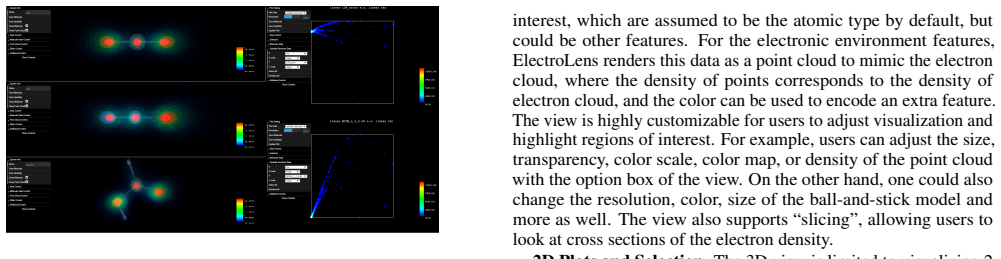
The load-bearing mechanism is the linked-view selection: all data points are stored once and shared among the 3D views and 2D plots, so selecting a region in any scatter, correlation, or PCA plot immediately highlights the same points in Cartesian space. The 3D view represents electronic environments as a point cloud whose density mimics electron density and whose color encodes an extra feature, alongside ball-and-stick atom models; irregular atomic grids and regular electron-density grids can appear together. This shared-data linking turns the high-dimensional feature space into a spatial map that a chemist can interpret.
What would settle it
A controlled experiment in which chemists use ElectroLens on the same exchange-correlation failure would settle the utility claim: if they identify the C, N, and O core regions no faster or less accurately than chemists using existing molecular viewers and manual feature inspection, the central contribution is weakened. The scalability claim is directly testable by loading a one-million-point dataset on a commodity laptop and measuring whether rendering stays at 60 frames per second.
Extended reading notes
Core claim
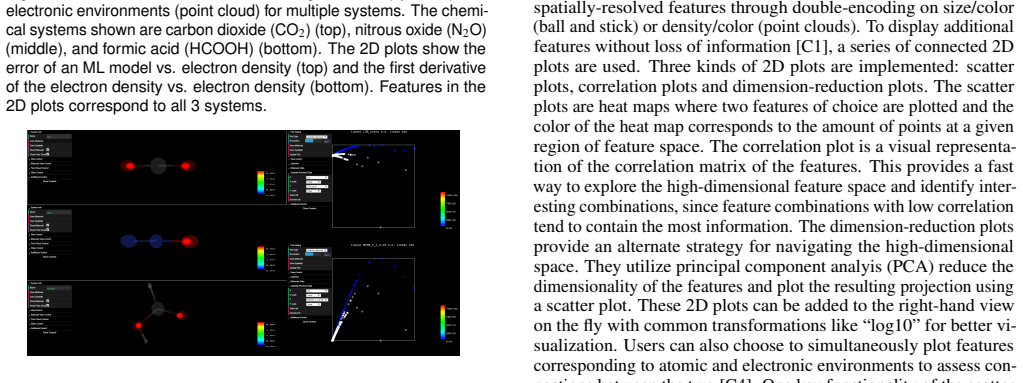
On the paper's own terms, the discovery is that spatially-resolved high-dimensional features can be coupled to Cartesian space through interactive selection, so that a cluster in feature space maps to a chemically meaningful region such as a C-N bond or an oxygen core. ElectroLens renders electron density as a point cloud, atoms as ball-and-stick models, and additional features as linked scatter, correlation, and PCA plots; selecting in any 2D plot highlights the same data points in all views and in 3D. In the first case study, plotting neural-network prediction error against electron density gives a multi-valued distribution with three tails, and selecting those tails highlights the C, N, and O core regions of CO2, N2O, and HCOOH. That observation explains the model's failure and motivates a new model based on density and its derivative. In the second case study, coloring atoms by force magnitude identifies out-of-distribution atomic configurations that produce erroneous forces, and plotting symmetry-function features in 2D locates unsampled regions of feature space. The paper's claim is that these diagnoses are made possible by the visual link between feature space and real space.
Load-bearing premise
The central utility claim—that linking feature plots to 3D regions meaningfully improves model diagnosis and feature engineering—rests on two self-reported case studies of the authors' own ML models, with no controlled user study or comparison against existing tools.
Editorial extensions
If this is right
- Researchers can diagnose ML model failures by adding prediction error as a feature and selecting anomalous tails to locate the chemical environments responsible.
- Feature engineering becomes hypothesis-driven: plotting candidate descriptors against each other and linking back to 3D can reveal whether a descriptor separates chemically distinct regions, as the density derivative separates C, N, and O cores.
- Multiple systems can be compared in one session, letting users check whether a feature-to-chemistry correspondence found in one molecule generalizes to others.
- Because atom positions and electron-density grids are shown together, the tool exposes relationships between atomic and electronic structure that separate views hide.
- Interactive rendering at 60 frames per second over a million points makes the approach usable on real ML training datasets rather than toy examples.
Reading between the lines
- If the linking mechanism is as effective as the case studies suggest, the same design could apply to other spatially-resolved high-dimensional data, such as materials interfaces or medical imaging, though the paper does not test those domains.
- A controlled user study comparing time-to-insight and accuracy against existing molecular viewers would be the natural way to test the central utility claim; the paper reports only self-reported case studies.
- The correlation plot could be extended into an automatic feature-pair recommender, but the paper leaves that as future work.
Signed reviews
Editorial analysis
A structured set of objections, weighed in public.
Referee Report
Summary. The paper presents ElectroLens, a new visualization tool for exploring high-dimensional, spatially-resolved feature vectors that arise in atomistic simulations and electron-density calculations. The tool combines a 3D point-cloud view of the chemical system with linked 2D scatter plots, correlation plots, and PCA-based dimension-reduction plots, allowing users to select feature ranges in 2D and see the corresponding atoms or electron-density regions highlighted in 3D. The design is motivated by six challenges, and two case studies are presented: diagnosing a neural-network exchange-correlation model and assessing a machine-learned force field. The paper claims scalability to over one million data points at 60 FPS and provides an open-source desktop application with Python/ASE bindings.
Significance. If the linking and scalability claims hold, ElectroLens addresses a genuine gap in the machine-learning-for-chemistry workflow by providing a direct visual route from abstract descriptor values to the chemical regions they encode. The tool is open source, integrates with ASE, and the two case studies demonstrate tasks that are plausibly useful in practice. However, the central utility claim rests on self-reported, anecdotal evidence, and the fidelity of the linking mechanism is under-specified. The paper introduces no new algorithms or theory, but it offers a practical design with potential impact for a growing community.
major comments (3)
- [Section 4.1, '3D View' and '2D Plots and Selection'] The manuscript does not specify how the point-cloud rendering maps electron density to point density, nor whether the points used in the 2D plots are the full voxel set or a density-proportional subsample. If the point cloud is generated by subsampling voxels in proportion to electron density, then the scatter plots and selections operate on a biased sample: rare low-density regions (e.g., bonding regions and numerical tails) may be absent, so a 2D selection cannot be said to establish a correspondence between feature ranges and the full chemical system. If instead the point cloud is the full set with visual density encoded by opacity or size, the text should say so, because the phrase 'density of points corresponds to the density of electron cloud' is misleading. This issue is load-bearing because it determines whether the central linking claim (e.g., Fig. 1C) is faithful to the data. The authors should clarify the rendering procedure and confirm that the 2D feature distributions and the 3D view are derived from the same complete point set, or state the subsampling ratio and its effect on selections.
- [Contributions and Section 4.2.1] The scalability claim of 'more than one million data points at a high frame rate of 60 FPS' is not supported by any benchmark evidence. There is no description of the hardware, rendering configuration, frame-rate measurement method, or comparison across data-set sizes; the only support is an anecdotal statement in Section 4.2.1 that the tool interacted smoothly at 60 FPS with a million-point data set. Since scalability is one of the six design challenges (C5) and a bulleted contribution, a quantitative evaluation (e.g., FPS vs. number of points, memory footprint, interaction latency) is needed.
- [Section 4.2] The central claim that ElectroLens enables model diagnosis and feature engineering rests entirely on two self-reported case studies using the authors' own ML models (refs [20] and [27]). There is no controlled user study, no comparison against existing tools (e.g., VMD, PyMOL, VESTA, Ovito), and no independent task-based evaluation. At minimum, the authors should provide a structured comparison with existing atomistic visualization tools for the specific tasks in the case studies, or a small qualitative user evaluation, to substantiate the claimed advantage.
minor comments (6)
- [Section 4.1, '3D View'] The description of the point cloud should distinguish spatial point density from visual encoding via point size or opacity; the current phrasing conflates these possibilities.
- [Section 5] 'atomstic simulations' should be 'atomistic simulations'.
- [References] Reference [26] is mislabeled as 'Keras' but the URL points to the cefpython repository; the citation should be corrected.
- [Figure 3 caption] The 'top tail' selection is not a reproducible criterion; specifying the feature values or the selection rectangle would make the case study more precise.
- [Section 4.1, '2D Plots and Selection'] The statement that each data point is stored only once and shared between plots implies that the 2D plots and 3D view use the same point set; this should be made explicit, especially in light of the density-proportional rendering question.
- [Section 4.2.1] The phrase 'multi-valued error distribution' is misleading; the plot shows a distribution with multiple branches or tails, which is better described as multi-branched or multimodal.
Circularity Check
No significant circularity: ElectroLens is a tool description whose linking functionality is implemented by shared data pointers, not derived from its inputs.
full rationale
No circularity is present. The paper describes a visualization tool, not a derivation or prediction. The central linking mechanism (selecting ranges in 2D plots highlights corresponding regions in 3D) is an interactive data-lookup property: the paper states that "each data point is only stored once and shared between multiple plots without redundant copies," so the 2D and 3D views reference the same underlying points by construction rather than by fitting or by a theory derived from the features. No fitted parameter is renamed as a prediction, and no uniqueness theorem is invoked. The self-citations to the authors' MCSH descriptor work [20] and to their prior NN modeling context appear only as background and as illustrative case-study material in Sect. 4.2; the tool's utility claims do not logically reduce to those references. The absence of a controlled user study and the possible ambiguity in how a density-proportional point cloud samples voxel data are correctness or evaluation risks, not circularity.
Assumptions & free parameters
assumptions (4)
- standard math Hohenberg-Kohn theorem maps electron density to ground-state energy
- domain assumption The local NN model from ref [27] is representative of xc-energy regression failures
- domain assumption Electron density derivative distinguishes C, N, O core regions
- domain assumption Coordinated multiple-view interaction improves user understanding
Cite this review
Pith. "Pith review of ElectroLens: Understanding Atomistic Simulations Through Spatially-resolved Visualization of High-dimensional Features." pith.science (2026). https://pith.science/paper/2EQCXKOE
@misc{pith2026190808381,
  author       = {Pith},
  title        = {Pith review of: ElectroLens: Understanding Atomistic Simulations Through Spatially-resolved Visualization of High-dimensional Features},
  year         = {2026},
  howpublished = {\url{https://pith.science/paper/2EQCXKOE}},
  note         = {Machine review of arXiv:1908.08381}
}
read the original abstract
In recent years, machine learning (ML) has gained significant popularity in the field of chemical informatics and electronic structure theory. These techniques often require researchers to engineer abstract "features" that encode chemical concepts into a mathematical form compatible with the input to machine-learning models. However, there is no existing tool to connect these abstract features back to the actual chemical system, making it difficult to diagnose failures and to build intuition about the meaning of the features. We present ElectroLens, a new visualization tool for high-dimensional spatially-resolved features to tackle this problem. The tool visualizes high-dimensional data sets for atomistic and electron environment features by a series of linked 3D views and 2D plots. The tool is able to connect different derived features and their corresponding regions in 3D via interactive selection. It is built to be scalable, and integrate with existing infrastructure.
Figures

Figures from the paper (1 more)

Reference graph
Works this paper leans on
- [20]
-
[27]
D. J. Tozer, V . E. Ingamells, and N. C. Handy. Exchangecorrelation potentials. The Journal of Chemical Physics , 105(20):9200–9213, 1996
work page 1996
- [1]
-
[2]
Jmol: an open-source java viewer for chemical structures in 3d. http: //www.jmol.org/
- [3]
-
[4]
A. P. Bart´ok, R. Kondor, and G. Cs ´anyi. On representing chemical environments. Phys. Rev. B, 87:184115, May 2013
work page 2013
-
[5]
A. D. Becke. Perspective: Fifty years of density-functional theory in chemical physics. The Journal of Chemical Physics , 140(18):18A301, 2014
work page 2014
-
[6]
J. Behler. Constructing high-dimensional neural network potentials: A tutorial review. International Journal of Quantum Chemistry , 115(16):1032–1050, 2015
work page 2015
Show all 28 references
-
[7]
J. Behler. Perspective: Machine learning potentials for atomistic simu- lations. The Journal of Chemical Physics , 145(17):170901, 2016
2016
-
[8]
Behler and M
J. Behler and M. Parrinello. Generalized neural-network representa- tion of high-dimensional potential-energy surfaces. Phys. Rev. Lett., 98:146401, Apr 2007
2007
-
[9]
Biasini, T
M. Biasini, T. Schmidt, S. Bienert, V . Mariani, G. Studer, J. Haas, N. Johner, A. D. Schenk, A. Philippsen, and T. Schwede. OpenStruc- ture: an integrated software framework for computational structural biology. Acta Crystallographica Section D , 69(5):701–709, May 2013
2013
-
[10]
V . Botu, R. Batra, J. Chapman, and R. Ramprasad. Machine learning force fields: Construction, validation, and outlook. The Journal of Physical Chemistry C, 121(1):511–522, 2017
2017
-
[11]
Chandrasekaran, D
A. Chandrasekaran, D. Kamal, R. Batra, C. Kim, L. Chen, and R. Ram- prasad. Solving the electronic structure problem with machine learning. npj Computational Materials, 5:22, Feburary 2019
2019
-
[12]
Hohenberg and W
P. Hohenberg and W. Kohn. Inhomogeneous electron gas. Phys. Rev., 136:B864–B871, Nov 1964
1964
-
[13]
Hohman, M
F. Hohman, M. Kahng, R. Pienta, and D. H. Chau. Visual analytics in deep learning: An interrogative survey for the next frontiers. CoRR, abs/1801.06889, 2018
2018 arXiv
-
[14]
Humphrey, A
W. Humphrey, A. Dalke, and K. Schulten. VMD – Visual Molecular Dynamics. Journal of Molecular Graphics, 14:33–38, 1996
1996
-
[15]
Imbalzano, A
G. Imbalzano, A. Anelli, D. Giofr´e, S. Klees, J. Behler, and M. Ceriotti. Automatic selection of atomic fingerprints and reference configurations for machine-learning potentials. The Journal of Chemical Physics , 148(24):241730, jun 2018
2018
-
[16]
R. O. Jones. Density functional theory: Its origins, rise to prominence, and future. Rev. Mod. Phys., 87:897–923, Aug 2015
2015
-
[17]
Khorshidi and A
A. Khorshidi and A. A. Peterson. Amp: A modular approach to machine learning in atomistic simulations. Computer Physics Commu- nications, 207:310 – 324, 2016
2016
-
[18]
J. R. Kitchin. Machine learning in catalysis. Nature Catalysis, 1:230, Apr 2018
2018
-
[19]
A. H. Larsen, J. J. Mortensen, J. Blomqvist, I. E. Castelli, R. Chris- tensen, M. Duak, J. Friis, M. N. Groves, B. Hammer, C. Hargus, E. D. Hermes, P. C. Jennings, P. B. Jensen, J. Kermode, J. R. Kitchin, E. L. Kolsbjerg, J. Kubal, K. Kaasbjerg, S. Lysgaard, J. B. Maronsson, T...
2017
-
[21]
Y . Li, H. Li, F. C. Pickard, B. Narayanan, F. G. Sen, M. K. Y . Chan, S. K. R. S. Sankaranarayanan, B. R. Brooks, and B. Roux. Machine learning force field parameters from ab initio data. Journal of Chemical Theory and Computation, 13(9):4492–4503, 2017. PMID: 28800233
2017
-
[22]
S. Liu, D. Maljovec, B. Wang, P. Bremer, and V . Pascucci. Visualizing high-dimensional data: Advances in the past decade. IEEE Trans- actions on Visualization and Computer Graphics , 23(3):1249–1268, March 2017
2017
-
[23]
S. LLC. The pymol molecular graphics system. https://pymol. org/2/
-
[24]
Momma and F
K. Momma and F. Izumi. VESTA3 for three-dimensional visualiza- tion of crystal, volumetric and morphology data. Journal of Applied Crystallography, 44(6):1272–1276, Dec 2011
2011
-
[25]
Schaftenaar and J
G. Schaftenaar and J. Noordik. Molden: a pre- and post-processing program for molecular and electronic structures*. Journal of Computer- Aided Molecular Design, 14(2):123–134, Feb 2000
2000
-
[26]
C. Tomczak. Keras. https://github.com/cztomczak/ cefpython, 2019
2019
-
[28]
Viani et al
L. Viani et al. Mview: A tool for visualization and analysis of molecular properties. http://mview-tools.com/
Reviewed August 14, 2026 · model on record in the stance chip above.
Discussion (0). Continue with ORCID to comment.