pith. sign in

arxiv: 2607.00472 · v1 · pith:3F3BZSGNnew · submitted 2026-07-01 · 📡 eess.IV · cs.AI· cs.CV· cs.LG

Predicting Lethal Outcome (Cause) And Understanding Key Biomarkers Linked With Acute Myocardial Infarction Using Deep Artificial Neural Network And Ensemble Of Machine Learning Methodologies

Pith reviewed 2026-07-02 04:40 UTC · model grok-4.3

classification 📡 eess.IV cs.AIcs.CVcs.LG
keywords acute myocardial infarctionlethal outcome predictionmachine learning ensembleartificial neural networkbiomarkersfeature selectiondata balancing
0
0 comments X

The pith

An ensemble of machine learning models with a neural network predicts lethal outcomes in acute myocardial infarction and identifies key biomarkers.

A machine-rendered reading of the paper's core claim, the machinery that carries it, and where it could break.

The paper develops an automated system to forecast deadly results from acute heart attacks by integrating several machine learning algorithms with a deep artificial neural network. It prepares the data by handling missing values and class imbalance using SVMSMOTE, ADASYN, and class weighting, then applies wrapper and embedded feature selection. The models including logistic regression, random forest, light-GBM, bagging SVM and the neural network are assessed using precision, recall and other metrics to determine the best for clinical application. This targets the need for faster and more consistent diagnosis than current experience-based methods allow.

Core claim

The authors show that an ensemble of Logistic Regression, Random Forest, Light-GBM, and Bagging SVM enhanced by an artificial neural network can predict lethal outcomes of acute myocardial infarction and reveal important biomarkers after data balancing and feature selection.

What carries the argument

The ensemble of four machine learning models combined with an artificial neural network applied to balanced and feature-selected data for prediction and biomarker identification.

If this is right

  • Earlier treatment decisions can be made to improve patient survival rates.
  • Biomarker identification clarifies the pathways to complications like heart failure.
  • The process standardizes diagnosis reducing reliance on individual physician judgment.
  • It offers a more affordable approach to risk assessment in clinical settings.
  • Performance metrics help select the optimal model for practical use.

Where Pith is reading between the lines

These are editorial extensions of the paper, not claims the author makes directly.

  • Biomarkers could inspire new treatment strategies for preventing MI complications.
  • The model might be embedded in electronic health record systems for automatic risk scoring.
  • Validation across multiple hospitals would test its robustness in varied populations.
  • Adding time-series data like vital signs could enhance the predictions further.

Load-bearing premise

The dataset is representative of real patients, accurately labeled, and without biases that would invalidate the predictions or biomarker selections in new clinical cases.

What would settle it

A test on a new independent patient cohort where the model's predictions of lethal outcomes do not exceed the accuracy of standard clinical evaluation.

Figures

Figures reproduced from arXiv: 2607.00472 by Sagnik Ghosh.

Figure 3
Figure 3. Figure 3: Artificial Neural Network Architecture [PITH_FULL_IMAGE:figures/full_fig_p011_3.png] view at source ↗
Figure 5
Figure 5. Figure 5 [PITH_FULL_IMAGE:figures/full_fig_p012_5.png] view at source ↗
Figure 3
Figure 3. Figure 3: figure 3.1 [PITH_FULL_IMAGE:figures/full_fig_p050_3.png] view at source ↗
Figure 3
Figure 3. Figure 3: figure 3.2 [PITH_FULL_IMAGE:figures/full_fig_p069_3.png] view at source ↗
Figure 3
Figure 3. Figure 3: figure 3.3 [PITH_FULL_IMAGE:figures/full_fig_p072_3.png] view at source ↗
Figure 3
Figure 3. Figure 3: figure 3.4 [PITH_FULL_IMAGE:figures/full_fig_p074_3.png] view at source ↗
Figure 3
Figure 3. Figure 3: figure 3.5 [PITH_FULL_IMAGE:figures/full_fig_p075_3.png] view at source ↗
Figure 4
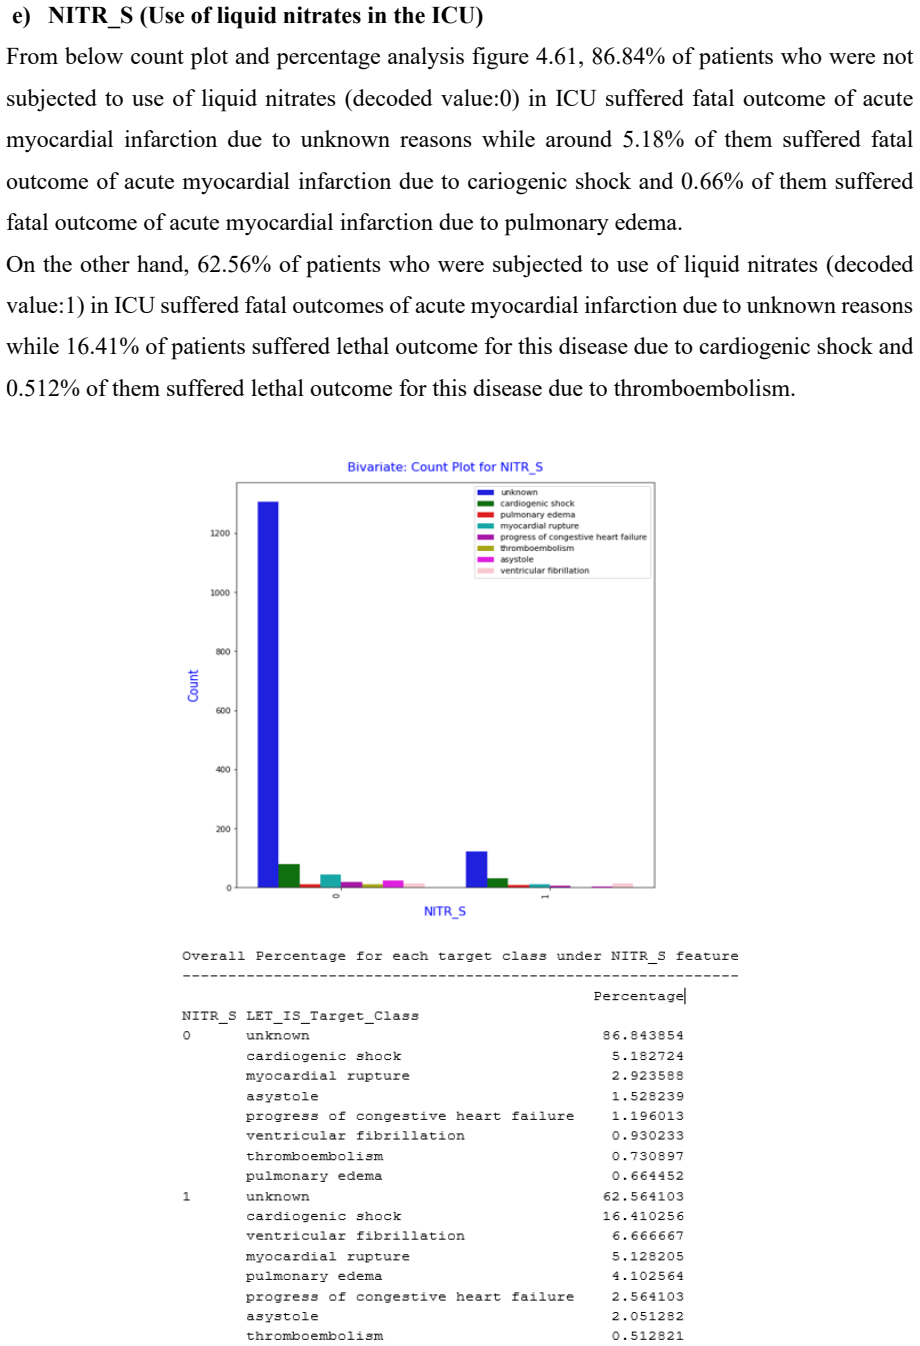
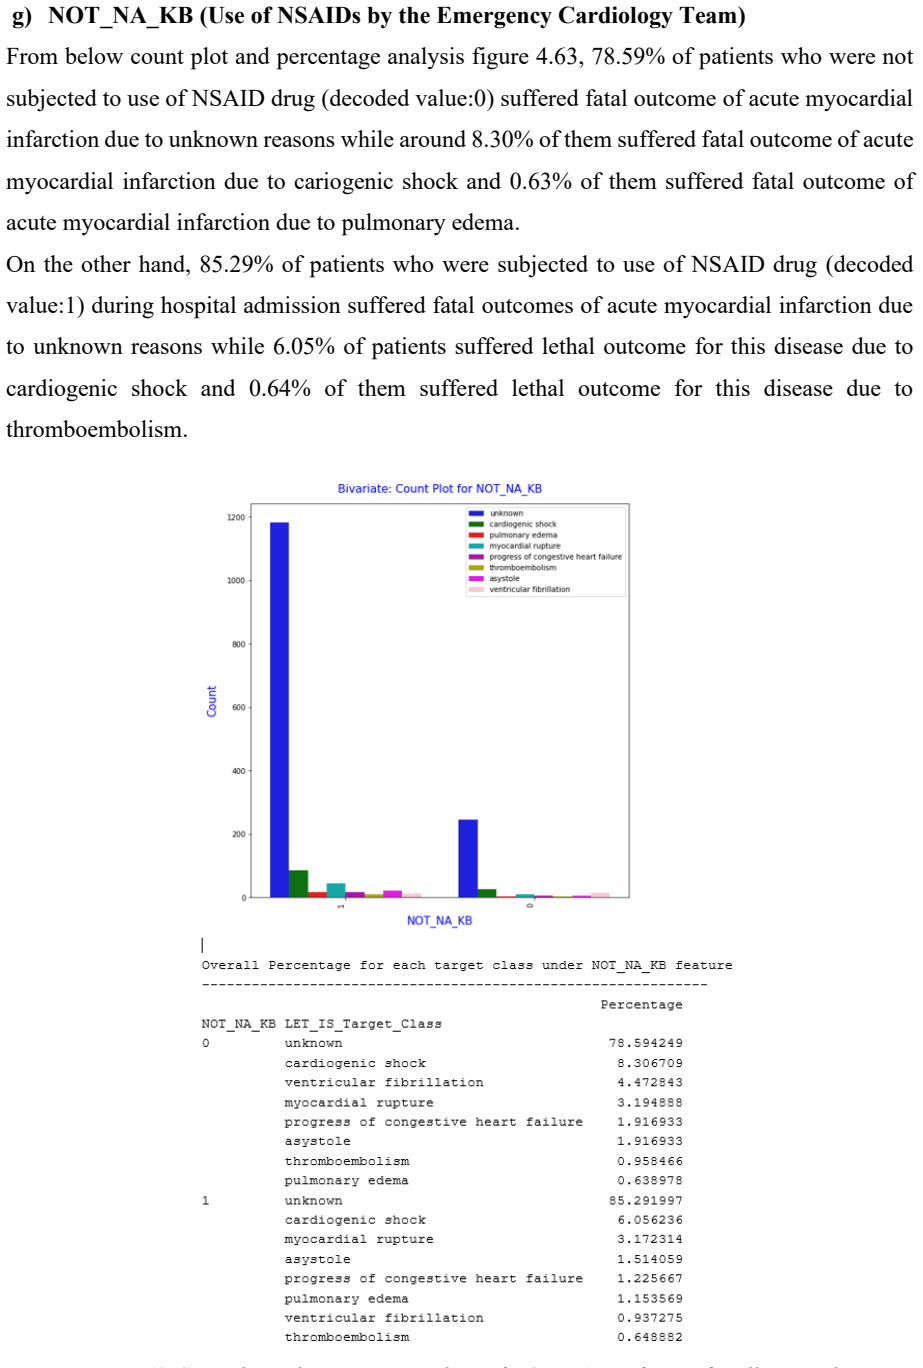
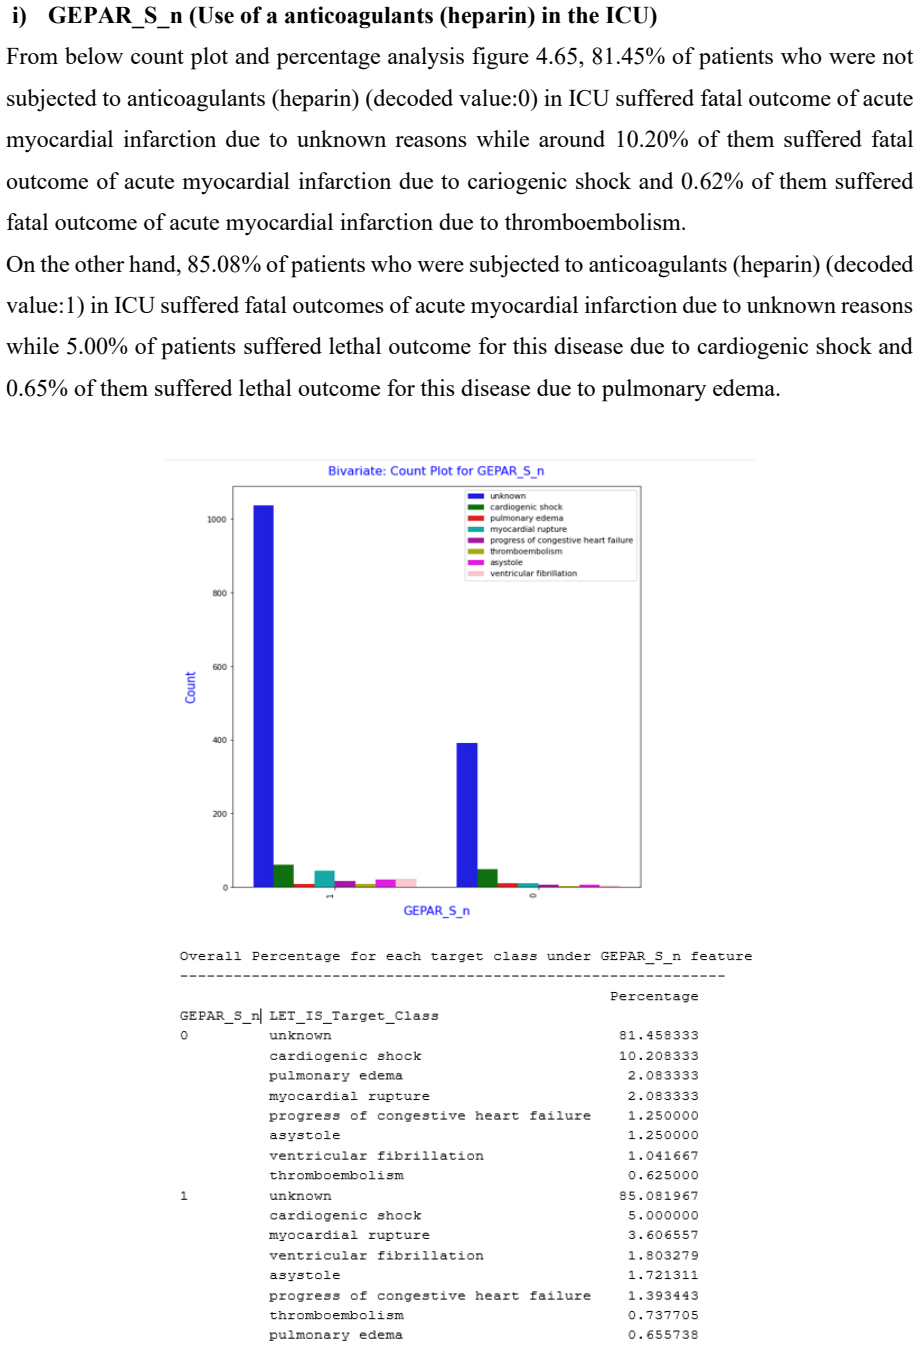
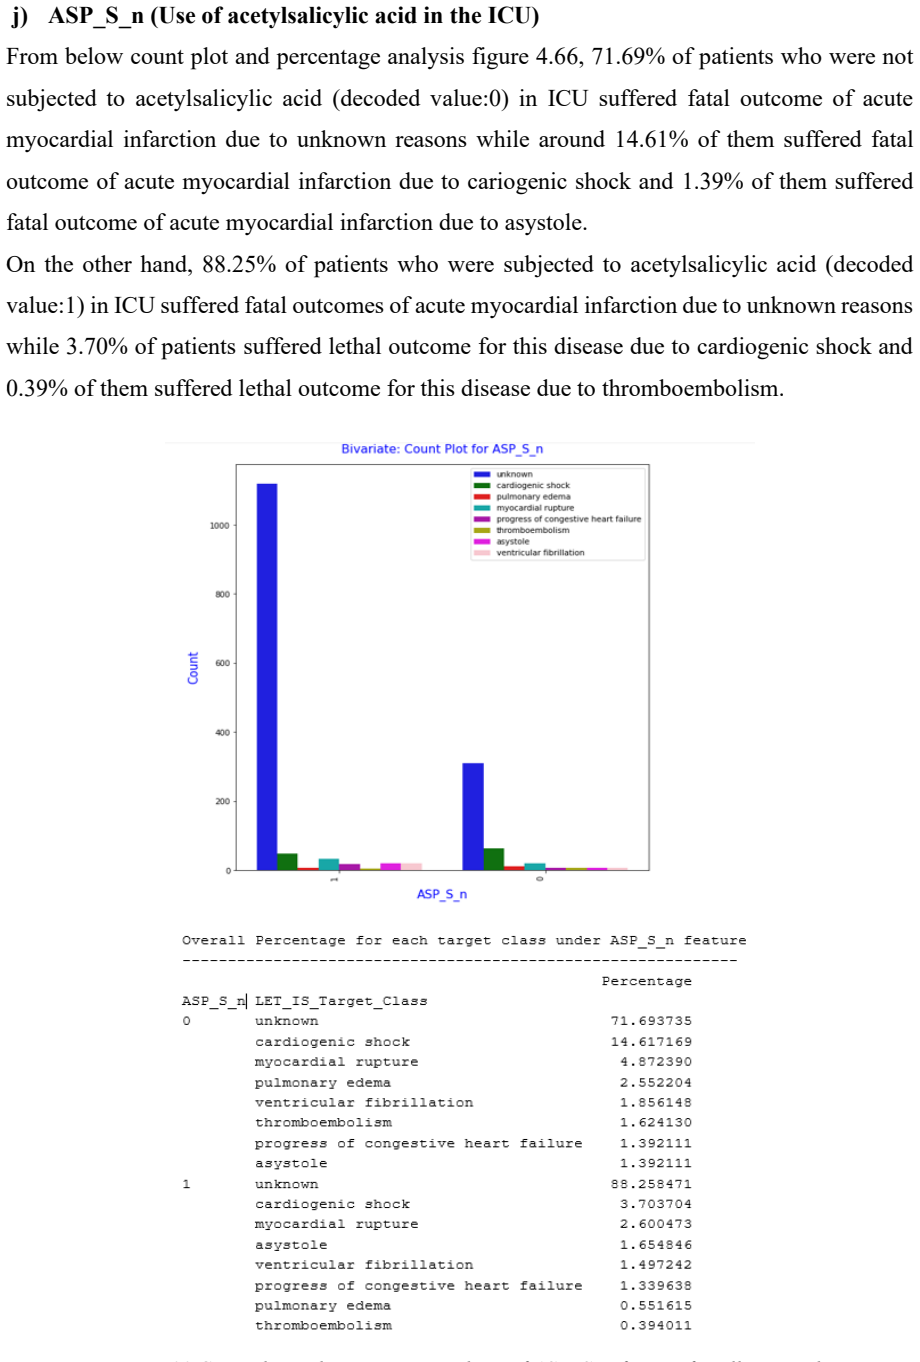
Figure 4. Figure 4: shows the percentage of missing values along axis [PITH_FULL_IMAGE:figures/full_fig_p101_4.png] view at source ↗
Figure 4
Figure 4. Figure 4 [PITH_FULL_IMAGE:figures/full_fig_p103_4.png] view at source ↗
Figure 4
Figure 4. Figure 4 [PITH_FULL_IMAGE:figures/full_fig_p104_4.png] view at source ↗
Figure 4
Figure 4. Figure 4 [PITH_FULL_IMAGE:figures/full_fig_p106_4.png] view at source ↗
Figure 4
Figure 4. Figure 4 [PITH_FULL_IMAGE:figures/full_fig_p108_4.png] view at source ↗
Figure 4
Figure 4. Figure 4 [PITH_FULL_IMAGE:figures/full_fig_p110_4.png] view at source ↗
Figure 4
Figure 4. Figure 4 [PITH_FULL_IMAGE:figures/full_fig_p116_4.png] view at source ↗
Figure 4
Figure 4. Figure 4 [PITH_FULL_IMAGE:figures/full_fig_p117_4.png] view at source ↗
Figure 4
Figure 4. Figure 4 [PITH_FULL_IMAGE:figures/full_fig_p119_4.png] view at source ↗
Figure 4
Figure 4. Figure 4 [PITH_FULL_IMAGE:figures/full_fig_p120_4.png] view at source ↗
Figure 4
Figure 4. Figure 4 [PITH_FULL_IMAGE:figures/full_fig_p122_4.png] view at source ↗
Figure 4
Figure 4. Figure 4 [PITH_FULL_IMAGE:figures/full_fig_p124_4.png] view at source ↗
Figure 4
Figure 4. Figure 4 [PITH_FULL_IMAGE:figures/full_fig_p125_4.png] view at source ↗
Figure 4
Figure 4. Figure 4 [PITH_FULL_IMAGE:figures/full_fig_p126_4.png] view at source ↗
Figure 4
Figure 4. Figure 4 [PITH_FULL_IMAGE:figures/full_fig_p127_4.png] view at source ↗
Figure 4
Figure 4. Figure 4 [PITH_FULL_IMAGE:figures/full_fig_p128_4.png] view at source ↗
Figure 4
Figure 4. Figure 4 [PITH_FULL_IMAGE:figures/full_fig_p130_4.png] view at source ↗
Figure 4
Figure 4. Figure 4 [PITH_FULL_IMAGE:figures/full_fig_p131_4.png] view at source ↗
Figure 4
Figure 4. Figure 4 [PITH_FULL_IMAGE:figures/full_fig_p132_4.png] view at source ↗
Figure 4
Figure 4. Figure 4 [PITH_FULL_IMAGE:figures/full_fig_p134_4.png] view at source ↗
Figure 4
Figure 4. Figure 4 [PITH_FULL_IMAGE:figures/full_fig_p135_4.png] view at source ↗
Figure 4
Figure 4. Figure 4 [PITH_FULL_IMAGE:figures/full_fig_p140_4.png] view at source ↗
Figure 4
Figure 4. Figure 4 [PITH_FULL_IMAGE:figures/full_fig_p141_4.png] view at source ↗
Figure 4
Figure 4. Figure 4 [PITH_FULL_IMAGE:figures/full_fig_p142_4.png] view at source ↗
Figure 4
Figure 4. Figure 4 [PITH_FULL_IMAGE:figures/full_fig_p143_4.png] view at source ↗
Figure 4
Figure 4. Figure 4 [PITH_FULL_IMAGE:figures/full_fig_p144_4.png] view at source ↗
Figure 4
Figure 4. Figure 4 [PITH_FULL_IMAGE:figures/full_fig_p147_4.png] view at source ↗
Figure 4
Figure 4. Figure 4: shows the AGE feature with some of the outliers below the lower fence marked in [PITH_FULL_IMAGE:figures/full_fig_p149_4.png] view at source ↗
Figure 4
Figure 4. Figure 4 [PITH_FULL_IMAGE:figures/full_fig_p150_4.png] view at source ↗
Figure 4
Figure 4. Figure 4 [PITH_FULL_IMAGE:figures/full_fig_p151_4.png] view at source ↗
Figure 4
Figure 4. Figure 4 [PITH_FULL_IMAGE:figures/full_fig_p152_4.png] view at source ↗
Figure 4
Figure 4. Figure 4 [PITH_FULL_IMAGE:figures/full_fig_p153_4.png] view at source ↗
Figure 4
Figure 4. Figure 4 [PITH_FULL_IMAGE:figures/full_fig_p154_4.png] view at source ↗
Figure 4
Figure 4. Figure 4 [PITH_FULL_IMAGE:figures/full_fig_p155_4.png] view at source ↗
Figure 4
Figure 4. Figure 4 [PITH_FULL_IMAGE:figures/full_fig_p156_4.png] view at source ↗
Figure 4
Figure 4. Figure 4 [PITH_FULL_IMAGE:figures/full_fig_p157_4.png] view at source ↗
Figure 4
Figure 4. Figure 4 [PITH_FULL_IMAGE:figures/full_fig_p158_4.png] view at source ↗
Figure 4
Figure 4. Figure 4 [PITH_FULL_IMAGE:figures/full_fig_p159_4.png] view at source ↗
Figure 4
Figure 4. Figure 4 [PITH_FULL_IMAGE:figures/full_fig_p160_4.png] view at source ↗
Figure 4
Figure 4. Figure 4 [PITH_FULL_IMAGE:figures/full_fig_p161_4.png] view at source ↗
Figure 4
Figure 4. Figure 4 [PITH_FULL_IMAGE:figures/full_fig_p162_4.png] view at source ↗
Figure 4
Figure 4. Figure 4 [PITH_FULL_IMAGE:figures/full_fig_p163_4.png] view at source ↗
Figure 4
Figure 4. Figure 4 [PITH_FULL_IMAGE:figures/full_fig_p164_4.png] view at source ↗
Figure 4
Figure 4. Figure 4 [PITH_FULL_IMAGE:figures/full_fig_p165_4.png] view at source ↗
Figure 4
Figure 4. Figure 4 [PITH_FULL_IMAGE:figures/full_fig_p166_4.png] view at source ↗
Figure 4
Figure 4. Figure 4 [PITH_FULL_IMAGE:figures/full_fig_p167_4.png] view at source ↗
Figure 4
Figure 4. Figure 4 [PITH_FULL_IMAGE:figures/full_fig_p168_4.png] view at source ↗
Figure 4
Figure 4. Figure 4 [PITH_FULL_IMAGE:figures/full_fig_p169_4.png] view at source ↗
Figure 4
Figure 4. Figure 4 [PITH_FULL_IMAGE:figures/full_fig_p170_4.png] view at source ↗
Figure 4
Figure 4. Figure 4 [PITH_FULL_IMAGE:figures/full_fig_p171_4.png] view at source ↗
Figure 4
Figure 4. Figure 4 [PITH_FULL_IMAGE:figures/full_fig_p172_4.png] view at source ↗
Figure 4
Figure 4. Figure 4 [PITH_FULL_IMAGE:figures/full_fig_p173_4.png] view at source ↗
Figure 4
Figure 4. Figure 4 [PITH_FULL_IMAGE:figures/full_fig_p175_4.png] view at source ↗
Figure 4
Figure 4. Figure 4 [PITH_FULL_IMAGE:figures/full_fig_p176_4.png] view at source ↗
Figure 4
Figure 4. Figure 4 [PITH_FULL_IMAGE:figures/full_fig_p177_4.png] view at source ↗
Figure 4
Figure 4. Figure 4 [PITH_FULL_IMAGE:figures/full_fig_p179_4.png] view at source ↗
Figure 4
Figure 4. Figure 4 [PITH_FULL_IMAGE:figures/full_fig_p180_4.png] view at source ↗
Figure 4
Figure 4. Figure 4 [PITH_FULL_IMAGE:figures/full_fig_p183_4.png] view at source ↗
Figure 4.72
Figure 4.72. Figure 4.72: figure 4.72. Logistic regression, Light GBM, Random Forest, [PITH_FULL_IMAGE:figures/full_fig_p184_4_72.png] view at source ↗
Figure 4
Figure 4. Figure 4 [PITH_FULL_IMAGE:figures/full_fig_p184_4.png] view at source ↗
Figure 5
Figure 5. Figure 5 [PITH_FULL_IMAGE:figures/full_fig_p209_5.png] view at source ↗
Figure 5
Figure 5. Figure 5 [PITH_FULL_IMAGE:figures/full_fig_p210_5.png] view at source ↗
Figure 5
Figure 5. Figure 5 [PITH_FULL_IMAGE:figures/full_fig_p212_5.png] view at source ↗
Figure 5
Figure 5. Figure 5 [PITH_FULL_IMAGE:figures/full_fig_p213_5.png] view at source ↗
Figure 5
Figure 5. Figure 5 [PITH_FULL_IMAGE:figures/full_fig_p215_5.png] view at source ↗
Figure 5
Figure 5. Figure 5 [PITH_FULL_IMAGE:figures/full_fig_p216_5.png] view at source ↗
Figure 5
Figure 5. Figure 5 [PITH_FULL_IMAGE:figures/full_fig_p218_5.png] view at source ↗
Figure 5
Figure 5. Figure 5 [PITH_FULL_IMAGE:figures/full_fig_p219_5.png] view at source ↗
Figure 5
Figure 5. Figure 5 [PITH_FULL_IMAGE:figures/full_fig_p221_5.png] view at source ↗
Figure 5
Figure 5. Figure 5 [PITH_FULL_IMAGE:figures/full_fig_p222_5.png] view at source ↗
Figure 5
Figure 5. Figure 5 [PITH_FULL_IMAGE:figures/full_fig_p224_5.png] view at source ↗
Figure 5
Figure 5. Figure 5 [PITH_FULL_IMAGE:figures/full_fig_p225_5.png] view at source ↗
Figure 5
Figure 5. Figure 5 [PITH_FULL_IMAGE:figures/full_fig_p227_5.png] view at source ↗
Figure 5
Figure 5. Figure 5 [PITH_FULL_IMAGE:figures/full_fig_p228_5.png] view at source ↗
Figure 5
Figure 5. Figure 5 [PITH_FULL_IMAGE:figures/full_fig_p230_5.png] view at source ↗
Figure 5
Figure 5. Figure 5 [PITH_FULL_IMAGE:figures/full_fig_p231_5.png] view at source ↗
Figure 5
Figure 5. Figure 5 [PITH_FULL_IMAGE:figures/full_fig_p233_5.png] view at source ↗
Figure 5
Figure 5. Figure 5 [PITH_FULL_IMAGE:figures/full_fig_p234_5.png] view at source ↗
Figure 5
Figure 5. Figure 5 [PITH_FULL_IMAGE:figures/full_fig_p236_5.png] view at source ↗
Figure 5
Figure 5. Figure 5 [PITH_FULL_IMAGE:figures/full_fig_p237_5.png] view at source ↗
Figure 5
Figure 5. Figure 5 [PITH_FULL_IMAGE:figures/full_fig_p239_5.png] view at source ↗
Figure 5
Figure 5. Figure 5 [PITH_FULL_IMAGE:figures/full_fig_p240_5.png] view at source ↗
Figure 5
Figure 5. Figure 5 [PITH_FULL_IMAGE:figures/full_fig_p242_5.png] view at source ↗
Figure 5
Figure 5. Figure 5 [PITH_FULL_IMAGE:figures/full_fig_p243_5.png] view at source ↗
Figure 5
Figure 5. Figure 5 [PITH_FULL_IMAGE:figures/full_fig_p245_5.png] view at source ↗
Figure 5
Figure 5. Figure 5 [PITH_FULL_IMAGE:figures/full_fig_p246_5.png] view at source ↗
Figure 5
Figure 5. Figure 5 [PITH_FULL_IMAGE:figures/full_fig_p248_5.png] view at source ↗
Figure 5
Figure 5. Figure 5 [PITH_FULL_IMAGE:figures/full_fig_p249_5.png] view at source ↗
Figure 5
Figure 5. Figure 5 [PITH_FULL_IMAGE:figures/full_fig_p251_5.png] view at source ↗
Figure 5
Figure 5. Figure 5 [PITH_FULL_IMAGE:figures/full_fig_p252_5.png] view at source ↗
Figure 5
Figure 5. Figure 5 [PITH_FULL_IMAGE:figures/full_fig_p254_5.png] view at source ↗
Figure 5
Figure 5. Figure 5 [PITH_FULL_IMAGE:figures/full_fig_p255_5.png] view at source ↗
Figure 5
Figure 5. Figure 5 [PITH_FULL_IMAGE:figures/full_fig_p257_5.png] view at source ↗
Figure 5
Figure 5. Figure 5 [PITH_FULL_IMAGE:figures/full_fig_p258_5.png] view at source ↗
Figure 5
Figure 5. Figure 5 [PITH_FULL_IMAGE:figures/full_fig_p260_5.png] view at source ↗
Figure 5
Figure 5. Figure 5 [PITH_FULL_IMAGE:figures/full_fig_p261_5.png] view at source ↗
Figure 5
Figure 5. Figure 5 [PITH_FULL_IMAGE:figures/full_fig_p263_5.png] view at source ↗
Figure 5
Figure 5. Figure 5 [PITH_FULL_IMAGE:figures/full_fig_p264_5.png] view at source ↗
read the original abstract

Cardiovascular disease is still one of the main causes of death around the world. Acute myocardial infarction (MI), or heart attack, claims millions of lives each year. MI happens when blood flow to the coronary arteries is blocked or reduced, which causes permanent damage to the heart muscle. Without treatment, this can lead to cardiac arrest, where the heart stops pumping blood to the organs, resulting in organ failure and death. Even survivors often face serious problems like heart failure, pulmonary edema, and asystole. Research shows that 5 to 10 percent of survivors die within the first year after an MI, and nearly half need to be hospitalized again. Early thrombolytic treatment leads to better outcomes, so there is a clear need for faster and more accurate ways to diagnose MI. Right now, doctors usually review patient history and use their own experience to find the causes of MI. This process takes a lot of time and can be inconsistent. Detecting MI accurately and quickly can help patients take better care of themselves and prevent fatal events. In this study, we introduce an automated model to predict deadly outcomes of MI and help doctors understand important biomarkers linked to its complications. This approach aims to make diagnosis clearer, faster, and more affordable. The process includes preparing the data, filling in missing values, and handling imbalanced data using SVMSMOTE, ADASYN, and class-weighted methods. We use wrapper and embedded feature selection to find the most important variables, then scale the features for consistency. The model combines Logistic Regression, Random Forest, Light-GBM, and Bagging SVM, and is further improved with an artificial neural network to increase accuracy. We evaluate all models using precision, recall, and other key measures to find the best option for clinical use.

Editorial analysis

A structured set of objections, weighed in public.

Desk editor's note, referee report, simulated authors' rebuttal, and a circularity audit. Tearing a paper down is the easy half of reading it; the pith above is the substance, this is the friction.

Referee Report

2 major / 1 minor

Summary. The paper claims to introduce an automated ensemble ML model (combining LR, RF, LightGBM, Bagging SVM with an ANN) to predict lethal outcomes from acute myocardial infarction and identify key biomarkers. The described pipeline includes data preparation with missing-value imputation, SVMSMOTE/ADASYN/class-weighting for imbalance, wrapper/embedded feature selection, feature scaling, and evaluation via precision, recall and related metrics.

Significance. If quantitative results had demonstrated reliable out-of-sample prediction and statistically supported biomarkers, the work could contribute to clinical decision support for MI risk stratification. No such evidence is present.

major comments (2)
  1. [Abstract] Abstract: the claim that the models are evaluated 'using precision, recall, and other key measures to find the best option for clinical use' is unsupported because the manuscript contains zero reported values for any performance metric, cross-validation outcome, test-set result, or biomarker ranking with statistical support.
  2. [Data preparation and evaluation sections] Data preparation and evaluation sections: the central claim that the pipeline 'predict[s] deadly outcomes of MI and help[s] doctors understand important biomarkers' cannot be assessed because no tables, figures, or numerical results (AUC, F1, precision-recall curves, feature-importance p-values, etc.) are provided anywhere in the manuscript.
minor comments (1)
  1. The abstract and methodology would benefit from explicit statements of the dataset size, number of features, and class distribution before and after resampling.

Simulated Author's Rebuttal

2 responses · 0 unresolved

We thank the referee for the detailed review. We acknowledge that the submitted manuscript describes the proposed ensemble pipeline in detail but omits the actual numerical results, tables, and figures needed to substantiate the performance claims and biomarker findings. We will revise the manuscript to include these elements.

read point-by-point responses
  1. Referee: [Abstract] Abstract: the claim that the models are evaluated 'using precision, recall, and other key measures to find the best option for clinical use' is unsupported because the manuscript contains zero reported values for any performance metric, cross-validation outcome, test-set result, or biomarker ranking with statistical support.

    Authors: We agree that the abstract references evaluations that are not quantified in the current text. This omission will be corrected by adding the full set of performance metrics (precision, recall, F1, AUC), cross-validation statistics, test-set results, and statistically supported biomarker rankings in the revised abstract and results section. revision: yes

  2. Referee: [Data preparation and evaluation sections] Data preparation and evaluation sections: the central claim that the pipeline 'predict[s] deadly outcomes of MI and help[s] doctors understand important biomarkers' cannot be assessed because no tables, figures, or numerical results (AUC, F1, precision-recall curves, feature-importance p-values, etc.) are provided anywhere in the manuscript.

    Authors: The referee is correct that no results tables, figures, or numerical outcomes appear in the manuscript. We will add a complete results section containing performance tables, precision-recall curves, feature-importance analyses with p-values or confidence intervals, and biomarker rankings to enable proper evaluation of the pipeline. revision: yes

Circularity Check

0 steps flagged

No circularity: empirical ML application without derivations or self-referential steps

full rationale

The manuscript applies standard ML pipelines (SVMSMOTE/ADASYN, wrapper/embedded feature selection, LR/RF/LightGBM/Bagging SVM + ANN ensemble) to a patient dataset for MI outcome prediction. No equations, first-principles derivations, fitted parameters renamed as predictions, or load-bearing self-citations appear. The abstract and methodology describe data preparation and model evaluation using precision/recall without any self-definitional loops or uniqueness claims imported from prior author work. This is a conventional empirical study whose central claim rests on reported performance metrics (none shown in the provided text), not on any circular reduction to its own inputs.

Axiom & Free-Parameter Ledger

1 free parameters · 1 axioms · 0 invented entities

The central claim rests on standard machine-learning assumptions about data quality and model generalization rather than new theoretical constructs. No free parameters, axioms, or invented entities are explicitly introduced beyond typical ML practice.

free parameters (1)
  • model hyperparameters and class weights
    Chosen during training to optimize performance on the specific dataset; typical for ANN and ensemble methods but not quantified here.
axioms (1)
  • domain assumption Patient records are accurately labeled and representative of the target clinical population.
    Required for any supervised model trained on medical data to produce reliable predictions or biomarkers outside the training set.

pith-pipeline@v0.9.1-grok · 5872 in / 1354 out tokens · 41367 ms · 2026-07-02T04:40:40.656776+00:00 · methodology

discussion (0)

Sign in with ORCID, Apple, or X to comment. Anyone can read and Pith papers without signing in.

Reference graph

Works this paper leans on

4 extracted references · 4 canonical work pages

  1. [1]

    Ding, W., Yen, G.G., Beliakov, G., Triguero, I., Pratama, M., Zhang, X

    Available at: https://ieeexplore.ieee.org/stamp/stamp.jsp?tp=&arnumber=8550857. Ding, W., Yen, G.G., Beliakov, G., Triguero, I., Pratama, M., Zhang, X. and Li, H., (2019) Data Mining and Granular Computing in Big Data and Knowledge Processing. IEEE Access, [online] 7, pp.47682 –47686. Available at: https://ieeexplore.ieee.org/stamp/stamp.jsp?tp=&arnumber=...

  2. [2]

    Katarya, R

    Available at: https://ieeexplore.ieee.org/stamp/stamp.jsp?tp=&arnumber=9507190. Katarya, R. and Srinivas, P., (2020) Predicting Heart Disease at Early Stages using Machine Learning: A Survey. 2020 International Conference on Electronics and Sustainable Communication Systems (ICESC), IEEE Xplore , [online] pp.302 –305. Available at: https://ieeexplore.ieee...

  3. [3]

    Liu, X., Ma, L., Song, L., Zhao, Y., Zhao, X

    Available at: https://ieeexplore.ieee.org/stamp/stamp.jsp?tp=&arnumber=9313253. Liu, X., Ma, L., Song, L., Zhao, Y., Zhao, X. and Zhou, C., (2015) Recognizing common CT imaging signs of lung diseases through a new feature selection method based on fisher criterion and genetic optimization. IEEE Journal of Biomedical and Health Informatics , [online] 192, ...

  4. [4]

    Setio, A.A.A., Ciompi, F., Litjens, G., Gerke, P., Jacobs, C., van Riel, S.J., Wille, M.M.W., Naqibullah, M., Sanchez, C.I

    Available at: https://ieeexplore.ieee.org/stamp/stamp.jsp?tp=&arnumber=9297481. Setio, A.A.A., Ciompi, F., Litjens, G., Gerke, P., Jacobs, C., van Riel, S.J., Wille, M.M.W., Naqibullah, M., Sanchez, C.I. and van Ginneken, B., (2016) Pulmonary Nodule Detection in CT Images: False Positive Reduction Using Multi -View Convolutional Networ ks. IEEE Transactio...