REVIEW 2 major objections 6 minor 6 cited by
NEXUS: A Spectroscopic Census of Broad-line AGNs and Little Red Dots at $3\lesssim z\lesssim 6$
T0 review · 2 major / 6 minor · reviewed 2026-08-07 · deepseek-v4-flash
Pith's one-line read Extended host-galaxy emission, hundreds of parsecs across, dominates the rest-frame UV of most little red dots, explaining their UV upturn; their small-scale clustering is too strong for their abundance.
desk verdict Careful new LRD census; the host-dominated UV result is solid, but the claimed clustering tension is an extrapolation the authors themselves flag, so read it as provisional. read the letter →
The pith
A machine-rendered reading of the paper's core claim, the machinery that carries it, and where it could break.
The reading
What carries the argument
The image-decomposition machinery is the PSF plus S\'ersic model: each LRD is fit in six NIRCam bands with an unresolved point source (nucleus) plus a S\'ersic profile (host), with wavelength-dependent size and index, so that extended host light can be separated from the AGN. The clustering machinery is the angular cross-correlation function between the sparse BLAGN/LRD samples and a photometric galaxy sample, converted to real space through Limber's equation and translated to halo masses with the Sheth-Tormen bias formula, assuming the small-scale power law with slope $\beta=0.8$ extrapolates to $5$--$20\,h^{-1}$ cMpc scales.
What would settle it
Spectrally resolve the extended rest-frame UV light of a handful of LRDs with an integral-field spectrograph: stellar absorption features would confirm the host-galaxy origin of the UV upturn, while a featureless or AGN-like scattered spectrum would refute it.
Extended reading notes
Core claim
On the paper's own terms, the discovery is that the rest-frame UV-optical light of most little red dots is not dominated by the accreting black hole: in ten of fifteen LRDs, multi-band image decomposition reveals extended, roughly 0.6 kpc, disk-like emission centered on the nucleus, contributing about half of the F200W flux and rising to about three-quarters of the bluest UV flux, and this extended light largely accounts for the UV upturn that defines the LRD SED shape. A second result is the clustering measurement: BLAGNs at median $z\approx4.5$ have linear bias $3.30^{+2.88}_{-2.04}$, corresponding to halo masses of a few $\times10^{11}\,h^{-1}M_\odot$, while the LRD bias of $11.44^{+5.58}_{-5.04}$ is too large to match the LRD space density, leading the authors to argue that LRDs show excess small-scale clustering rather than occupying such massive halos.
Load-bearing premise
The clustering results stand on the assumption that the clustering measured on scales below about one megaparsec follows the same single power law all the way out to 5--20 $h^{-1}$ cMpc; if LRDs cluster extra strongly only on small scales, the inferred large-scale bias and halo masses would be overestimated and the apparent tension with their abundance would disappear.
Editorial extensions
If this is right
- LRD spectral energy distributions do not need exotic AGN-disk or scattered-light models to explain the UV upturn: ordinary host starlight can do it for most objects.
- Most LRDs in this sample show signs of interaction, with 8 of 10 hosts having companions or asymmetric morphology, so LRDs may preferentially trace merger-driven fuelling.
- Half of the LRDs show strong Balmer absorption, supporting a picture in which high-density gas surrounds the broad-line region and shapes the red rest-optical slope.
- BLAGNs at $z\approx3$--$6$ occupy dark-matter halos of a few times $10^{11}\,h^{-1}M_\odot$, consistent with other JWST-based samples at similar redshifts.
- The LRD space density is about $10^{-5}$ cMpc$^{-3}$ with a tentative decline toward $z\approx3$, implying an evolving population or accretion mode across this redshift range.
Reading between the lines
- If host starlight dominates the rest-frame UV, AGN bolometric luminosities and Eddington ratios derived from full-SED fits in other LRD studies may be systematically overestimated, since part of the UV continuum is not from the black hole.
- The excess small-scale LRD clustering, if real, would imply that many LRDs are satellites or merger remnants in group-scale halos rather than central galaxies, weakening the case that their black holes are overmassive for their halos.
- Time-domain follow-up offers a clean test: the extended host component should be non-variable, whereas the nuclear component should flicker, and NEXUS's multi-epoch design could separate the two.
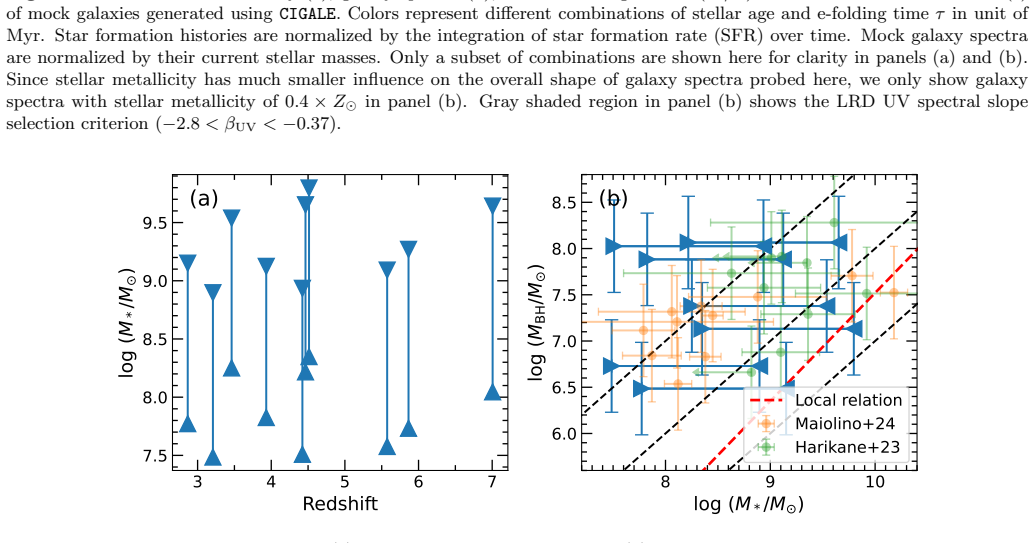
- Stellar-mass estimates for LRDs should be re-examined in light of the host-UV result: the authors' range $10^{7.5}$--$10^{9.8}\,M_\odot$ already brackets extreme mass ratios, and SED-fitting codes that treat all UV as AGN light would bias stellar masses low.
Signed reviews
Editorial analysis
A structured set of objections, weighed in public.
Referee Report
Summary. The paper presents a spectroscopic sample of 23 broad-line AGNs (BLAGNs) at 3 ≲ z ≲ 6, of which 15 are classified as Little Red Dots (LRDs), drawn from NIRCam/WFSS spectroscopy in the NEXUS EDR field. The authors measure broad Hα/He I line properties, derive virial black hole masses and Eddington ratios, perform multi-band AGN-host image decomposition with GALFITM, estimate number densities, and measure angular cross-correlations against a photometric galaxy sample. The two headline results are: (1) extended rest-frame UV-optical host emission is detected in most LRDs and largely explains the LRD UV upturn, and (2) the small-scale clustering signal, when extrapolated to linear scales, implies a linear bias of about 3.3 for BLAGNs and about 11.4 for LRDs, with the LRD value apparently too high for their abundance, which the authors interpret as possible excess small-scale clustering. The paper is careful to flag the extrapolation caveat in Table 4 and Section 4.3, but the abstract still presents the abundance-vs-clustering tension as a central finding.
Significance. If the host-galaxy detection holds, the paper makes an important contribution to the debate over the origin of the LRD UV emission: showing that resolved, disk-like host light dominates the rest-UV in most of these objects is a concrete step beyond the unresolved photometric SED arguments in the literature. The clustering measurement, although very preliminary, is also one of the first for a spectroscopically confirmed LRD sample and will be a useful reference point for future NEXUS data. The paper's strengths include the detailed line-fitting and image-decomposition procedures, the explicit statement of caveats on black hole mass systematics, and the transparent acknowledgment that the linear bias inference rests on a power-law extrapolation from one-halo scales. The main limitation is that the headline LRD clustering claim cannot be independently supported without either a large-scale measurement or a demonstrated robustness to the extrapolation assumption; the current data only directly constrain angular scales below about 1 cMpc.
major comments (2)
- [Section 3.4, Eq. (3)] The linear bias and host-halo mass estimates for both BLAGNs and LRDs are obtained by fitting a single power law with fixed slope β=0.8 to the angular correlation function over 1-100 arcsec, which at z~4.5 corresponds to comoving scales below roughly 1 cMpc, and then extrapolating this power law to r=[5,20] h^-1 cMpc to derive r0, ξ20, and the linear bias. This angular range is plausibly dominated by one-halo and satellite/companion contributions, and the paper's own Table 4 note states that the extrapolation 'may lead to significantly overestimated linear bias factors.' Because the claimed LRD abundance-vs-clustering tension (abstract, Section 4.3) depends entirely on this extrapolation, the authors should add robustness tests, for example by refitting with β varied over a plausible range, by excluding the smallest angular bins, or by fitting a two-halo-plus-one-halo model. If such tests are not feasible with the current data, the abstract and conclusions should be reframed so that the LRD bias of 11.4 and the 'excess small-scale clustering' interpretation are explicitly presented as conditional on an untested power-law extrapolation, rather than as a direct measurement.
- [Section 3.4, Eq. (3)] The Limber inversion for the cross-correlation assumes a known redshift distribution N2(z) for the photometric galaxy sample. The galaxy sample is selected with 22 < m_F444W < 26 and 3 < z_phot < 6, and the paper itself notes that 'some low-z interlopers still scatter into the high-z tail.' Photo-z scatter and interlopers directly change the kernel in Eq. (3) and therefore shift the derived r0 and bias; the jackknife uncertainties quoted in Table 4 do not include this systematic. The authors should either propagate photo-z PDFs into Eq. (3), test the sensitivity to the z_phot cut, or at least provide a quantitative bracket on how much the photo-z errors could change r0 and b. This is a second, independent systematic in the same load-bearing clustering analysis.
minor comments (6)
- [Table 4] The column header for θ0 gives no units; the text says θ is in units of radian, but the reported values (0.40, 1.77, 0.41) appear more consistent with arcsec or arcmin. Please specify the units explicitly in the table and in the text, and ensure the conversion into Eq. (2) uses consistent units.
- [Abstract and Section 2.3] The abstract states that 'Half of the LRDs show strong Balmer absorption'; the body of the paper correctly reports 6 of 12 LRDs with Hα coverage. Please add the denominator in the abstract or rephrase to 'half of the LRDs with Hα coverage.'
- [Section 3.2 and Figure 14] The text says the extended emission contribution increases from ~50% in F200W to ~75% in F090W, but the f_PSF medians displayed in Figure 14 (e.g., 0.15 for F090W and 0.27 for F200W) imply extended fractions of roughly 85% and 73%, respectively. Please verify the numbers in the text or clarify the definition of 'contribution' used.
- [Section 3.4] The statement that sample completeness does not affect the clustering measurements should be qualified: it holds only if the incompleteness is independent of environment. Since the selection includes criteria based on line detectability and visual inspection, this assumption should be stated explicitly.
- [Section 3.2] The GALFITM decomposition is central to the extended-host-emission claim, but the construction of the PSF model (e.g., empirical stars, model PSF, or a combination) is not described in this paper. Please state how the PSF was built and how correlated noise in the imaging was treated, or give a more specific reference to the procedure.
- [Figure 12] The text refers to best-fit power-law models summarized in Table 4, but Figure 12 does not overplot the fitted models. Adding the best-fit curves would help the reader assess the quality of the power-law fits and the extrapolation.
Circularity Check
No significant circularity: the paper's measurement and inference chain is self-contained, and the one caveated extrapolation is transparently flagged rather than recycled as a prediction.
full rationale
The paper's central measurements are not equivalent to their inputs by construction. Black hole masses and Eddington ratios come from external single-epoch virial calibrations (Reines & Volonteri 2015; Stern & Laor 2012), not from any quantity derived in this work. The rest-frame UV host-emission claim rests on GALFITM decomposition with explicit PSF-only versus PSF+Sersic model comparison, residual imaging, and radial surface-brightness profiles; the conclusion that extended emission explains the LRD UV upturn follows from the measured wavelength-dependent PSF flux fractions, not from the LRD selection criteria. The clustering analysis uses measured angular cross/auto-correlation functions with jackknife errors, then applies the independent Limber equation and Sheth-Tormen bias formalism; the inferred bias and halo masses are compared, rather than fitted, to the measured number densities. The paper explicitly warns in the Table 4 note and Section 4.3 that the power-law extrapolation from one-halo scales 'may lead to significantly overestimated linear bias factors' and frames the LRD excess-small-scale-clustering interpretation as one possible resolution, not as a pre-loaded conclusion. Self-citations to Shen et al. 2024 and Zhuang et al. 2024b are data-provenance references for the NEXUS EDR observations, not assumptions that contain the paper's target results. No fitted constant is renamed as a prediction, no equation is defined in terms of the result it supports, and no load-bearing uniqueness theorem is imported from the authors' prior work.
Assumptions & free parameters
free parameters (1)
- Power-law slope beta of the angular correlation function =
0.8 (fixed by hand)
assumptions (7)
- domain assumption Broad-line emitters in the sample are active galactic nuclei (AGNs), i.e., accreting supermassive black holes.
- domain assumption The low-redshift H-alpha virial black hole mass estimator of Reines & Volonteri (2015) applies to z~3-6 broad-line AGNs and LRDs.
- domain assumption The bolometric correction L_bol = 130 x L_Halpha,broad (Stern & Laor 2012) is valid for these objects.
- ad hoc to paper The angular correlation function measured at 1-100 arcsec follows a single power law with slope beta=0.8 that can be extrapolated to 5-20 h^-1 cMpc linear scales.
- domain assumption GALFITM PSF-plus-Sersic decomposition correctly separates the nuclear point source from extended host or companion emission in the NIRCam images.
- domain assumption The photometric galaxy sample's redshift distribution N(z) accurately represents the true overlap with the BLAGN/LRD samples for the cross-correlation.
- standard math Limber equation, power-law correlation function conversion, and the Sheth-Tormen (2001) halo bias formula correctly map the measured angular clustering to linear bias and halo mass.
Cite this review
Pith. "Pith review of NEXUS: A Spectroscopic Census of Broad-line AGNs and Little Red Dots at $3\lesssim z\lesssim 6$." pith.science (2026). https://pith.science/paper/4GQMV6KD
@misc{pith2026250520393,
  author       = {Pith},
  title        = {Pith review of: NEXUS: A Spectroscopic Census of Broad-line AGNs and Little Red Dots at $3\lesssim z\lesssim 6$},
  year         = {2026},
  howpublished = {\url{https://pith.science/paper/4GQMV6KD}},
  note         = {Machine review of arXiv:2505.20393}
}
abstract
We present a spectroscopic sample of 23 broad-line AGNs (BLAGNs) at $3\lesssim z\lesssim 6$ selected using F322W2+F444W NIRCam/WFSS grism spectroscopy of the central 100 ${\rm arcmin^2}$ area of the NEXUS survey. Among these BLAGNs, 15 are classified as Little Red Dots (LRDs) based on their rest-frame UV-optical spectral slopes and compact morphology. The number density of LRDs is $\sim 10^{-5}\,{\rm cMpc^{-3}}$, with a hint of declining towards the lower end of the probed redshift range. These BLAGNs and LRDs span broad H$\alpha$ luminosities of $\sim 10^{42.2}-10^{43.7}\,{\rm erg\,s^{-1}}$, black hole masses of $\sim 10^{6.3}-10^{8.4}\,M_\odot$, and Eddington ratios of $\sim 0.1-1$ (median value 0.4), though the black hole mass and Eddington ratio estimates carry large systematic uncertainties. Half of the LRDs show strong Balmer absorption, suggesting high-density gas surrounding the line-emitting region. We detect extended (hundreds of parsec) rest-frame UV-optical emission from the host galaxy in the majority of these LRDs, which contributes significantly or even dominantly to their total UV emission. This host emission largely accounts for the peculiar UV upturn of the LRD spectral energy distribution. We also measure the small-scale ($\lesssim 1\,{\rm cMpc}$) clustering of these BLAGNs and LRDs by cross-correlating with a photometric galaxy sample. Extrapolating the power-law two-point correlation function model to large linear scales, we infer a linear bias of $3.30_{-2.04}^{+2.88}$ and typical halo masses of a few $\times 10^{11}\,h^{-1}M_\odot$ for BLAGNs at the sample median redshift of $z\sim 4.5$. However, the inferred linear bias and halo masses of LRDs, while formally consistent with those for BLAGNs at $\sim 1.5\sigma$, appear too large to be compatible with their space density, suggesting LRDs may have strong excess clustering on small scales.
Figures


Figures from the paper (15 more)




Forward citations
Cited by 6 Pith papers
-
Where did all the Little Red Dots go? The abundance of LRD analogues among objects with broad lines at $z < 0.35$
Only 0.08% of low-redshift broad-line objects have SEDs resembling high-redshift Little Red Dots, yielding nine candidates, one of which is the known analogue 'The Egg'.
-
NEXUS: Spectral Variability of Little Red Dots and Blue Active Galactic Nuclei at $2 \lesssim z \lesssim 6$
Little Red Dots at z=2-6 show less than 4% intrinsic H-alpha variability on 1-3 month rest-frame timescales, a flat white-noise pattern unlike normal AGNs, implying different broad-line production.
-
NEXUS: A Search for Nuclear Variability with the First Two JWST NIRCam Epochs
Using two JWST NIRCam epochs, difference imaging finds 465 nuclear variable sources and sets tight F444W variability upper limits of 3 to 10 percent for ten Little Red Dots.
-
No Luminous Little Red Dots: A Sharp Cutoff in Their Luminosity Function
Little red dots have a sharp cutoff in their optical luminosity function at about lambda L5100 = 2.5e44 erg/s, roughly 20 times fainter than the quasar turnover, so they are not hidden quasars.
-
Cosmic Outliers: Low-Spin Halos Explain the Abundance, Compactness, and Redshift Evolution of the Little Red Dots
Little Red Dots are explained as galaxies formed in the lowest roughly 1% of dark matter halo spin, which reproduces their abundance, compactness, and redshift distribution.
-
Little Red reionization factories
LRDs may drive cosmic reionization: tidal fields are said to funnel intergalactic hydrogen into colliding streams at LRD sites, igniting starbursts that ionize the gas.
Reference graph
Works this paper leans on
-
[1]
, " * write output.state after.block = add.period write newline
ENTRY address archivePrefix author booktitle chapter doi edition editor eprint howpublished institution journal key month number organization pages publisher school series title misctitle type volume year version url label extra.label sort.label short.list INTEGERS output.state before.all mid.sentence after.sentence after.block FUNCTION init.state.consts ...
-
[2]
write newline
" write newline "" before.all 'output.state := FUNCTION format.url url empty "" new.block "" url * "" * if FUNCTION format.eprint eprint empty "" archivePrefix empty "" archivePrefix "arXiv" = new.block " " eprint * " " * new.block " " eprint * " " * if if if FUNCTION format.doi doi empty "" " " doi * " " * if FUNCTION format.pid doi empty eprint empty ur...
-
[3]
Ͱ = 24=RkB:- V6jN :;hغ Pooȳ(6j_TO<
thebibliography [1] 20pt to REFERENCES 6pt =0pt -12pt 10pt plus 3pt =0pt =0pt =1pt plus 1pt =0pt =0pt -12pt =13pt plus 1pt =20pt =13pt plus 1pt \@M =10000 =-1.0em =0pt =0pt 0pt =0pt =1.0em @enumiv\@empty 10000 10000 `\.\@m \@noitemerr \@latex@warning Empty `thebibliography' environment \@ifnextchar \@reference \@latexerr Missing key on reference command E...
arXiv 2021
-
[4]
Adelberger , K. L., Steidel , C. C., Pettini , M., et al. 2005, , 619, 697, 10.1086/426580
doi:10.1086/426580 2005
-
[5]
T., Bogd \'a n , \'A ., Kov \'a cs , O
Ananna , T. T., Bogd \'a n , \'A ., Kov \'a cs , O. E., Natarajan , P., & Hickox , R. C. 2024, , 969, L18, 10.3847/2041-8213/ad5669
-
[6]
2025, , 536, 3677, 10.1093/mnras/stae2765
Arita , J., Kashikawa , N., Onoue , M., et al. 2025, , 536, 3677, 10.1093/mnras/stae2765
-
[7]
Astropy Collaboration , Robitaille , T. P., Tollerud , E. J., et al. 2013, , 558, A33, 10.1051/0004-6361/201322068
-
[8]
Astropy Collaboration , Price-Whelan , A. M., Sip o cz , B. M., et al. 2018, , 156, 123, 10.3847/1538-3881/aabc4f
Show all 113 references
-
[9]
Baggen , J. F. W., van Dokkum , P., Brammer , G., et al. 2024, , 977, L13, 10.3847/2041-8213/ad90b8
2024 doi
-
[10]
G., Kocevski , D
Barro , G., P \'e rez-Gonz \'a lez , P. G., Kocevski , D. D., et al. 2024, , 963, 128, 10.3847/1538-4357/ad167e
2024 doi
-
[11]
2025, , 984, L55, 10.3847/2041-8213/adce6c
Bellovary , J. 2025, , 984, L55, 10.3847/2041-8213/adce6c
2025 doi
-
[12]
Bertemes , C., Wylezalek , D., Rupke , D. S. N., et al. 2025, , 693, A176, 10.1051/0004-6361/202450451
2025 doi
-
[13]
1996, , 117, 393, 10.1051/aas:1996164
Bertin , E., & Arnouts , S. 1996, , 117, 393, 10.1051/aas:1996164
1996 doi
-
[14]
K., Blecha , L., Torrey , P., et al
Bhowmick , A. K., Blecha , L., Torrey , P., et al. 2024, , 533, 1907, 10.1093/mnras/stae1819
2024 doi
-
[15]
D., Natarajan , P., et al
Bogd \'a n , \'A ., Goulding , A. D., Natarajan , P., et al. 2024, Nature Astronomy, 8, 126, 10.1038/s41550-023-02111-9
2024 doi
-
[16]
2019, , 622, A103, 10.1051/0004-6361/201834156
Boquien , M., Burgarella , D., Roehlly , Y., et al. 2019, , 622, A103, 10.1051/0004-6361/201834156
2019 doi
-
[17]
2022, astropy/photutils: 1.5.0, 1.5.0, Zenodo, 10.5281/zenodo.6825092
Bradley, L., Sip o cz, B., Robitaille, T., et al. 2022, astropy/photutils: 1.5.0, 1.5.0, Zenodo, 10.5281/zenodo.6825092
2022 doi
-
[18]
B., van Dokkum , P
Brammer , G. B., van Dokkum , P. G., & Coppi , P. 2008, , 686, 1503, 10.1086/591786
2008 doi
-
[19]
2003, , 344, 1000, 10.1046/j.1365-8711.2003.06897.x
Bruzual , G., & Charlot , S. 2003, , 344, 1000, 10.1046/j.1365-8711.2003.06897.x
2003
-
[20]
M., Akins , H
Casey , C. M., Akins , H. B., Kokorev , V., et al. 2024, , 975, L4, 10.3847/2041-8213/ad7ba7
2024 doi
- [21]
- [22]
-
[23]
C., Li , R., & Zhuang , M.-Y
Chen , C.-H., Ho , L. C., Li , R., & Zhuang , M.-Y. 2025 b , , 983, 60, 10.3847/1538-4357/ada93a
2025 doi
-
[24]
M., & Shanks , T
Croom , S. M., & Shanks , T. 1999, , 303, 411, 10.1046/j.1365-8711.1999.02232.x
1999
- [25]
- [26]
- [27]
- [28]
-
[29]
E., Labbe , I., Goulding , A
Greene , J. E., Labbe , I., Goulding , A. D., et al. 2024, , 964, 39, 10.3847/1538-4357/ad1e5f
2024 doi
-
[30]
P., Kelly , D
Greene , T. P., Kelly , D. M., Stansberry , J., et al. 2017, Journal of Astronomical Telescopes, Instruments, and Systems, 3, 035001, 10.1117/1.JATIS.3.3.035001
2017 doi
-
[31]
N., Maiolino , R., Juod z balis , I., et al
Hainline , K. N., Maiolino , R., Juod z balis , I., et al. 2025, , 979, 138, 10.3847/1538-4357/ad9920
2025 doi
-
[32]
Hall , P. B. 2007, , 133, 1271, 10.1086/511272
2007 doi
-
[33]
2023, , 959, 39, 10.3847/1538-4357/ad029e
Harikane , Y., Zhang , Y., Nakajima , K., et al. 2023, , 959, 39, 10.3847/1538-4357/ad029e
2023 doi
-
[34]
R., Millman, K
Harris, C. R., Millman, K. J., van der Walt, S. J., et al. 2020, Nature, 585, 357, 10.1038/s41586-020-2649-2
2020 doi
-
[35]
P., Vika , M., et al
H \"a u ler , B., Bamford , S. P., Vika , M., et al. 2013, , 430, 330, 10.1093/mnras/sts633
2013 doi
-
[36]
2018, , 70, S33, 10.1093/pasj/psx129
He , W., Akiyama , M., Bosch , J., et al. 2018, , 70, S33, 10.1093/pasj/psx129
2018 doi
-
[37]
Hunter, J. D. 2007, Computing in Science & Engineering, 9, 90, 10.1109/MCSE.2007.55
2007 doi
- [38]
- [39]
-
[40]
2025, , 980, L27, 10.3847/2041-8213/adaebd
Inayoshi , K., & Maiolino , R. 2025, , 980, L27, 10.3847/2041-8213/adaebd
2025 doi
- [41]
-
[42]
Jeon , J., Bromm , V., Liu , B., & Finkelstein , S. L. 2025, , 979, 127, 10.3847/1538-4357/ad9f3a
2025 doi
-
[43]
2025, arXiv e-prints, arXiv:2501.13082, 10.48550/arXiv.2501.13082
Ji , X., Maiolino , R., \"U bler , H., et al. 2025, arXiv e-prints, arXiv:2501.13082, 10.48550/arXiv.2501.13082
2025 doi
-
[44]
M., & Davis , S
Jiang , Y.-F., Stone , J. M., & Davis , S. W. 2019, , 880, 67, 10.3847/1538-4357/ab29ff
2019 doi
-
[45]
2024, , 535, 853, 10.1093/mnras/stae2367
Juod z balis , I., Ji , X., Maiolino , R., et al. 2024, , 535, 853, 10.1093/mnras/stae2367
2024 doi
-
[46]
M., et al
Juod z balis , I., Maiolino , R., Baker , W. M., et al. 2025, arXiv e-prints, arXiv:2504.03551, 10.48550/arXiv.2504.03551
2025 doi
-
[47]
2024, , 691, A52, 10.1051/0004-6361/202348857
Killi , M., Watson , D., Brammer , G., et al. 2024, , 691, A52, 10.1051/0004-6361/202348857
2024 doi
- [48]
-
[49]
2024, , 975, 178, 10.3847/1538-4357/ad7d03
Kokorev , V., Chisholm , J., Endsley , R., et al. 2024, , 975, 178, 10.3847/1538-4357/ad7d03
2024 doi
-
[50]
2024, arXiv e-prints, arXiv:2407.04777, 10.48550/arXiv.2407.04777
Kokubo , M., & Harikane , Y. 2024, arXiv e-prints, arXiv:2407.04777, 10.48550/arXiv.2407.04777
2024 doi
-
[51]
Kormendy , J., & Ho , L. C. 2013, , 51, 511, 10.1146/annurev-astro-082708-101811
2013 doi
- [52]
-
[53]
E., Bezanson , R., et al
Labbe , I., Greene , J. E., Bezanson , R., et al. 2025, , 978, 92, 10.3847/1538-4357/ad3551
2025 doi
- [54]
- [55]
- [56]
-
[57]
R., Tremaine , S., Richstone , D., & Faber , S
Lauer , T. R., Tremaine , S., Richstone , D., & Faber , S. M. 2007, , 670, 249, 10.1086/522083
2007 doi
- [58]
- [59]
-
[60]
D., Shen , Y., et al
Li , J., Silverman , J. D., Shen , Y., et al. 2025 b , , 981, 19, 10.3847/1538-4357/ada603
2025 doi
-
[61]
C., & Chen , C.-H
Li , R., Ho , L. C., & Chen , C.-H. 2025 c , arXiv e-prints, arXiv:2505.12867, 10.48550/arXiv.2505.12867
2025 doi
-
[62]
Li , Z., Inayoshi , K., Chen , K., Ichikawa , K., & Ho , L. C. 2025 d , , 980, 36, 10.3847/1538-4357/ada5fb
2025 doi
-
[63]
Liddle , A. R. 2007, , 377, L74, 10.1111/j.1745-3933.2007.00306.x
2007
-
[64]
Limber , D. N. 1953, , 117, 134, 10.1086/145672
1953 doi
-
[65]
2024, , 974, 147, 10.3847/1538-4357/ad6565
Lin , X., Wang , F., Fan , X., et al. 2024, , 974, 147, 10.3847/1538-4357/ad6565
2024 doi
-
[66]
2025 a , arXiv e-prints, arXiv:2504.08039, 10.48550/arXiv.2504.08039
Lin , X., Fan , X., Wang , F., et al. 2025 a , arXiv e-prints, arXiv:2504.08039, 10.48550/arXiv.2504.08039
2025 doi
-
[67]
2025 b , arXiv e-prints, arXiv:2505.02896, 10.48550/arXiv.2505.02896
Lin , X., Fan , X., Sun , F., et al. 2025 b , arXiv e-prints, arXiv:2505.02896, 10.48550/arXiv.2505.02896
2025 doi
- [68]
-
[69]
2024, , 976, L24, 10.3847/2041-8213/ad90e1
Madau , P., & Haardt , F. 2024, , 976, L24, 10.3847/2041-8213/ad90e1
2024 doi
-
[70]
2024, , 691, A145, 10.1051/0004-6361/202347640
Maiolino , R., Scholtz , J., Curtis-Lake , E., et al. 2024, , 691, A145, 10.1051/0004-6361/202347640
2024 doi
-
[71]
2025, , 538, 1921, 10.1093/mnras/staf359
Maiolino , R., Risaliti , G., Signorini , M., et al. 2025, , 538, 1921, 10.1093/mnras/staf359
2025 doi
-
[72]
P., Brammer , G., et al
Matthee , J., Naidu , R. P., Brammer , G., et al. 2024 a , , 963, 129, 10.3847/1538-4357/ad2345
2024 doi
- [73]
- [74]
-
[75]
2024, , 961, 73, 10.3847/1538-4357/ad0966
Narayanan , D., Lower , S., Torrey , P., et al. 2024, , 961, 73, 10.3847/1538-4357/ad0966
2024 doi
-
[76]
2024, , 960, L1, 10.3847/2041-8213/ad0e76
Natarajan , P., Pacucci , F., Ricarte , A., et al. 2024, , 960, L1, 10.3847/2041-8213/ad0e76
2024 doi
-
[77]
2023, , 957, L3, 10.3847/2041-8213/ad0158
Pacucci , F., Nguyen , B., Carniani , S., Maiolino , R., & Fan , X. 2023, , 957, L3, 10.3847/2041-8213/ad0158
2023 doi
-
[78]
Papovich , C., Dickinson , M., & Ferguson , H. C. 2001, , 559, 620, 10.1086/322412
2001 doi
-
[79]
Y., Ho , L
Peng , C. Y., Ho , L. C., Impey , C. D., & Rix , H.-W. 2002, , 124, 266, 10.1086/340952
2002 doi
-
[80]
2010, , 139, 2097, 10.1088/0004-6256/139/6/2097
---. 2010, , 139, 2097, 10.1088/0004-6256/139/6/2097
2010 doi
-
[81]
G., Barro , G., Rieke , G
P \'e rez-Gonz \'a lez , P. G., Barro , G., Rieke , G. H., et al. 2024, , 968, 4, 10.3847/1538-4357/ad38bb
2024 doi
-
[82]
Perger , K., Fogasy , J., Frey , S., & Gab \'a nyi , K. \'E . 2025, , 693, L2, 10.1051/0004-6361/202452422
2025 doi
-
[83]
F., Schaye , J., et al
Pizzati , E., Hennawi , J. F., Schaye , J., et al. 2025, , 10.1093/mnras/staf660
2025 doi
-
[84]
E., & Volonteri , M
Reines , A. E., & Volonteri , M. 2015, , 813, 82, 10.1088/0004-637X/813/2/82
2015 doi
-
[85]
H., et al
Rinaldi , P., Bonaventura , N., Rieke , G. H., et al. 2024, arXiv e-prints, arXiv:2411.14383, 10.48550/arXiv.2411.14383
2024 doi
-
[86]
P., et al
Rusakov , V., Watson , D., Nikopoulos , G. P., et al. 2025, arXiv e-prints, arXiv:2503.16595, 10.48550/arXiv.2503.16595
2025 doi
- [87]
- [88]
-
[89]
A., Oguri , M., et al
Shen , Y., Strauss , M. A., Oguri , M., et al. 2007, , 133, 2222, 10.1086/513517
2007 doi
- [90]
-
[91]
K., Mo , H
Sheth , R. K., Mo , H. J., & Tormen , G. 2001, , 323, 1, 10.1046/j.1365-8711.2001.04006.x
2001
-
[92]
2012, , 423, 600, 10.1111/j.1365-2966.2012.20901.x
Stern , J., & Laor , A. 2012, , 423, 600, 10.1111/j.1365-2966.2012.20901.x
2012
-
[93]
H., Lyu , J., et al
Sun , Y., Rieke , G. H., Lyu , J., et al. 2025, , 983, 165, 10.3847/1538-4357/adc250
2025 doi
- [94]
-
[95]
J., Barger , A
Taylor , A. J., Barger , A. J., Cowie , L. L., et al. 2023, , 266, 24, 10.3847/1538-4365/accd70
2023 doi
- [96]
- [97]
-
[98]
L., Fan , X., Wang , F., & Yang , J
Tee , W. L., Fan , X., Wang , F., & Yang , J. 2025, , 983, L26, 10.3847/2041-8213/adc5e3
2025 doi
-
[99]
E., et al
Virtanen , P., Gommers , R., Oliphant , T. E., et al. 2020, Nature Methods, 17, 261, 10.1038/s41592-019-0686-2
2020 doi
-
[100]
E., et al
Volonteri , M., Trebitsch , M., Greene , J. E., et al. 2025, , 695, A33, 10.1051/0004-6361/202451963
2025 doi
-
[101]
2024, , 963, 74, 10.3847/1538-4357/ad187c
Wang , B., Leja , J., Atek , H., et al. 2024, , 963, 74, 10.3847/1538-4357/ad187c
2024 doi
-
[102]
L., et al
Wang , B., de Graaff , A., Davies , R. L., et al. 2025, , 984, 121, 10.3847/1538-4357/adc1ca
2025 doi
-
[103]
F., et al
Wang , F., Yang , J., Hennawi , J. F., et al. 2023, , 951, L4, 10.3847/2041-8213/accd6f
2023 doi
-
[104]
2022, , 263, 42, 10.3847/1538-4365/ac9ead
Wu , Q., & Shen , Y. 2022, , 263, 42, 10.3847/1538-4365/ac9ead
2022 doi
-
[105]
T., et al
Yue , M., Eilers , A.-C., Ananna , T. T., et al. 2024, , 974, L26, 10.3847/2041-8213/ad7eba
2024 doi
-
[106]
2025 a , arXiv e-prints, arXiv:2505.12719
Zhang , C., Wu , Q., Fan , X., et al. 2025 a , arXiv e-prints, arXiv:2505.12719. 2505.12719
2025
-
[107]
2025 b , arXiv e-prints, arXiv:2505.02895, 10.48550/arXiv.2505.02895
Zhang , J., Egami , E., Sun , F., et al. 2025 b , arXiv e-prints, arXiv:2505.02895, 10.48550/arXiv.2505.02895
2025 doi
- [108]
-
[109]
Zhuang , M.-Y., & Ho , L. C. 2022, , 934, 130, 10.3847/1538-4357/ac7aaf
2022 doi
- [110]
-
[111]
2024 a , , 962, 93, 10.3847/1538-4357/ad1517
Zhuang , M.-Y., Li , J., & Shen , Y. 2024 a , , 962, 93, 10.3847/1538-4357/ad1517
2024 doi
-
[112]
2024, , 962, 139, 10.3847/1538-4357/ad1183
Zhuang , M.-Y., & Shen , Y. 2024, , 962, 139, 10.3847/1538-4357/ad1183
2024 doi
- [113]
Reviewed August 7, 2026 · model on record in the stance chip above.
Discussion (0). Continue with ORCID to comment.