REVIEW 4 major objections 6 minor 108 references
A new edge-selection procedure, RECON, turns noisy group-LASSO ODE estimates into nearly perfect directed regulatory networks, cutting spurious edges from 239 to zero in simulations and exposing distinct pre- and post-transplant microbial r
Reviewed by Pith at T0; open to challenge. T0 means a machine referee read the full paper against a public rubric. the ladder, T0–T4 →
T0 review · deepseek-v4-flash
2026-08-01 06:33 UTC pith:4OPFRT6B
load-bearing objection RECON is an honest, incremental extension of GRADE whose GMM threshold convincingly kills spurious edges in clean simulations, but the separation assumption is untested, results are single-run, and no code is released. the 4 major comments →
Reconstruction of Enhanced Causal Omnidirectional Network (RECON)
The pith
A machine-rendered reading of the paper's core claim, the machinery that carries it, and where it could break.
Core claim
The paper establishes that an adaptive threshold placed at the largest relative gap between clusters of normalized regulatory strengths effectively separates true edges from estimation noise in an integral-based additive nonparametric ODE model. After fitting the model with group LASSO, RECON normalizes each node's estimated edge strengths, clusters the pooled normalized strengths with a Gaussian Mixture Model, and selects the cluster boundary with the maximum drop ratio between adjacent clusters. This boundary becomes the cutoff for edge inclusion. In simulations, the procedure retains all or nearly all true directed edges while driving false positives to zero or near zero, improving on the
What carries the argument
The load-bearing object is the data-driven edge threshold built from normalized regulatory strengths. For each node, the estimated L2 norms of group-LASSO coefficients are normalized to [0,1], pooled across nodes, clustered by a Gaussian Mixture Model, and the optimal cluster boundary is chosen by the maximum ratio of the smallest strength in a large-strength cluster to the largest strength in the adjacent small-strength cluster (Equation 19). This threshold converts the dense set of nonzero estimates into a sparse, signed, weighted omnidirectional adjacency matrix. The rest of the pipeline—local polynomial or PACE smoothing, basis expansion, integrated basis functions, and group-LASSO estim
Load-bearing premise
The edge cutoff assumes that the estimated strengths of true and spurious edges form well-separated clusters, so that the largest gap between GMM clusters is the correct boundary; if the strength distributions overlap, the threshold will either keep spurious edges or drop true ones.
What would settle it
Run RECON on a simulation where the weakest true edge has an estimated strength comparable to the strongest spurious edge (for example, by adding a true edge with a very small coefficient while keeping noise at the same level). If the GMM maximum-ratio threshold then fails to recover that true edge without adding spurious ones, the separation assumption is violated and the paper's headline claim collapses.
If this is right
- If correct, regulatory network reconstruction from discretely observed time courses can be made nearly spurious-free without sacrificing true edges, making ODE-based inference practical for noisy biological data.
- The method extends ODE-based reconstruction to sparse, irregular longitudinal sampling designs, which are common in clinical microbiome studies, by interpolating subject-specific trajectories onto a common dense grid.
- Modeling edge effects as time-varying functions allows networks to be studied dynamically: regulatory relationships can strengthen, weaken, or reverse over the observation window, which is invisible to constant-coefficient methods.
- The signed and weighted omnidirectional output supports direct biological interpretation, including activatory/inhibitory roles, keystone-node identification, and modularity, as demonstrated on pre- and post-transplant gut microbiota networks.
- The reported reduction from 239 to 0 spurious edges in the most challenging simulation is concrete evidence that the threshold can perform well even when the baseline method is very noisy.
Where Pith is reading between the lines
- The method's success depends on the empirical separation between true and spurious edge strengths; if that separation is absent or weak in other applications, the GMM threshold may either retain spurious edges or drop legitimate weak regulators. This is a testable limitation not addressed theoretically in the paper.
- The real-data 'causal' interpretation carries the implicit assumption that the additive nonparametric ODE structure (including the dropped basis-expansion residual in Section 3.3) is a faithful description of gut microbial dynamics. A reader should treat the inferred pre/post-transplant regulatory differences as hypothesis-generating rather than confirmatory.
- The threshold logic could be transferred to other sparse-estimation settings where group coefficients need hard-thresholding, though doing so would require re-establishing the separation property for each new problem.
- The paper's five simulation studies all use block-structured ground truths; a natural next test would be a scale-free network or one with heterogeneous edge strengths, where the gap between true and spurious strengths might be less pronounced.
Editorial analysis
A structured set of objections, weighed in public.
Referee Report
Summary. The paper proposes RECON, an integral-based additive nonparametric ODE approach for reconstructing directed, signed, dynamic regulatory networks from longitudinal data. Methodologically, RECON estimates regulatory functions through B-spline expansions and group LASSO, then applies a data-driven threshold constructed from Gaussian mixture modeling and a maximum-ratio criterion to remove spurious edges. The paper claims that across five simulation studies RECON consistently outperforms GRADE, reducing spurious edges to zero or near zero while retaining true edges, and it applies the method to a longitudinal gut microbiota dataset from allo-HCT patients, reporting pre- and post-transplant networks with candidate keystone taxa.
Significance. If the reported results hold, RECON would provide a practical improvement over GRADE by adding a principled-looking, data-driven edge-selection step to a well-established nonparametric ODE framework, while also extending applicability to sparse irregular longitudinal designs. The real-data analysis addresses an important clinical dataset and offers falsifiable, network-level hypotheses about microbial regulation after transplantation. However, the central threshold assumption and the single-run simulation evidence are not yet sufficient to support the headline claim of consistent, near-perfect reconstruction. No circular reasoning is apparent: the GMM threshold is based on estimated edge strengths without using true adjacency labels, and the GRADE comparison uses identical model estimates with a different post-hoc threshold.
major comments (4)
- [§3.4, Eq. (19)] The threshold selection procedure assumes that normalized strengths of true and spurious edges are well separated and that the largest ratio min(C_l)/max(C_{l+1}) identifies the correct boundary. This assumption is load-bearing: the headline result of reducing spurious edges from 239 to 0 (Simulation 1-II) occurs in a design where each target node has exactly one true incoming edge, so after per-node normalization the true edge has strength 1 and spurious edges are near 0. The paper provides no theoretical or empirical support for the separation in other configurations, and the procedure is undefined when BIC selects K=1. The authors should either provide a theoretical characterization of the gap or demonstrate robustness through simulations with overlapping strength distributions, heterogeneous true degrees, and multiple true edges per node.
- [§4.3 and Tables 1–5] All simulation results appear to be single runs with no standard errors, confidence intervals, or repeated-seed analysis. The claim that RECON 'consistently outperforms' GRADE cannot be evaluated from one realization per setting, particularly when AUC values are reported to four decimal places. Additionally, the reported 'AUC-ROC' is computed as (1 + TPR - FPR)/2, which is a linear transformation of a single operating point, not the area under an ROC curve. This metric is misleading as an AUC and should either be computed as a proper area over a range of thresholds or renamed. Repeated Monte Carlo simulation and a correctly defined AUC are needed before the comparative claim is supported.
- [§3.3, Eqs. (12)–(14)] The residual integral term sum_k ∫ δ_jk(X_k(u;θ)) du is dropped as negligible, but no justification or numerical check is provided. This is especially concerning for the nonlinear Brusselator system in Eq. (31), where the additive B-spline assumption may not hold with a small residual over the trajectory support. The authors should either provide a bound on the dropped term or report a simulation diagnostic comparing fitted and true regulatory functions to show that the omission does not materially bias the estimated edge strengths in any of the five settings.
- [§5.2–5.3] The real-data networks are interpreted as 'causal' and used to identify keystone taxa and regulatory dynamics, but no sensitivity analysis is given for the threshold selection or for preprocessing choices (PACE tuning, GMM/BIC, the maximum-ratio boundary). Since the entire network topology depends on the threshold in Eq. (19), the biological conclusions in Section 5 could change under a different but equally reasonable threshold. The authors should report how edge counts, modularity, and keystone identifications vary with the threshold and with reasonable perturbations of the preprocessing steps.
minor comments (6)
- [§4.3] The sentence 'smaller TP or larger FN indicates possible model misclassification' is confusing; smaller TP is not a sign of better performance, and the intended meaning should be rephrased.
- [§3.4, Eq. (18)] Since group LASSO estimates are rarely exactly zero in finite samples, the definition of G^GRADE using strict positivity is not numerically operational as stated; the paper should clarify how zero coefficients are identified in practice.
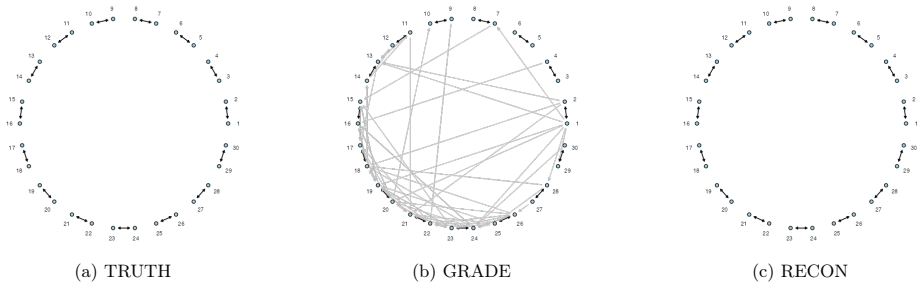
- [Figures 1, 4–8] Gray arrows for spurious edges are difficult to distinguish from black arrows in small print; adding a separate panel with FP-only edges or using dashed/solid styles would improve readability.
- [References] Several reference entries are incomplete or inconsistently formatted, e.g., [11], [73], and [80] mix 'et al.' styles or omit author lists. A careful reference cleanup is needed.
- [§5.1] The sentence describing the filtering result is slightly confusing: 29 families are retained in total, with 21 common and 4 unique to each period, giving p=25 per window. This should be stated more directly to avoid implying 29 per window.
- [Reproducibility] The paper does not state whether simulation code or seeds are available. The interactive figures are useful, but providing the underlying analysis code and simulation scripts would strengthen reproducibility, especially given the single-run simulation concern.
Circularity Check
No significant circularity: RECON's threshold is unsupervised, benchmark evaluations use external ground truth, and load-bearing citations are to independent groups.
full rationale
RECON's central innovation is the threshold rule in Eq. (19). The threshold is computed entirely from estimated edge strengths: T_j = {||θ̂_jk||_2}, normalized per node to form T̃, clustered by GMM, and separated by the maximum-ratio criterion. This procedure never consults the true adjacency matrix G*, so the simulation 'predictions' (TP/FP/FN) are not fit-renamed-as-prediction; they are evaluated against G* after the fact in Section 4.3. The GRADE comparison uses the same group-LASSO estimates from Eq. (16) and differs only in the post-hoc threshold, so the claimed improvement is a genuine empirical comparison rather than an identity. No load-bearing self-citation appears: the algorithm builds on Chen et al. [11], Henderson & Michailidis [33], Meier et al. [58], and Wu et al. [95], none of whose authors overlap with the present paper, and no 'uniqueness theorem' from prior work by the same authors is invoked. The residual function δ_jk 'assumed to be small in practice' (Section 3.2) and the GMM/max-ratio separation premise (Section 3.4) are assumptions about approximation quality and cluster separability; they are potential correctness or robustness risks—for example, the method is undefined if GMM selects K=1, and no theory guarantees that the largest drop ratio corresponds to the true/spurious boundary. But these are not circular because neither assumption is defined in terms of the true edges being predicted. The paper even acknowledges the difficulty ('it is unclear how small an estimated strength should be'), showing the threshold is not assumed to be known. The headline simulation result may be questioned on design/external-validity grounds, but that is not circularity. I therefore find no step in the derivation chain that reduces to its own input.
Axiom & Free-Parameter Ledger
free parameters (4)
- group LASSO penalty lambda_{n,j} =
selected by BIC; not reported
- GMM cluster count K =
selected by BIC; not reported
- B-spline basis size M =
not reported
- Number of PACE eigenfunctions A_j =
selected by AIC; not reported
axioms (5)
- domain assumption The true ODE regulatory function f_j is additive: f_j(X) = sum_k f_jk(X_k) (Eq. 8).
- ad hoc to paper Basis-expansion residual delta_jk is small and its integral is dropped (Section 3.3).
- domain assumption All subjects share one ODE system with subject-specific intercepts (Section 3.1, Eq. 3).
- ad hoc to paper There is a well-separated gap between normalized strengths of true and spurious edges, and the largest GMM gap is the correct cutoff (Section 3.4, Eq. 19).
- domain assumption The ODE model is a valid causal generative model, so inferred edges are causal (Sections 1 and 3.4).
read the original abstract
Learning a dynamical system and reconstructing the underlying regulatory network from $p$ discretely observed state trajectories remain challenging problems. Existing approaches often produced a large number of spurious edges and suffered from several methodological limitations. We propose a new approach, Reconstruction of Enhanced Causal Omnidirectional Network (RECON), that leverages an integral-based additive nonparametric ODE model to reconstruct regulatory networks from $p$ time-course data. RECON incorporates five methodological advances. First, it incorporates a new data-driven edge selection procedure that substantially reduces spurious edges while preserving true regulatory edges. Second, it reconstructs an omnidirectional network that captures causal regulatory relationships rather than merely statistical associations or noise artifacts. Third, it substantially broadens the applicability of standard ODE-based approaches by accommodating both dense regular and sparse irregular longitudinal sampling scenarios. Fourth, it models both node trajectories and edge regulatory effects as time-varying functions, emphasizing a dynamic regulatory network. Fifth, it reconstructs a signed and weighted regulatory network and provides comprehensive network interpretation through two-way direction, activatory/inhibitory indicator, and strength, together with keystone node identification and topological structure. Across five simulation studies, RECON consistently outperforms GRADE by removing nearly all spurious edges while retaining nearly all true regulatory edges, resulting in highly accurate network reconstruction. In the most challenging scenario, the number of spurious edges is reduced from 239 to 0.
Figures




Reference graph
Works this paper leans on
-
[1]
visNetwork: Network Visualization using ’vis.js’ Library, July 2015
Almende B.V., Benoit Thieurmel, , and Contributors. visNetwork: Network Visualization using ’vis.js’ Library, July 2015. URL https://CRAN.R-project.org/package=visNetwork. Institution: Comprehensive R Archive Network Pages: 2.1.4
2015
-
[2]
Albert-László Barabási and Zoltán N. Oltvai. Network biology: understanding the cell’s functional organization.Nature Reviews Genetics, 5(2):101–113, February 2004. ISSN 1471-0056, 1471-0064. doi: 10.1038/nrg1272. URLhttps://www.nature.com/articles/nrg1272. 27
doi:10.1038/nrg1272 2004
-
[3]
David Berry and Stefanie Widder. Deciphering microbial interactions and detecting keystone species with co-occurrence networks.Frontiers in Microbiology, 5, May 2014. ISSN 1664-302X. doi: 10.3389/fmicb.2014.00219. URL http://journal.frontiersin.org/article/10.3389/fmicb.2014. 00219/abstract
arXiv 2014
-
[4]
Vincent D Blondel, Jean-Loup Guillaume, Renaud Lambiotte, and Etienne Lefebvre. Fast unfolding of communities in large networks.Journal of Statistical Mechanics: Theory and Experiment, 2008 (10):P10008, October 2008. ISSN 1742-5468. doi: 10.1088/1742-5468/2008/10/P10008. URLhttps: //iopscience.iop.org/article/10.1088/1742-5468/2008/10/P10008
-
[5]
Ulrik Brandes. A faster algorithm for betweenness centrality*.The Journal of Mathematical Sociology, 25(2):163–177, June 2001. ISSN 0022-250X, 1545-5874. doi: 10.1080/0022250X.2001.9990249. URL http://www.tandfonline.com/doi/abs/10.1080/0022250X.2001.9990249
arXiv 2001
-
[6]
A. J. Butte and I. S. Kohane. MUTUAL INFORMATION RELEVANCE NETWORKS: FUNCTIONAL GENOMIC CLUSTERING USING PAIRWISE ENTROPY MEASUREMENTS. InBiocomputing 2000, pages 418–429, Honolulu, Hawaii, USA, December 1999. WORLD SCIENTIFIC. ISBN 978-981- 02-4188-9 978-981-4447-33-1. doi: 10.1142/9789814447331-0040. URLhttp://www.worldscientific. com/doi/abs/10.1142/97...
-
[7]
Geraldine O. Canny and Beth A. McCormick. Bacteria in the Intestine, Helpful Residents or Enemies from Within?Infection and Immunity, 76(8):3360–3373, August 2008. ISSN 0019-9567, 1098-5522. doi: 10.1128/IAI.00187-08. URLhttps://journals.asm.org/doi/10.1128/IAI.00187-08
-
[8]
Fanny Canon, Thibault Nidelet, Eric Guédon, Anne Thierry, and Valérie Gagnaire. Understanding the Mechanisms of Positive Microbial Interactions That Benefit Lactic Acid Bacteria Co-cultures.Frontiers in Microbiology, 11:2088, September 2020. ISSN 1664-302X. doi: 10.3389/fmicb.2020.02088. URL https://www.frontiersin.org/article/10.3389/fmicb.2020.02088/full
arXiv 2088
-
[9]
Camille Champion, Raphaëlle Momal, Emmanuelle Le Chatelier, Mathilde Sola, Mahendra Mariadassou, and Magali Berland. OneNet—One network to rule them all: Consensus network inference from microbiome data.PLOS Computational Biology, 20(12):e1012627, December 2024. ISSN 1553-7358. doi: 10.1371/journal.pcbi.1012627. URLhttps://dx.plos.org/10.1371/journal.pcbi.1012627
-
[10]
Lan-Yun Chang, Ting-Yi Hao, Wei-Jie Wang, and Chun-Yu Lin. Inference of single-cell network using mutual information for scRNA-seq data analysis.BMC Bioinformatics, 25(S2):292, Septem- ber 2024. ISSN 1471-2105. doi: 10.1186/s12859-024-05895-3. URL https://bmcbioinformatics. biomedcentral.com/articles/10.1186/s12859-024-05895-3
-
[11]
S. Chen, A. Shojaie, et al. Network reconstruction from high-dimensional ordinary differential equations. J. Am. Stat. Assoc., 112, 2017. doi: 10.1080/01621459.2016.1229197. URLhttps://doi.org/10.1080/ 01621459.2016.1229197
arXiv 2017
-
[12]
Maria Chuvochina, Aaron J Mussig, Pierre-Alain Chaumeil, Adam Skarshewski, Christian Rinke, Donovan H Parks, and Philip Hugenholtz. Proposal of names for 329 higher rank taxa defined in the Genome Taxonomy Database under two prokaryotic codes.FEMS Microbiology Letters, 370:fnad071, January 2023. ISSN 1574-6968. doi: 10.1093/femsle/fnad071. URL https://aca...
-
[13]
F. De Luca and Y. Shoenfeld. The microbiome in autoimmune diseases.Clinical and Experimental Immunology, 195(1):74–85, January 2019. ISSN 1365-2249. doi: 10.1111/cei.13158
-
[14]
Franciska T. De Vries, Rob I. Griffiths, Mark Bailey, Hayley Craig, Mariangela Girlanda, Hyun Soon Gweon, Sara Hallin, Aurore Kaisermann, Aidan M. Keith, Marina Kretzschmar, Philippe Lemanceau, Erica Lumini, Kelly E. Mason, Anna Oliver, Nick Ostle, James I. Prosser, Cecile Thion, Bruce Thomson, and Richard D. Bardgett. Soil bacterial networks are less sta...
-
[15]
Andreia Dionisio, Rui Menezes, et al. Mutual information: a measure of dependency for nonlinear time series.Physica A: Statistical Mechanics and its Applications, 344(1-2):326–329, December 2004. ISSN 03784371. doi: 10.1016/j.physa.2004.06.144. URL https://linkinghub.elsevier.com/retrieve/ pii/S0378437104009598
-
[16]
Faizan Ehsan Elahi and Ammar Hasan. A method for estimating Hill function-based dynamic models of gene regulatory networks.Royal Society Open Science, 5(2):171226, February 2018. ISSN 2054-5703. doi: 10.1098/rsos.171226. URL https://royalsocietypublishing.org/doi/10.1098/rsos.171226
-
[17]
Eubank.Nonparametric regression and spline smoothing
Randall L. Eubank.Nonparametric regression and spline smoothing. Number 157 in Statistics. M. Dekker, New York, 2nd ed edition, 1999. ISBN 978-0-8247-9337-1
1999
-
[18]
Number v.66 in Chapman and Hall/CRC Monographs on Statistics and Applied Probability
Jianqing Fan and Irène Gijbels.Local Polynomial Modelling and Its Applications: Monographs on Statistics and Applied Probability 66. Number v.66 in Chapman and Hall/CRC Monographs on Statistics and Applied Probability. Routledge, Boca Raton, 2018. ISBN 978-0-412-98321-4 978-1-351-43481-2
2018
-
[19]
Karoline Faust and Jeroen Raes. Microbial interactions: from networks to models.Nature Reviews Microbiology, 10(8):538–550, August 2012. ISSN 1740-1526, 1740-1534. doi: 10.1038/nrmicro2832. URL https://www.nature.com/articles/nrmicro2832
-
[20]
Karoline Faust and Jeroen Raes. CoNet app: inference of biological association networks using Cytoscape.F1000Research, 5:1519, October 2016. ISSN 2046-1402. doi: 10.12688/f1000research.9050.2. URLhttps://f1000research.com/articles/5-1519/v2
-
[21]
Teng Fei, Tyler Funnell, Nicholas R. Waters, Sandeep S. Raj, Mirae Baichoo, Keimya Sadeghi, Anqi Dai, Oriana Miltiadous, Roni Shouval, Meng Lv, Jonathan U. Peled, Doris M. Ponce, Miguel-Angel Perales, Mithat Gönen, and Marcel R.M. Van Den Brink. Scalable log-ratio lasso regression for enhanced microbial feature selection with FLORAL.Cell Reports Methods, ...
arXiv 2024
-
[22]
Waters, Jenny Paredes, Anqi Dai, Francesca Castro, Jennifer Haber, Ana Gradissimo, Sandeep S
Teng Fei, Victoria Donovan, Tyler Funnell, Mirae Baichoo, Nicholas R. Waters, Jenny Paredes, Anqi Dai, Francesca Castro, Jennifer Haber, Ana Gradissimo, Sandeep S. Raj, Alexander M. Lesokhin, Urvi A. Shah, Marcel R. M. Van Den Brink, and Jonathan U. Peled. Correlating High-dimensional longitudinal microbial features with time-varying outcomes with FLORAL,...
-
[23]
Chris Fraley and Adrian E Raftery. Model-Based Clustering, Discriminant Analysis, and Density Estimation.Journal of the American Statistical Association, 97(458):611–631, June 2002. ISSN 0162- 1459, 1537-274X. doi: 10.1198/016214502760047131. URLhttp://www.tandfonline.com/doi/abs/ 10.1198/016214502760047131
-
[24]
Dallace Francis and Fengzhu Sun. A comparative analysis of mutual information methods for pairwise relationship detection in metagenomic data.BMC Bioinformatics, 25(1):266, August 2024. ISSN 1471-2105. doi: 10.1186/s12859-024-05883-7. URL https://bmcbioinformatics.biomedcentral. com/articles/10.1186/s12859-024-05883-7
-
[25]
Linton C. Freeman. A Set of Measures of Centrality Based on Betweenness.Sociometry, 40(1):35, March 1977. ISSN 00380431. doi: 10.2307/3033543. URLhttps://www.jstor.org/stable/3033543? origin=crossref
arXiv 1977
-
[26]
Garrity and John G
George M. Garrity and John G. Holt. The Road Map to theManual. In William B. Whitman, editor, Bergey’s Manual of Systematics of Archaea and Bacteria, pages 1–70. Wiley, 1 edition, September
-
[27]
Georg K. Gerber. The dynamic microbiome.FEBS Letters, 588(22):4131–4139, November 2014. ISSN 0014-5793, 1873-3468. doi: 10.1016/j.febslet.2014.02.037. URLhttps://febs.onlinelibrary.wiley. com/doi/10.1016/j.febslet.2014.02.037. 29
-
[28]
Z. Ghahramani. Learning dynamic Bayesian networks.Lect. Notes Computer Sci., 1387, 1998. doi: 10.1007/BFb0053999. URLhttps://doi.org/10.1007/BFb0053999
-
[29]
Microbial communities as dynamical systems.Current Opinion in Microbiology, 44:41–49, August 2018
Didier Gonze, Katharine Z Coyte, Leo Lahti, and Karoline Faust. Microbial communities as dynamical systems.Current Opinion in Microbiology, 44:41–49, August 2018. ISSN 13695274. doi: 10.1016/j.mib.2018.07.004. URL https://linkinghub.elsevier.com/retrieve/ pii/S1369527418300092
-
[30]
Bing Guo, Lei Zhang, Huijuan Sun, Mengjiao Gao, Najiaowa Yu, Qianyi Zhang, Anqi Mou, and Yang Liu. Microbial co-occurrence network topological properties link with reactor parameters and reveal im- portance of low-abundance genera.npj Biofilms and Microbiomes, 8(1):3, January 2022. ISSN 2055-5008. doi: 10.1038/s41522-021-00263-y. URLhttps://www.nature.com...
-
[31]
J A Hanley and B J McNeil. The meaning and use of the area under a receiver operating characteristic (ROC) curve.Radiology, 143(1):29–36, April 1982. ISSN 0033-8419, 1527-1315. doi: 10.1148/radiol- ogy.143.1.7063747. URLhttp://pubs.rsna.org/doi/10.1148/radiology.143.1.7063747
-
[32]
Kenji Hashimoto. Emerging role of the host microbiome in neuropsychiatric disorders: overview and future directions.Molecular Psychiatry, 28(9):3625–3637, September 2023. ISSN 1359-4184, 1476-5578. doi: 10.1038/s41380-023-02287-6. URLhttps://www.nature.com/articles/s41380-023-02287-6
-
[33]
J. Henderson and G. Michailidis. Network reconstruction using nonparametric additive ODE models. PLoS ONE, 9, 2014. doi: 10.1371/journal.pone.0094003. URLhttps://doi.org/10.1371/journal. pone.0094003
-
[34]
Environmental stress destabilizes microbial networks.The ISME Journal, 15(6):1722–1734, June 2021
Damian J Hernandez, Aaron S David, Eric S Menges, Christopher A Searcy, and Michelle E Afkhami. Environmental stress destabilizes microbial networks.The ISME Journal, 15(6):1722–1734, June 2021. ISSN 1751-7362, 1751-7370. doi: 10.1038/s41396-020-00882-x. URL https://academic.oup.com/ ismej/article/15/6/1722-1734/7474624
-
[35]
Levine, James L
Ernst Holler, Peter Butzhammer, Karin Schmid, Christian Hundsrucker, Josef Koestler, Katrin Peter, Wentao Zhu, Daniela Sporrer, Thomas Hehlgans, Marina Kreutz, Barbara Holler, Daniel Wolff, Matthias Edinger, Reinhard Andreesen, John E. Levine, James L. Ferrara, Andre Gessner, Rainer Spang, and Peter J. Oefner. Metagenomic Analysis of the Stool Microbiome ...
2014
-
[36]
Gut Microbiota Dysbiosis: Triggers, Consequences, Diagnostic and Therapeutic Options
Tomas Hrncir. Gut Microbiota Dysbiosis: Triggers, Consequences, Diagnostic and Therapeutic Options. Microorganisms, 10(3):578, March 2022. ISSN 2076-2607. doi: 10.3390/microorganisms10030578. URL https://www.mdpi.com/2076-2607/10/3/578
-
[37]
Jenq, Ying Taur, Sean M
Robert R. Jenq, Ying Taur, Sean M. Devlin, Doris M. Ponce, Jenna D. Goldberg, Katya F. Ahr, Eric R. Littmann, Lilan Ling, Asia C. Gobourne, Liza C. Miller, Melissa D. Docampo, Jonathan U. Peled, Nicholas Arpaia, Justin R. Cross, Tatanisha K. Peets, Melissa A. Lumish, Yusuke Shono, Jarrod A. Dudakov, Hendrik Poeck, Alan M. Hanash, Juliet N. Barker, Miguel-...
-
[38]
Crystal N. Johnson, Terence R. Whitehead, Michael A. Cotta, Robert E. Rhoades, and Paul A. Lawson. Peptoniphilus stercorisuis sp. nov., isolated from a swine manure storage tank and description of Peptoniphilaceae fam. nov.International Journal of Systematic and Evolutionary Microbiology, 64 (Pt_10):3538–3545, October 2014. ISSN 1466-5026, 1466-5034. doi:...
-
[39]
doi: 10.1016/j.bbmt.2015.04.016
ISSN 10838791. doi: 10.1016/j.bbmt.2015.04.016. URLhttps://linkinghub.elsevier.com/ retrieve/pii/S1083879115002931
-
[40]
Blainey, and Jonathan Friedman
Jared Kehe, Anthony Ortiz, Anthony Kulesa, Jeff Gore, Paul C. Blainey, and Jonathan Friedman. Pos- itive interactions are common among culturable bacteria.Science Advances, 7(45):eabi7159, November
-
[41]
A meta-analysis of Boolean network models reveals design principles of gene regulatory networks
Claus Kadelka, Taras-Michael Butrie, Evan Hilton, Jack Kinseth, Addison Schmidt, and Haris Serdarevic. A meta-analysis of Boolean network models reveals design principles of gene regulatory networks. Science Advances, 10(2):eadj0822, January 2024. ISSN 2375-2548. doi: 10.1126/sciadv.adj0822. URL https://www.science.org/doi/10.1126/sciadv.adj0822
-
[42]
Mehdi Layeghifard, David M. Hwang, et al. Disentangling Interactions in the Micro- biome: A Network Perspective.Trends in Microbiology, 25(3):217–228, March 2017. ISSN 0966842X. doi: 10.1016/j.tim.2016.11.008. URL https://linkinghub.elsevier.com/retrieve/ pii/S0966842X16301858
-
[43]
Jimeng Lei, Zongheng Cai, Xinyi He, Wanting Zheng, and Jianxiao Liu. An approach of gene regulatory network construction using mixed entropy optimizing context-related likelihood mutual information.Bioinformatics, 39(1):btac717, January 2023. ISSN 1367-4811. doi: 10.1093/bioinformatics/btac717. URL https://academic.oup.com/bioinformatics/article/doi/ 10.1...
-
[44]
Krishnapriya, Dayamrita Kollaparampil Kishanchand, Rishikesh, Siddarthan Venkatachalam, Aneesa Painadath Alikunju, Ayswaria Deepti, Unnikrishnan Sivan, and Baby Chakrapani Pu- likkaparambil Sasidharan. Remodelling the gut ecosystem: a dysbiosis model to elucidate gut- organ axis dynamics in mice.Physiology & Behavior, 299:115000, October 2025. ISSN 003193...
arXiv 2025
-
[45]
Chen Liao, Thierry Rolling, Ana Djukovic, Teng Fei, Vishwas Mishra, Hongbin Liu, Chloe Lindberg, Lei Dai, Bing Zhai, Jonathan U. Peled, Marcel R. M. Van Den Brink, Tobias M. Hohl, and Joao B. Xavier. Oral bacteria relative abundance in faeces increases due to gut microbiota depletion and is linked with patient outcomes.Nature Microbiology, 9(6):1555–1565,...
-
[46]
Cesar Ignacio-Espinosa, Simon Roux, Flora Vincent, Lucie Bittner, Youssef Darzi, Jun Wang, Stéphane Audic, Léo Berline, Gianluca Bontempi, Ana M
Gipsi Lima-Mendez, Karoline Faust, Nicolas Henry, Johan Decelle, Sébastien Colin, Fabrizio Carcillo, Samuel Chaffron, J. Cesar Ignacio-Espinosa, Simon Roux, Flora Vincent, Lucie Bittner, Youssef Darzi, Jun Wang, Stéphane Audic, Léo Berline, Gianluca Bontempi, Ana M. Cabello, Laurent Coppola, Francisco M. Cornejo-Castillo, Francesco d’Ovidio, Luc De Meeste...
2015
-
[47]
Taylor, Camilla Ceccarani, Emily Fontana, Luigi A
Chen Liao, Bradford P. Taylor, Camilla Ceccarani, Emily Fontana, Luigi A. Amoretti, Roberta J. Wright, Antonio L. C. Gomes, Jonathan U. Peled, Ying Taur, Miguel-Angel Perales, Marcel R. M. Van Den Brink, Eric Littmann, Eric G. Pamer, Jonas Schluter, and Joao B. Xavier. Compilation of longitudinal microbiota data and hospitalome from hematopoietic cell tra...
-
[48]
Clive Loader.Local Regression and Likelihood. Statistics and Computing. Springer New York, New York, NY, 1999. ISBN 978-0-387-98775-0 978-0-387-22732-0. doi: 10.1007/b98858. URL https: //link.springer.com/10.1007/b98858
-
[49]
Tao Lu, Hua Liang, Hongzhe Li, and Hulin Wu. High-Dimensional ODEs Coupled With Mixed- Effects Modeling Techniques for Dynamic Gene Regulatory Network Identification.Journal of the American Statistical Association, 106(496):1242–1258, December 2011. ISSN 0162-1459, 1537-274X. doi: 10.1198/jasa.2011.ap10194. URL http://www.tandfonline.com/doi/abs/10.1198/j...
-
[50]
Huang Lin and Shyamal Das Peddada. Analysis of microbial compositions: a review of normalization and differential abundance analysis.NPJ biofilms and microbiomes, 6(1):60, December 2020. ISSN 2055-5008. doi: 10.1038/s41522-020-00160-w. 31
-
[51]
Meng Luo, Jinlin Zhu, Jiajia Jia, Hao Zhang, and Jianxin Zhao. Progress on network modeling and analysis of gut microecology: a review.Applied and Environmental Microbiology, pages e00092–24, February 2024. ISSN 0099-2240, 1098-5336. doi: 10.1128/aem.00092-24. URLhttps://journals.asm. org/doi/10.1128/aem.00092-24
-
[52]
Kevin C. Lutz, Shuang Jiang, Michael L. Neugent, Nicole J. De Nisco, Xiaowei Zhan, and Qiwei Li. A Survey of Statistical Methods for Microbiome Data Analysis.Frontiers in Applied Mathematics and Statistics, 8:884810, June 2022. ISSN 2297-4687. doi: 10.3389/fams.2022.884810. URLhttps: //www.frontiersin.org/articles/10.3389/fams.2022.884810/full
arXiv 2022
-
[53]
Jose Lugo-Martinez, Daniel Ruiz-Perez, Giri Narasimhan, and Ziv Bar-Joseph. Dynamic interaction network inference from longitudinal microbiome data.Microbiome, 7(1):54, December 2019. ISSN 2049-2618. doi: 10.1186/s40168-019-0660-3. URL https://microbiomejournal.biomedcentral.com/ articles/10.1186/s40168-019-0660-3
-
[54]
Deehan, Jens Walter, and Fredrik Bäckhed
Kassem Makki, Edward C. Deehan, Jens Walter, and Fredrik Bäckhed. The Impact of Dietary Fiber on Gut Microbiota in Host Health and Disease.Cell Host & Microbe, 23(6):705–715, June 2018. ISSN 19313128. doi: 10.1016/j.chom.2018.05.012. URL https://linkinghub.elsevier.com/retrieve/ pii/S193131281830266X
-
[55]
Cameron Martino, Amanda Hazel Dilmore, Zachary M. Burcham, Jessica L. Metcalf, Dilip Jeste, and Rob Knight. Microbiota succession throughout life from the cradle to the grave.Nature Reviews Microbiology, 20(12):707–720, December 2022. ISSN 1740-1526, 1740-1534. doi: 10.1038/s41579-022- 00768-z. URLhttps://www.nature.com/articles/s41579-022-00768-z
-
[56]
Ziqi Ma, Tao Zuo, Norbert Frey, and Ashraf Yusuf Rangrez. A systematic framework for understanding the microbiome in human health and disease: from basic principles to clinical translation.Signal Transduction and Targeted Therapy, 9(1):237, September 2024. ISSN 2059-3635. doi: 10.1038/s41392- 024-01946-6. URLhttps://www.nature.com/articles/s41392-024-01946-6
doi:10.1038/s41392- 2024
-
[57]
Kyle C. McGovern and Justin D. Silverman. Scale reliant mixed effects models enhance microbiome data analysis.Microbiome, 14(1):117, March 2026. ISSN 2049-2618. doi: 10.1186/s40168-026-02377-x. URLhttps://link.springer.com/10.1186/s40168-026-02377-x
-
[58]
The Group Lasso for Logistic Regression.Journal of the Royal Statistical Society Series B: Statistical Methodology, 70(1):53–71, February 2008
Lukas Meier, Sara Van De Geer, et al. The Group Lasso for Logistic Regression.Journal of the Royal Statistical Society Series B: Statistical Methodology, 70(1):53–71, February 2008. ISSN 1369-7412, 1467-
2008
-
[59]
B.W. Matthews. Comparison of the predicted and observed secondary structure of T4 phage lysozyme. Biochimica et Biophysica Acta (BBA) - Protein Structure, 405(2):442–451, October 1975. ISSN 00052795. doi: 10.1016/0005-2795(75)90109-9. URL https://linkinghub.elsevier.com/retrieve/ pii/0005279575901099
arXiv 1975
-
[60]
Tree-based Inference of Species Interaction Network from Abundance Data, 2019
Raphaëlle Momal, Stéphane Robin, Christophe Ambroise, et al. Tree-based Inference of Species Interaction Network from Abundance Data, 2019. URLhttps://arxiv.org/abs/1905.02452. Version Number: 2
Pith/arXiv arXiv 2019
-
[61]
Springer New York, New York, NY, 2013
Radhakrishnan Nagarajan, Marco Scutari, et al.Bayesian Networks in R: with Applications in Systems Biology. Springer New York, New York, NY, 2013. ISBN 978-1-4614-6445-7 978-1-4614-6446-4. doi: 10.1007/978-1-4614-6446-4. URLhttps://link.springer.com/10.1007/978-1-4614-6446-4
-
[62]
Nguyen, Kate A
Chi L. Nguyen, Kate A. Markey, Oriana Miltiadous, Anqi Dai, Nicholas Waters, Keimya Sadeghi, Teng Fei, Roni Shouval, Bradford P. Taylor, Chen Liao, John B. Slingerland, Ann E. Slingerland, Annelie G. Clurman, Molly A. Maloy, Lauren Bohannon, Paul A. Giardina, Daniel G. Brereton, Gabriel K. Armijo, Emily Fontana, Ana Gradissimo, Boglarka Gyurkocza, Anthony...
2023
-
[63]
Filtering ASVs/OTUs via mutual information- based microbiome network analysis.BMC Bioinformatics, 23(1):380, September 2022
Elham Bayat Mokhtari and Benjamin Jerry Ridenhour. Filtering ASVs/OTUs via mutual information- based microbiome network analysis.BMC Bioinformatics, 23(1):380, September 2022. ISSN 1471-
2022
-
[64]
Laura-Berenice Olvera-Rosales, Alma-Elizabeth Cruz-Guerrero, Esther Ramírez-Moreno, Aurora Quintero-Lira, Elizabeth Contreras-López, Judith Jaimez-Ordaz, Araceli Castañeda-Ovando, Javier Añorve-Morga, Zuli-GuadalupeCalderón-Ramos, JoséArias-Rico, andLuis-GuillermoGonzález-Olivares. Impact of the Gut Microbiota Balance on the Health–Disease Relationship: T...
-
[65]
Alan R Pacheco and Daniel Segrè. A multidimensional perspective on microbial interactions.FEMS Microbiology Letters, 366(11):fnz125, June 2019. ISSN 1574-6968. doi: 10.1093/femsle/fnz125. URL https://academic.oup.com/femsle/article/doi/10.1093/femsle/fnz125/5513995
-
[66]
Peled, Antonio L.C
Jonathan U. Peled, Antonio L.C. Gomes, Sean M. Devlin, Eric R. Littmann, Ying Taur, Anthony D. Sung, Daniela Weber, Daigo Hashimoto, Ann E. Slingerland, John B. Slingerland, Molly Maloy, Annelie G. Clurman, Christoph K. Stein-Thoeringer, Kate A. Markey, Melissa D. Docampo, Marina Burgos Da Silva, Niloufer Khan, André Gessner, Julia A. Messina, Kristi Rome...
2020
-
[67]
B. . E. Perrin, L. Ralaivola, A. Mazurie, S. Bottani, J. Mallet, and F. d’Alche Buc. Gene networks infer- ence using dynamic Bayesian networks.Bioinformatics, 19, 2003. doi: 10.1093/bioinformatics/btg1071. URLhttps://doi.org/10.1093/bioinformatics/btg1071
-
[68]
MariaNikodemova, ElizabethA.Holzhausen, CourtneyL.Deblois, JodiH.Barnet, PaulE.Peppard, Gar- ret Suen, and Kristen M. Malecki. The effect of low-abundance OTU filtering methods on the reliability and variability of microbial composition assessed by 16S rRNA amplicon sequencing.Frontiers in Cellu- lar and Infection Microbiology, 13:1165295, June 2023. ISSN...
arXiv 2023
-
[69]
Prigogine and G
I. Prigogine and G. Nicolis. On Symmetry-Breaking Instabilities in Dissipative Systems. The Journal of Chemical Physics, 46(9):3542–3550, May 1967. ISSN 0021-9606, 1089-
1967
-
[70]
Bayesian networks.Nature Methods, 12(9):799–800, September 2015
Jorge López Puga, Martin Krzywinski, et al. Bayesian networks.Nature Methods, 12(9):799–800, September 2015. ISSN 1548-7091, 1548-7105. doi: 10.1038/nmeth.3550. URLhttps://www.nature. com/articles/nmeth.3550
-
[71]
Shahzad, Hashir Moheed Kiani, and Muhammad Daud Abdullah Asif
Awais Qureshi, Abdul Wahid, Shams Qazi, Muhammad K. Shahzad, Hashir Moheed Kiani, and Muhammad Daud Abdullah Asif. DynaBiome: interpretable unsupervised learning of gut microbiome dysbiosis via temporal deep models.BMC Bioinformatics, 27(1):71, February 2026. ISSN 1471-2105. doi: 10.1186/s12859-026-06400-8. URLhttps://link.springer.com/10.1186/s12859-026-06400-8
-
[72]
Mohammad Reza Rafimanzelat. Global stabilization of Boolean networks with applications to biomolec- ular network control.Scientific Reports, 15(1):15201, April 2025. ISSN 2045-2322. doi: 10.1038/s41598- 025-97684-y. URLhttps://www.nature.com/articles/s41598-025-97684-y
doi:10.1038/s41598- 2025
-
[73]
Joseph M. Pickard, Melody Y. Zeng, Roberta Caruso, and Gabriel Núñez. Gut microbiota: Role in pathogen colonization, immune responses, and inflammatory disease.Immunological Reviews, 279(1):70–89, September 2017. ISSN 0105-2896, 1600-065X. doi: 10.1111/imr.12567. URL https: //onlinelibrary.wiley.com/doi/10.1111/imr.12567. 33
-
[74]
Alice Risely, Mark A. F. Gillingham, Arnaud Béchet, Stefan Brändel, Alexander C. Heni, Marco Heurich, Sebastian Menke, Marta B. Manser, Marco Tschapka, Wasimuddin, and Simone Sommer. Phylogeny- and Abundance-Based Metrics Allow for the Consistent Comparison of Core Gut Microbiome Diversity Indices Across Host Species.Frontiers in Microbiology, 12:659918, ...
arXiv 2021
-
[75]
Evolution, human-microbe interactions, and life history plasticity.The Lancet, 390(10093):521–530, July
Graham Rook, Fredrik Bäckhed, Bruce R Levin, Margaret J McFall-Ngai, and Angela R McLean. Evolution, human-microbe interactions, and life history plasticity.The Lancet, 390(10093):521–530, July
-
[76]
Eugene Rosenberg. Diversity of bacteria within the human gut and its contribution to the functional unity of holobionts.npj Biofilms and Microbiomes, 10(1):134, November 2024. ISSN 2055-5008. doi: 10.1038/s41522-024-00580-y. URLhttps://www.nature.com/articles/s41522-024-00580-y
-
[77]
Daniel Ruiz-Perez, Jose Lugo-Martinez, Natalia Bourguignon, Kalai Mathee, Betiana Lerner, Ziv Bar- Joseph, and Giri Narasimhan. Dynamic Bayesian Networks for Integrating Multi-omics Time Series Mi- crobiome Data.mSystems, 6(2):e01105–20, March 2021. ISSN 2379-5077. doi: 10.1128/mSystems.01105- 20
-
[78]
Musfiqur Sazal, Kalai Mathee, Daniel Ruiz-Perez, Trevor Cickovski, and Giri Narasimhan. Inferring directional relationships in microbial communities using signed Bayesian networks.BMC Genomics, 21(S6):663, December 2020. ISSN 1471-2164. doi: 10.1186/s12864-020-07065-0. URL https:// bmcgenomics.biomedcentral.com/articles/10.1186/s12864-020-07065-0
-
[79]
Pradeep Ravikumar, John Lafferty, Han Liu, and Larry Wasserman. Sparse Additive Models.Journal of the Royal Statistical Society Series B: Statistical Methodology, 71(5):1009–1030, November 2009. ISSN 1369-7412, 1467-9868. doi: 10.1111/j.1467-9868.2009.00718.x. URLhttps://academic.oup.com/ jrsssb/article/71/5/1009/7092930
arXiv 2009
-
[80]
Brendan Murphy, and Adrian E
Luca Scrucca, Michael Fop, T. Brendan Murphy, and Adrian E. Raftery. mclust 5: Clustering, Classification and Density Estimation Using Gaussian Finite Mixture Models.The R Journal, 8(1): 289–317, August 2016. ISSN 2073-4859
2016
discussion (0)
Sign in with ORCID, Apple, or X to comment. Anyone can read and Pith papers without signing in.