REVIEW 2 major objections 5 minor 2 cited by
This paper claims that a lightweight 3D climate emulator trained on 30 years of reanalysis data, with CO2 as an input, reproduces observed surface warming and stratospheric cooling under rising CO2 and stays flat when CO2 is fixed.
Reviewed by Pith at T0; open to challenge. T0 means a machine referee read the full paper against a public rubric. the ladder, T0–T4 →
A lightweight 3D climate emulator trained on 30 years of reanalysis reproduces CO2-driven surface warming and stratospheric cooling with long-term stability.
T0 review reviewed 2026-08-05 challenge →
load-bearing objection Solid, honest 3D emulator work; the missing train/eval split makes the headline CO2-forcing claim unproven as written. the 2 major comments →
LUCIE-3D: A three-dimensional climate emulator for forced responses
The pith
A machine-rendered reading of the paper's core claim, the machinery that carries it, and where it could break.
The reading
Core claim
The paper argues that LUCIE-3D reproduces the climate system's forced response to increasing CO2: global-mean surface temperature warms at +0.20 K per decade under observed CO2, almost identical to ERA5's +0.205 K per decade, while stratospheric temperature cools at -0.66 K per decade (ERA5: -0.47). When CO2 is held fixed at 1981 values, the surface trend drops to -0.015 K per decade and the stratosphere shows only a weak positive drift. The same separation holds in a variant with prescribed SST forcing. The authors conclude from this contrast that the model 'has not memorized the effect of CO2 but has learned the relationship between the dynamics and the forcing.' They further show the mode
What carries the argument
The central mechanism is a Spherical Fourier Neural Operator (SFNO) backbone combined with an Euler-integration tendency constraint: the model ingests current prognostic fields plus forcing variables (including monthly CO2 interpolated to six-hourly values) and outputs the fields at the next time step. The architecture is extended to twelve layers with a latent dimension of 256 and trained on eight sigma levels spanning the troposphere and stratosphere, which the paper argues is essential for capturing equatorial Kelvin waves and the vertical structure of the forced response. A two-phase training scheme with validation-loss-scaled weighting and a spectral regularizer is used to maintain long
Load-bearing premise
The 30 years of ERA5 training data must not overlap the 1981-1990 and 2010-2020 decades used to evaluate the warming trend; the paper does not state the exact training years.
What would settle it
Inspect the released code and data record to determine the exact 30-year training interval; if it includes 1981-1990 or 2010-2020, the reported trend reproduction is an in-sample fit and the central claim is not established. Alternatively, train the same model only on data before 1990 and test its CO2-driven trend on 1991-2020: if the trend disappears, the learned-mapping claim fails.
If this is right
- If the claim holds, a model trained on only 30 years of reanalysis data can produce credible decadal trends in surface temperature and stratospheric temperature under realistic CO2 forcing.
- The near-flat response under stationary CO2 suggests the emulator could be used to isolate the forced component of climate change in a way that is transparent and cheap to run.
- The ability to spin up from arbitrary initial states, including a 'zero atmosphere,' points toward use in paleoclimate and idealized dynamical experiments where initial conditions are uncertain.
- The model's AMIP-style SST-forced variant provides a testbed for coupled ocean-atmosphere emulation, though the paper notes two-way coupling is still missing.
- The reported training cost (under five hours on four GPUs) makes systematic ablation studies of architecture and loss design feasible for a wider community.
Where Pith is reading between the lines
- A natural testable extension is a strict temporal holdout: train only on years before 1990 and evaluate the CO2 response on 1991-2020. The paper does not report such a split, and the central 'learned mapping' conclusion would be much stronger if the trend persists out-of-sample.
- If the learned mapping is real, the emulator could be probed with single-forcing Green's function perturbations to recover its linear response kernel, connecting to the GFMIP-style protocol the paper cites as future work.
- The stationary-CO2 experiment is a within-distribution counterfactual, so it demonstrates sensitivity to the forcing variable but does not by itself establish extrapolation to CO2 levels far outside the training range.
- The underwhelming response to +2 K and +4 K SST perturbations suggests that despite the CO2 result, the model's extrapolation to strong boundary forcings remains limited, which the paper acknowledges.
Editorial analysis
A structured set of objections, weighed in public.
Referee Report
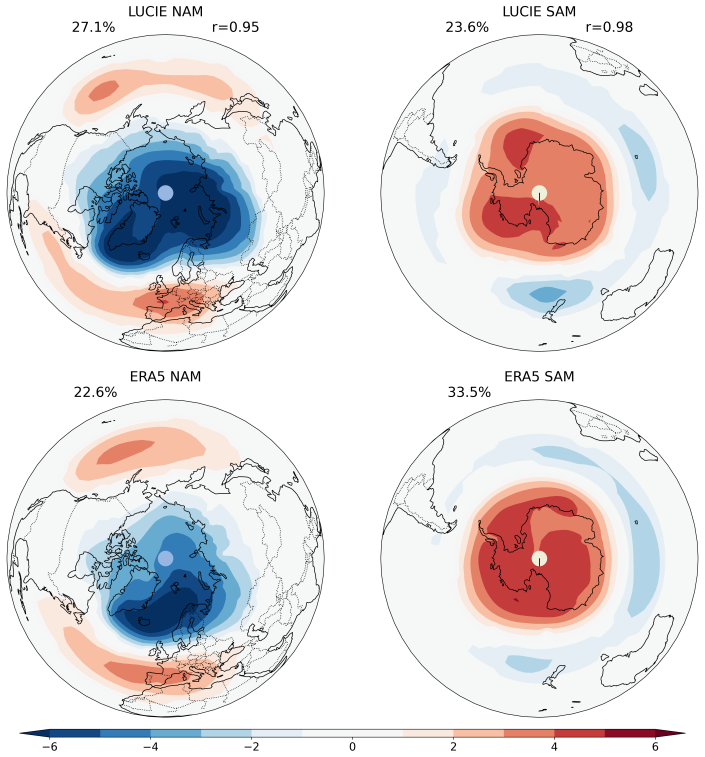
Summary. LUCIE-3D is a three-dimensional climate emulator built on a Spherical Fourier Neural Operator, trained on 30 years of ERA5 data at eight sigma levels, with atmospheric CO2 and optionally SST as forcing inputs. The paper reports that the model reproduces ERA5 climatology, variability (Kelvin waves, MJO, annular modes), long-term forced responses (surface warming and stratospheric cooling under increasing CO2), and remains stable over 40-year integrations. It also documents spin-up from climatological and 'zero-atmosphere' initial conditions, and a stationary-CO2 control that yields near-zero trends. The central claim (Section 4.2) is that the model has not memorized the CO2 effect but has learned a physically consistent dynamics-forcing relationship.
Significance. If the central claim is supported, LUCIE-3D would be a valuable lightweight tool for rapid climate experimentation, ablation studies, and exploratory paleoclimate/future-scenario work, complementing larger emulators like ACE2 and CAMulator. The paper has notable strengths: the code and trained models are released, the model demonstrably remains stable over 40-year simulations, spin-up from strongly out-of-distribution initial states is examined, and diagnostics such as the Wheeler–Kiladis diagram, annular modes, and PDF tails provide a broad evaluation. The main weakness is that the evidence for the 'learned relationship' claim depends on an unspecified training/evaluation split and on an interpretation of the stationary-CO2 experiment that is not fully warranted. These issues are addressable and do not invalidate the engineering contribution, but they are load-bearing for the paper's headline claim.
major comments (2)
- [Sections 2 and 4.2] The training period is never specified: Section 2 says only '30 years of ERA5 reanalysis data', while Figure 1 and Figure 2 evaluate the 1981–2020 period, and the climate-change response is computed as a difference between 1981–1990 and 2010–2020. If the 30 training years lie inside this 40-year window, the reported forced response is partly or entirely an in-sample fit. This matters because the central claim that LUCIE-3D 'has not memorized the effect of CO2' (Section 4.2) rests on this response being an out-of-sample generalization. Please state the exact training years and, if any overlap exists, provide a non-overlapping train/test evaluation (e.g., train on 1990–2020 and validate on 1981–1989) or otherwise demonstrate that the reported trends are not fitted values.
- [Section 4.2 and Section 5] The stationary-CO2 experiment is a useful control, but it does not by itself establish a physically generalizable forcing–response mapping. A model trained on a period with a strong secular CO2 increase could learn to map any constant CO2 input to the training-era climatology, thereby producing near-zero trends under fixed CO2, without having learned a physical relationship. The paper's own Discussion (Section 5) acknowledges that 'validation on future climates is not possible' but does not address this non-identifiability. A concrete additional test, such as a response to CO2 values outside the historical training range or a Green's-function-style perturbation, is needed before the phrase 'has learned the relationship between the dynamics and the forcing' can be accepted as stated.
minor comments (5)
- [Title page / affiliations] Typo in affiliation: 'Allen Insitute' should be 'Allen Institute'.
- [Figure 7 caption] Caption contains 'Souther Hemisphere Annualr Mode' — should be 'Southern Hemisphere Annular Mode'.
- [Section 4.2] Typo: 'olar amplification' should be 'polar amplification'; also '2+' and '4+K' in the text should be '+2 K' and '+4 K' for consistency.
- [Section 3.1] Missing space in 'att + ∆t'; also 'full-field precipitation' could be clarified as total precipitation (TP) at the next step.
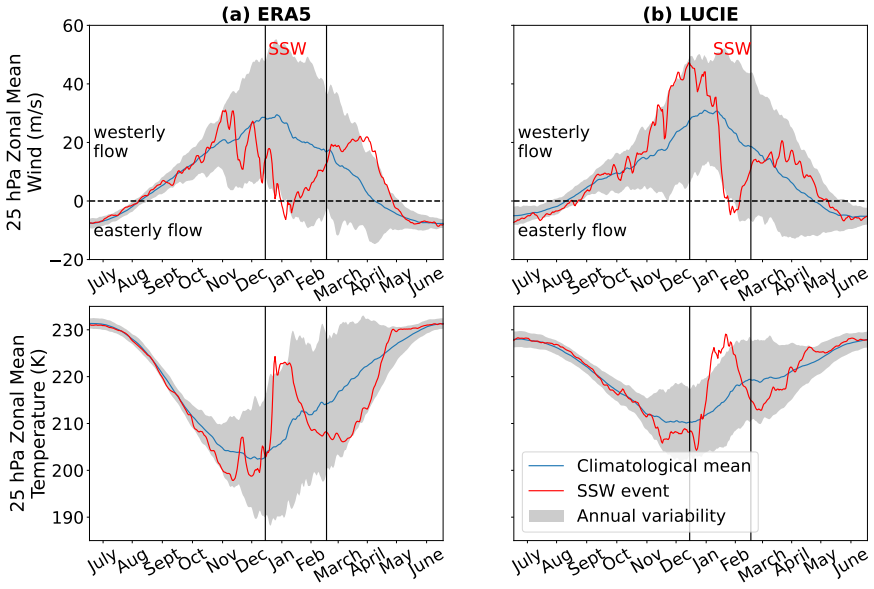
- [Section 4.4] The SSW example says 'inference initialized in 1980' but the training interval is unspecified; please clarify whether the initialization year lies outside the training record, which is directly relevant to the out-of-sample discussion.
Circularity Check
No constructional circularity; central CO2-response claim is supported by an internal stationary-CO2 control, though the train/eval split is unspecified.
full rationale
The paper's central claim (Sec. 4.2) is that LUCIE-3D 'has not memorized the effect of CO2 but has learned the relationship between the dynamics and the forcing.' The evidence is an autoregressive 40-year rollout with observed CO2 reproducing surface warming and stratospheric cooling, and a control with CO2 held at 1981 values yielding near-flat trends. This is not a circular reduction by construction: the model is trained on one-step Euler-integration predictions (Sec. 3.1), so the multi-decadal trend is an emergent property, and the stationary-CO2 experiment directly tests whether the trend is attributable to the CO2 input rather than to internal drift. The +2/+4K SST perturbations and zero-atmosphere spin-up are additional independent stress tests. Self-citations to LUCIE-2D (Guan et al., 2024) describe the architecture and loss but are not used to justify the central climate-response claim. The genuine weakness is that the paper never states the exact 30-year ERA5 training window (Section 2 says only 'trained on 30 years of ERA5 reanalysis data'), while the climate-change evaluation uses 1981–1990 vs 2010–2020 and 40-year trends; if the training window overlaps these decades, part of the trend match would be in-sample. That is a validation/reporting gap, not a constructional circularity, and the paper's own Discussion concedes 'validation on future climate scenarios is not possible' for ERA5-trained models. Thus no circular step can be exhibited from the text as written.
Axiom & Free-Parameter Ledger
free parameters (5)
- Validation-loss scaling constant =
0.005
- logP and T_P loss reduction factor =
0.5
- Spectral regularizer weight =
5e-2
- Architecture hyperparameters =
12 SFNO blocks, latent 256, batch 32, epochs 160, LR 5e-4 to 1e-8
- SST smoothing kernel parameters =
not specified
axioms (5)
- domain assumption ERA5 reanalysis is a sufficiently accurate representation of the real climate system for both training and validation.
- domain assumption The atmospheric state at t+6h is a deterministic Markovian function of the current prognostic variables and the specified forcings (CO2, orography, TISR, land-sea mask, optional SST).
- domain assumption The 30-year training record provides sufficient independent variability in CO2 to learn its radiative effect.
- domain assumption The SFNO architecture at T30 resolution with 8 sigma levels can represent the processes that set the forced response.
- domain assumption The spectral regularizer and Euler integration prevent error accumulation over 40-year runs.
Cite this review
Pith. "Pith review of LUCIE-3D: A three-dimensional climate emulator for forced responses." pith.science (2026). https://pith.science/paper/6KHTXO4T
@misc{pith2026250902061,
  author       = {Pith},
  title        = {Pith review of: LUCIE-3D: A three-dimensional climate emulator for forced responses},
  year         = {2026},
  howpublished = {\url{https://pith.science/paper/6KHTXO4T}},
  note         = {Machine review of arXiv:2509.02061}
}
read the original abstract
We introduce LUCIE-3D, a lightweight three-dimensional climate emulator designed to capture the vertical structure of the atmosphere, respond to climate change forcings, and maintain computational efficiency with long-term stability. Building on the original LUCIE-2D framework, LUCIE-3D employs a Spherical Fourier Neural Operator (SFNO) backbone and is trained on 30 years of ERA5 reanalysis data spanning eight vertical {\sigma}-levels. The model incorporates atmospheric CO2 as a forcing variable and optionally integrates prescribed sea surface temperature (SST) to simulate coupled ocean--atmosphere dynamics. Results demonstrate that LUCIE-3D successfully reproduces climatological means, variability, and long-term climate change signals, including surface warming and stratospheric cooling under increasing CO2 concentrations. The model further captures key dynamical processes such as equatorial Kelvin waves, the Madden--Julian Oscillation, and annular modes, while showing credible behavior in the statistics of extreme events. Despite requiring longer training than its 2D predecessor, LUCIE-3D remains efficient, training in under five hours on four GPUs. Its combination of stability, physical consistency, and accessibility makes it a valuable tool for rapid experimentation, ablation studies, and the exploration of coupled climate dynamics, with potential applications extending to paleoclimate research and future Earth system emulation.
Figures




Forward citations
Cited by 2 Pith papers
-
ACE2-NEMO: Coupling an ML atmospheric emulator to a full-depth dynamical ocean model
The first multi-decadal coupling of an untuned ML atmospheric emulator to a full-depth dynamical ocean is stable and has realistic mean fluxes, yet produces unrealistically weak ENSO and an incorrect short-wave respon...
-
CORDEX-ML-Bench: A Benchmark for Data-Driven Regional Climate Downscaling -Experiment Design and Overview
CORDEX-ML-Bench benchmarks 40 ML models for climate downscaling and finds generative models outperform deterministic ones on precipitation while historically trained models underestimate future climate signals.
Reference graph
Works this paper leans on
-
[4]
Chen, L., Zhong, X., Zhang, F., Cheng, Y ., Xu, Y ., Qi, Y ., and Li, H.: FuXi: A cascade machine learning forecasting system for 15-day global weather forecast, arXiv preprint arXiv:2306.12873,
-
[5]
Cresswell-Clay, N., Liu, B., Durran, D., Liu, Z., Espinosa, Z. I., Moreno, R., and Karlbauer, M.: A deep learning earth system model for efficient simulation of the observed climate, arXiv preprint arXiv:2409.16247,
-
[7]
Hakim, G. J. and Masanam, S.: Dynamical Tests of a Deep Learning Weather Prediction Model, Artificial Intelligence for the Earth Systems, 3, https://doi.org/https://doi.org/10.1175/AIES-D-23-0090.1,
-
[8]
Skilful global seasonal predictions from a machine learning weather model trained on reanalysis data
19 Kent, C., Scaife, A. A., Dunstone, N. J., Smith, D., Hardiman, S. C., Dunstan, T., and Watt-Meyer, O.: Skilful global seasonal predictions from a machine learning weather model trained on reanalysis data, https://arxiv.org/abs/2503.23953,
work page internal anchor Pith review Pith/arXiv arXiv
-
[9]
Lam, R., Sanchez-Gonzalez, A., Willson, M., Wirnsberger, P., Fortunato, M., Alet, F., Ravuri, S., Ewalds, T., Eaton-Rosen, Z., Hu, W., Merose, A., Hoyer, S., Holland, G., Vinyals, O., Stott, J., Pritzel, A., Mohamed, S., and Battaglia, P.: Learning skillful medium-range global weather forecasting, Science, 0, eadi2336, https://doi.org/10.1126/science.adi2336,
-
[10]
Ling, F., Chen, K., Wu, J., Han, T., Luo, J.-J., Ouyang, W., and Bai, L.: FengWu-W2S: A deep learning model for seamless weather-to- subseasonal forecast of global atmosphere, arXiv preprint arXiv:2411.10191,
-
[11]
Pathak, J., Subramanian, S., Harrington, P., Raja, S., Chattopadhyay, A., Mardani, M., Kurth, T., Hall, D., Li, Z., Azizzadenesheli, K., Hassanzadeh, P., Kashinath, K., and Anandkumar, A.: FourCastNet: A global data-driven high-resolution weather model using adaptive Fourier neural operators, arXiv preprint arXiv:2202.11214,
-
[12]
Can AI weather models predict out-of-distribution gray swan tropical cyclones?
Sun, Y . Q., Hassanzadeh, P., Zand, M., Chattopadhyay, A., Weare, J., and Abbot, D. S.: Can AI weather models predict out-of-distribution gray swan tropical cyclones?, arXiv preprint arXiv:2410.14932,
work page internal anchor Pith review Pith/arXiv arXiv
-
[13]
Wang, C., Pritchard, M. S., Brenowitz, N., Cohen, Y ., Bonev, B., Kurth, T., Durran, D., and Pathak, J.: Coupled ocean-atmosphere dynamics in a machine learning earth system model, arXiv preprint arXiv:2406.08632,
-
[14]
K., Henn, B., Duncan, J., Brenowitz, N
Watt-Meyer, O., Dresdner, G., McGibbon, J., Clark, S. K., Henn, B., Duncan, J., Brenowitz, N. D., Kashinath, K., Pritchard, M. S., Bonev, B., et al.: ACE: A fast, skillful learned global atmospheric model for climate prediction, arXiv preprint arXiv:2310.02074,
-
[2017]
Arcomano, T., Szunyogh, I., Wikner, A., Pathak, J., Hunt, B. R., and Ott, E.: A Hybrid Approach to Atmospheric Modeling That Combines Machine Learning With a Physics-Based Numerical Model, Journal of Advances in Modeling Earth Systems, 14, e2021MS002 712, https://doi.org/https://doi.org/10.1029/2021MS002712,
-
[2023]
Chapman, W. E., Schreck, J. S., Sha, Y ., Gagne II, D. J., Kimpara, D., Zanna, L., Mayer, K. J., and Berner, J.: CAMulator: Fast emulation of the community atmosphere model, arXiv preprint arXiv:2504.06007,
-
[2024]
Guan, H., Arcomano, T., Chattopadhyay, A., and Maulik, R.: Lucie: A lightweight uncoupled climate emulator with long-term stability and physical consistency for o (1000)-member ensembles, arXiv preprint arXiv:2405.16297,
-
[2025]
Chattopadhyay, A. and Hassanzadeh, P.: Long-term instabilities of deep learning-based digital twins of the climate system: The cause and a solution, arXiv preprint arXiv:2304.07029,
This paper was first reviewed by deepseek-v4-flash on August 5, 2026.
discussion (0)
Sign in with ORCID, Apple, or X to comment. Anyone can read and Pith papers without signing in.