REVIEW 2 major objections 4 minor 36 references
Every ranked team's building-damage accuracy fell 70–86 percent on disasters absent from training, and leaderboard rank order did not survive.
Reviewed by Pith at T0; open to challenge. T0 means a machine referee read the full paper against a public rubric. the ladder, T0–T4 →
T0 review · deepseek-v4-flash
2026-08-01 08:44 UTC pith:6VHPXIXV
load-bearing objection A solid, honest challenge report whose generalization-gap claim is real but needs per-event numbers to know how much is one hard event. the 2 major comments →
Advancing All-Weather Building Damage Mapping to the Instance Level: Outcomes and Insights from the 2026 Bright Challenge
The pith
A machine-rendered reading of the paper's core claim, the machinery that carries it, and where it could break.
Core claim
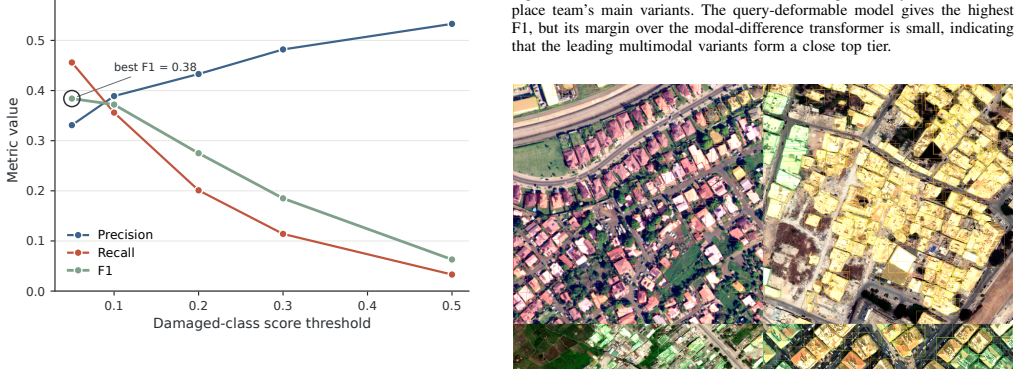
On the paper's own terms, the discovery is that the two regimes of evaluation — a hidden holdout from the same 14 training events and a final test on two events excluded from training — do not rank teams the same way and do not produce comparable scores. The development-phase winner was not the final winner; the holdout winner fell from 0.513 to 0.069 mAP, and every team that competed in both phases dropped by 70–86 percent. The Spearman rank correlation between phases was 0.35, so a large share of in-domain performance reflected fitting the specific development events rather than learning transferable damage representations. The two independently developed winning solutions converged on the
What carries the argument
The mechanism that carries the argument is the two-phase evaluation protocol. In the development phase, submissions are scored on a hidden holdout drawn from the same disaster events as the training set; in the final phase, the same models are scored only on two 2025 events absent from training — a wildfire in California and a hurricane in Jamaica — with different damage compositions and image statistics. Comparing a team's holdout mAP against its test mAP, and the rank correlation between phases (Spearman 0.35), isolates in-domain fitting from true cross-event transfer. The supporting machinery is the instance-level annotation of about 291,000 buildings across 16 events in a standard instan
Load-bearing premise
The evaluation assumes the optical and radar images are already aligned to the same ground coordinates; in real rapid mapping, aligning an archived optical image to a newly tasked radar acquisition is itself an unsolved problem with residual errors of meters, comparable to an entire building footprint.
What would settle it
Run the same challenge submissions on a third disaster event absent from training (for example, a 2026 flood or earthquake): if the holdout-to-test rank correlation rises well above 0.35 and the new top test score approaches the 0.5 in-domain range without test-time adaptation, the paper's conclusion that in-domain accuracy does not predict cross-event transfer would not hold for that broader set.
If this is right
- If correct, leaderboard scores on a fixed collection of past disasters cannot be read as operational readiness; genuinely unseen events must be part of any evaluation claiming to measure deployment performance.
- Models should be selected under event-holdout validation — train on all events but one and validate on the held-out event — because the second-place team's internal test reproduced the phase gap, with mAP dropping from 0.267 under a standard split to 0.148 under an event holdout.
- The transferable recipe is to localize buildings from the pre-event optical image first, then classify damage using post-event radar as evidence through staged or late fusion, with explicit calibration of severity boundaries.
- Unlabeled imagery of the target event carries usable information about its damage profile; adaptively re-calibrating class thresholds and self-training on high-confidence pseudo-labels lifted the first-place team's test mAP from 0.1095 to 0.1815.
- A single mAP number hides opposite failure modes; reporting per-class AP, per-event scores, footprint recall, and severity calibration separately would track geometric and semantic progress independently.
Where Pith is reading between the lines
- Beyond the paper, the co-registration premise means the reported 0.18 mAP is an upper bound for operational settings: if alignment is instead part of the task, multi-meter registration error comparable to a building footprint would lower the absolute scores and likely widen the holdout-to-test gap.
- Beyond the paper, the reversal of class difficulty across phases suggests that damage severity is better modeled as an ordinal scale (intact < damaged < destroyed) with explicit boundary losses rather than three independent nominal classes; a direct comparison of ordinal versus nominal heads on the same data would test this.
- Beyond the paper, the low rank correlation of 0.35 could serve as a diagnostic baseline for future challenge editions: if later multi-event tests show correlations above 0.8, the field will have learned to validate against event shift; if correlations stay low, it would confirm that current validation practice is systematically misleading.
- Beyond the paper, because every team learned the radar encoder from scratch on the challenge data while optical encoders came pre-trained, a radar-specific or damage-specific pretraining resource is a concrete, high-leverage next step; a test would be whether such pretraining raises the damaged-class AP on unseen events more than architecture changes do.
Editorial analysis
A structured set of objections, weighed in public.
Referee Report
Summary. The paper reports the design and outcomes of the 2026 Bright Challenge, the first community evaluation of all-weather building damage mapping at the instance level from a pre-event submeter optical image and a post-event SAR image. The challenge extends the Bright dataset with instance-level annotations for about 291,000 buildings across 16 events, uses a two-phase protocol (in-domain holdout then two unseen 2025 test events), and scores submissions server-side on hidden labels with COCO mAP. The main empirical result is a large generalization gap: the best in-domain holdout mAP was 0.513, while the best test mAP was 0.182; every team that ranked in both phases scored lower on the test events, the holdout winner dropped from 0.513 to 0.069, and the Spearman rank correlation between phases was only 0.35. The paper also describes the two winning solutions, their shared design choices, and lessons for the field, including the instability of severity classes across events and the need for event-level calibration.
Significance. If the generalization-gap result is robust, the paper provides an important and somewhat sobering benchmark finding for remote sensing damage assessment: high in-domain leaderboard accuracy is a weak predictor of cross-event transfer, and instance-level all-weather damage mapping remains far from solved at absolute mAP values near 0.18. The strengths of the paper are substantial: the core numbers are produced by server-side evaluation against hidden labels, with 46 teams and 1,289 submissions; the data, annotations, baseline code, and winning solutions are publicly released; and the paper openly flags its main limitations (n=2 test events, sensor/season confounds, and the co-registration assumption). The per-class and per-event breakdowns (Figs. 4 and 14) and the winner ablations are useful diagnostics beyond the single mAP score. The paper is an outcomes-and-insights report in the best sense: it is transparent about what the numbers do and do not support.
major comments (2)
- [Fig. 5; Section VI-B; Section II-B] The headline rank-instability claim (Spearman rho = 0.35; 'every team dropped sharply'; 'rank order changed substantially') is computed on the official pooled mAP over the two test events. The pooled scalar is likely dominated by the California wildfire event, which packs 7,321 instances into 104 tiles, whereas the Jamaica hurricane has 6,063 instances across 322 tiles (Section II-B). Fig. 14 indeed shows that most leading teams collapse specifically on the wildfire event and perform comparatively well on Jamaica. As written, the abstract and Section VI-B present the transfer failure categorically, even though Section VI-F limits it to two events. Please add a per-event holdout-to-test analysis using the released per-event predictions: per-event Spearman correlations, per-event drop ranges, and a per-event version of the Fig. 5 scatter. Qualify the general claim according to whether the
- [Section VI-A] The 'convergent design lessons' are drawn from exactly two winning solutions, and both teams' members are among the paper's authors (Table III). The paper should state this overlap explicitly in Section VI-A and explain what independent evidence supports the claim that the two teams were developed independently. Without such a statement, a reader cannot fully assess the strength of the 'independently converged' narrative, although the shared recipe is also partially supported by the ablations in Sections IV-C and V-C.
minor comments (4)
- [Section IV-C, Table IV] The first row of Table IV reports a baseline mAP of 0.0409 on the cross-event test set, while the public baseline is reported as 0.021 in Section III-C. If the Table IV baseline is the first-place team's reimplemented single-modality baseline, say so; otherwise the two numbers appear inconsistent.
- [Section V-C versus Fig. 10] The text states that a SAR-only Mask R-CNN reaches an mAP of 0.002, while Fig. 10 shows 0.003. Please reconcile.
- [Fig. 2] The tile label 'T est·CA' contains an extra space; also, the figure would be clearer if the optical and SAR channels were explicitly named in the legend.
- [Section III-C] The comparison of the best holdout score (swift, 0.513) with the best test score (gpt_lh, 0.182) is described as a 'drop of about 65 percent'. This is a comparison between different teams; the per-team drops are reported later. Consider rewording to avoid implying a within-team drop.
Circularity Check
No significant circularity: the central generalization-gap finding is externally grounded; only minor self-citation appears in the design-lessons section.
full rationale
The paper's core result—that in-domain accuracy does not predict cross-event transfer—is an empirical measurement, not a derivation. It rests on server-scored hidden labels for two 2025 events absent from training, 46 independent teams, and a public baseline. The Spearman rho of 0.35 and the 70–86% drops are observed from actual submissions, not reconstructed from fitted parameters or from the paper's own assumptions. No fitted input is renamed as a prediction, and no equation reduces to its own inputs. The paper explicitly acknowledges in Section VI-F that the cross-event test uses only two events, that the reported accuracies presuppose co-registration, and that pseudo-label confirmation bias is not quantified; these are external-validity limitations, not circularity. The only mild concern is in Sections IV–VI-A: the two winning solutions are described as having been developed 'independently,' yet their members are all among this paper's authors and both teams are from the same Wuhan University group (Table III), and their ablations rely on prior work by the same group (refs [20,22–24]). This weakens the independence of the design lessons, but those lessons are not load-bearing for the central generalization-gap finding. The main claim is therefore self-contained against the challenge data and external evaluation; the self-citation is minor and not load-bearing.
Axiom & Free-Parameter Ledger
free parameters (2)
- Per-scene damage-class decision thresholds (first-place solution) =
not disclosed numerically; adjusted per disaster scene (e.g., wildfire: lower destroyed threshold, higher damaged thresh
- Pseudo-label confidence / disaster-consistency filter criterion (first-place solution) =
not disclosed
axioms (5)
- domain assumption Hidden holdout and test labels were never leaked and CodaBench server scores are trustworthy
- domain assumption COCO mAP averaged over IoU 0.50–0.95 is an adequate headline metric for operational damage mapping
- domain assumption Co-registered optical-SAR pairs are provided, isolating damage mapping from alignment
- domain assumption Instance-level annotations (~291k buildings) are accurate: one label per building, few missed buildings
- standard math Standard backbones (Mask R-CNN, Mask2Former, ResNet-50-FPN, YOLO variants) perform as published
read the original abstract
Rapid post-disaster response requires timely, building-level information on whether structures remain intact, are damaged, or are destroyed. Post-event optical imagery, however, may be unavailable because of cloud, smoke, or darkness. The Bright Challenge evaluated all-weather building damage mapping from a submeter-resolution pre-event optical image and a post-event SAR image. Participants were required to detect and delineate each building and assign exactly one of three mutually exclusive damage labels. The challenge extended the globally distributed \textsc{Bright} dataset with instance-level annotations for about 291,000 buildings across 16 disaster events spanning seven disaster types. The final phase was evaluated exclusively on two 2025 events absent from training: a wildfire event in California and a hurricane in Jamaica. A total of 157 participants made 1,289 submissions, and 46 teams entered the final phase. The two winning solutions achieved test mAPs of 0.182 and 0.181, approximately 8.7 times the public baseline of 0.021, but remained far below the best in-domain holdout score of 0.513. Across teams ranked in both phases, performance declined sharply and the rank order changed substantially. The two leading solutions independently favored modality-specific encoding, staged or late optical--SAR fusion, and an optical-dominant separation of building localization from damage recognition. The winning method additionally used scene-aware threshold adjustment and pseudo-label adaptation. These results identify cross-event generalization and stable severity discrimination as the principal remaining challenges. All data, annotations, baseline code, and winning solutions are publicly available at https://github.com/ChenHongruixuan/BRIGHT.
Figures




Reference graph
Works this paper leans on
-
[1]
Global trends in satellite-based emergency mapping,
S. V oigt, F. Giulio-Tonolo, J. Lyons, J. Ku ˇcera, B. Jones, T. Schneider- han, G. Platzeck, K. Kaku, M. K. Hazarika, L. Czaranet al., “Global trends in satellite-based emergency mapping,”Science, vol. 353, no. 6296, pp. 247–252, 2016
2016
-
[2]
A comprehensive review of earthquake-induced building damage detection with remote sensing techniques,
L. Dong and J. Shan, “A comprehensive review of earthquake-induced building damage detection with remote sensing techniques,”ISPRS Journal of Photogrammetry and Remote Sensing, vol. 84, pp. 85–99, 2013
2013
-
[3]
Creating xBD: A dataset for assessing building damage from satellite imagery,
R. Gupta, B. Goodman, N. Patel, R. Hosfelt, S. Sajeev, E. Heim, J. Doshi, K. Lucas, H. Choset, and M. Gaston, “Creating xBD: A dataset for assessing building damage from satellite imagery,” inProceedings of the IEEE/CVF Conference on Computer Vision and Pattern Recognition (CVPR) Workshops, Jun. 2019, pp. 10–17
2019
-
[4]
Rapid damage assessment by means of multi-temporal SAR – a comprehensive review and outlook to Sentinel-1,
S. Plank, “Rapid damage assessment by means of multi-temporal SAR – a comprehensive review and outlook to Sentinel-1,”Remote Sensing, vol. 6, no. 6, pp. 4870–4906, 2014
2014
-
[5]
ETCI 2021 competition on flood detection,
NASA IMPACT and IEEE GRSS Earth Science Informatics Techni- cal Committee, “ETCI 2021 competition on flood detection,” https: //nasa-impact.github.io/etci2021/, 2021
2021
-
[6]
SpaceNet 8 – the detection of flooded roads and buildings,
R. H ¨ansch, J. Arndt, D. Lunga, M. Gibb, T. Pedelose, A. Boedihardjo, D. Petrie, and T. M. Bacastow, “SpaceNet 8 – the detection of flooded roads and buildings,” inProceedings of the IEEE/CVF Conference on Computer Vision and Pattern Recognition (CVPR) Workshops, Jun. 2022, pp. 1472–1480
2022
-
[7]
Land- slide4Sense: Reference benchmark data and deep learning models for landslide detection,
O. Ghorbanzadeh, Y . Xu, P. Ghamisi, M. Kopp, and D. Kreil, “Land- slide4Sense: Reference benchmark data and deep learning models for landslide detection,”IEEE Transactions on Geoscience and Remote Sensing, vol. 60, pp. 1–17, 2022
2022
-
[8]
The outcome of the 2022 Landslide4Sense competition: Advanced landslide detection from multisource satellite imagery,
O. Ghorbanzadeh, Y . Xu, H. Zhao, J. Wang, Y . Zhong, D. Zhao, Q. Zang, S. Wang, F. Zhang, Y . Shi, X. X. Zhu, L. Bai, W. Li, W. Peng, and P. Ghamisi, “The outcome of the 2022 Landslide4Sense competition: Advanced landslide detection from multisource satellite imagery,”IEEE Journal of Selected Topics in Applied Earth Observations and Remote Sensing, vol. ...
2022
-
[9]
Large-scale fine-grained building classifica- tion and height estimation for semantic urban reconstruction: Outcome of the 2023 ieee grss data fusion contest,
G. Liu, B. Peng, T. Liu, P. Zhang, M. Yuan, C. Lu, N. Cao, S. Zhang, S. Huang, T. Wang, X. Lu, L. Jiao, Q. Liu, L. Li, F. Liu, X. Liu, Y . Yang, K. Chen, Z. Yan, D. Tang, H. Huang, M. Schmitt, X. Sun, G. Vivone, C. Persello, and R. H¨ansch, “Large-scale fine-grained building classifica- tion and height estimation for semantic urban reconstruction: Outcome...
2023
-
[10]
Artificial intelli- gence for earthquake response: Outcomes and insights from a global spaceborne rapid mapping challenge,
P. Ebel, M. El Baz, J. Wang, W. Xuan, H. Qi, Z. Zheng, N. Yokoya, J. Park, J. Park, A. Elskens, E. Charles, I. Modica, Z. Foltz, P. Bally, C. Bossung, M. Chini, N. Long ´ep´e, and G. Meoni, “Artificial intelli- gence for earthquake response: Outcomes and insights from a global spaceborne rapid mapping challenge,”IEEE Geoscience and Remote Sensing Magazine, 2026
2026
-
[11]
2025 IEEE GRSS data fusion contest: All-weather land cover and building damage mapping,
C. Persello, S. Prasad, U. Verma, G. Vivone, H. Chen, J. Xia, J. Song, C. Broni-Bediako, O. Dietrich, K. Schindler, and N. Yokoya, “2025 IEEE GRSS data fusion contest: All-weather land cover and building damage mapping,”IEEE Geoscience and Remote Sensing Magazine, vol. 13, no. 2, pp. 388–392, 2025
2025
-
[12]
All-weather land cover and building damage mapping: Outcome of the 2025 IEEE GRSS data fusion contest,
W. Liu, Z. Wang, X. Guo, P. Duan, X. Kang, S. Li, Z. Wang, J. Hu, Y . Guo, J. Li, H. Huang, Y . Sheng, Y . Guo, W. He, X. Zeng, Y . Qu, C. Persello, U. Verma, S. Prasad, G. Vivone, H. Chen, J. Xia, J. Song, C. Broni-Bediako, K. Kurihara, O. Dietrich, K. Schindler, and N. Yokoya, “All-weather land cover and building damage mapping: Outcome of the 2025 IEEE...
2025
-
[13]
SpaceNet 6: Multi-sensor all weather mapping dataset,
J. Shermeyer, D. Hogan, J. Brown, A. Van Etten, N. Weir, F. Paci- fici, R. H ¨ansch, A. Bastidas, S. Soenen, T. Bacastow, and R. Lewis, “SpaceNet 6: Multi-sensor all weather mapping dataset,” inProceedings of the IEEE/CVF Conference on Computer Vision and Pattern Recogni- tion (CVPR) Workshops, 2020, pp. 196–197
2020
-
[14]
Spacenet 9—cross-sensor alignment of optical and sar imagery,
R. H ¨ansch, J. Arndt, A. Potnis, P. Dias, P. Novotn ´y, F. Pacifici, and T. M. Bacastow, “Spacenet 9—cross-sensor alignment of optical and sar imagery,”IEEE Journal of Selected Topics in Applied Earth Observations and Remote Sensing, vol. 19, pp. 11 491–11 502, 2026
2026
-
[15]
Report on the 2025 IEEE GRSS data fusion contest: All-weather land cover and building damage mapping,
C. Persello, U. Verma, S. Prasad, G. Vivone, H. Chen, J. Xia, J. Song, C. Broni-Bediako, O. Dietrich, K. Schindler, and N. Yokoya, “Report on the 2025 IEEE GRSS data fusion contest: All-weather land cover and building damage mapping,”IEEE Geoscience and Remote Sensing Magazine, vol. 13, no. 4, pp. 488–492, Dec. 2025
2025
-
[16]
Bright: A globally distributed multimodal building damage assessment dataset with very-high-resolution for all-weather disaster response,
H. Chen, J. Song, O. Dietrich, C. Broni-Bediako, W. Xuan, J. Wang, X. Shao, Y . Wei, J. Xia, C. Lan, K. Schindler, and N. Yokoya, “Bright: A globally distributed multimodal building damage assessment dataset with very-high-resolution for all-weather disaster response,”Earth System Science Data, vol. 17, pp. 6217–6253, 2025
2025
-
[17]
Microsoft COCO: Common objects in context,
T.-Y . Lin, M. Maire, S. Belongie, J. Hays, P. Perona, D. Ramanan, P. Doll ´ar, and C. L. Zitnick, “Microsoft COCO: Common objects in context,” inEuropean Conference on Computer Vision (ECCV), 2014, pp. 740–755
2014
-
[18]
Mask r-cnn,
K. He, G. Gkioxari, P. Doll ´ar, and R. Girshick, “Mask r-cnn,” in2017 IEEE International Conference on Computer Vision (ICCV), 2017, pp. 2980–2988
2017
-
[19]
Codabench: Flexible, easy-to-use, and reproducible meta- benchmark platform,
Z. Xu, S. Escalera, A. Pav ˜ao, M. Richard, W.-W. Tu, Q. Yao, H. Zhao, and I. Guyon, “Codabench: Flexible, easy-to-use, and reproducible meta- benchmark platform,”Patterns, vol. 3, no. 7, p. 100543, 2022
2022
-
[20]
Building-guided pseudo-label learning for cross-modal building damage mapping,
J. Li, H. Huang, Y . Sheng, Y . Guo, and W. He, “Building-guided pseudo-label learning for cross-modal building damage mapping,” in PREPRINT. THIS WORK HAS BEEN SUBMITTED TO THE IEEE FOR POSSIBLE PUBLICATION. 14 IGARSS 2025-2025 IEEE International Geoscience and Remote Sensing Symposium. IEEE, 2025, pp. 228–232
2025
-
[21]
Foreground-aware relation network for geospatial object segmentation in high spatial resolution remote sensing imagery,
Z. Zheng, Y . Zhong, J. Wang, and A. Ma, “Foreground-aware relation network for geospatial object segmentation in high spatial resolution remote sensing imagery,” inProceedings of the IEEE/CVF conference on computer vision and pattern recognition, 2020, pp. 4096–4105
2020
-
[22]
Toward complex backgrounds: A unified difference-aware decoder for binary segmentation,
J. Li, W. He, F. Lu, and H. Zhang, “Toward complex backgrounds: A unified difference-aware decoder for binary segmentation,”IEEE Transactions on Circuits and Systems for Video Technology, vol. 36, no. 2, pp. 2372–2386, 2026
2026
-
[23]
Progressive uncertainty- guided network for binary segmentation in high-resolution remote sens- ing imagery,
J. Li, W. He, T. Hu, M. Tang, and L. Zhang, “Progressive uncertainty- guided network for binary segmentation in high-resolution remote sens- ing imagery,”ISPRS Journal of Photogrammetry and Remote Sensing, vol. 232, pp. 561–577, 2026
2026
-
[24]
Overcoming the uncertainty challenges in detecting building changes from remote sensing images,
J. Li, W. He, Z. Li, Y . Guo, and H. Zhang, “Overcoming the uncertainty challenges in detecting building changes from remote sensing images,” ISPRS Journal of Photogrammetry and Remote Sensing, vol. 220, pp. 1–17, 2025
2025
-
[25]
Masked-attention mask transformer for universal image segmentation,
B. Cheng, I. Misra, A. G. Schwing, A. Kirillov, and R. Girdhar, “Masked-attention mask transformer for universal image segmentation,” inProceedings of the IEEE/CVF conference on computer vision and pattern recognition, 2022, pp. 1290–1299
2022
-
[26]
Solov2: Dynamic and fast instance segmentation,
X. Wang, R. Zhang, T. Kong, L. Li, and C. Shen, “Solov2: Dynamic and fast instance segmentation,”Advances in Neural information processing systems, vol. 33, pp. 17 721–17 732, 2020
2020
-
[27]
Yolov10: Real-time end-to-end object detection,
A. Wang, H. Chen, L. Liu, K. Chen, Z. Lin, J. Han, and G. Ding, “Yolov10: Real-time end-to-end object detection,”Advances in neural information processing systems, vol. 37, pp. 107 984–108 011, 2024
2024
-
[28]
Yolo26: An analysis of nms-free end to end framework for real-time object detection,
S. Chakrabarty, “Yolo26: An analysis of nms-free end to end framework for real-time object detection,”arXiv preprint arXiv:2601.12882, 2026
arXiv 2026
-
[29]
Deep residual learning for image recognition,
K. He, X. Zhang, S. Ren, and J. Sun, “Deep residual learning for image recognition,” inProceedings of the IEEE Conference on Computer Vision and Pattern Recognition (CVPR), 2016, pp. 770–778
2016
-
[30]
Feature pyramid networks for object detection,
T.-Y . Lin, P. Doll´ar, R. Girshick, K. He, B. Hariharan, and S. Belongie, “Feature pyramid networks for object detection,” inProceedings of the IEEE Conference on Computer Vision and Pattern Recognition (CVPR), 2017, pp. 2117–2125
2017
-
[31]
Faster R-CNN: Towards real-time object detection with region proposal networks,
S. Ren, K. He, R. Girshick, and J. Sun, “Faster R-CNN: Towards real-time object detection with region proposal networks,”Advances in Neural Information Processing Systems, vol. 28, pp. 91–99, 2015
2015
-
[32]
In search of lost domain generalization,
I. Gulrajani and D. Lopez-Paz, “In search of lost domain generalization,” inInternational Conference on Learning Representations (ICLR), 2021
2021
-
[33]
Earth observation for disaster mapping: Benchmarks, methods, challenges and future perspectives,
H. Chen, J. Song, W. Xuan, J. Wang, H. Qi, Z. Zhou, P. Dai, O. Dietrich, E. Gutierrez, L. Bromly, E. Nemni, Y . Ou, J. Zhao, Z. Zheng, Y . Xu, R. H ¨ansch, W. Jiao, M. Chini, C. Persello, J. Xia, S. Lu, L. Wang, Z. Zhu, E. Shelhamer, J. Chanussot, K. Schindler, and N. Yokoya, “Earth observation for disaster mapping: Benchmarks, methods, challenges and fut...
2026
-
[34]
Tent: Fully test-time adaptation by entropy minimization,
D. Wang, E. Shelhamer, S. Liu, B. Olshausen, and T. Darrell, “Tent: Fully test-time adaptation by entropy minimization,” inInternational Conference on Learning Representations (ICLR), 2021
2021
-
[35]
Pseudo-labeling and confirmation bias in deep semi-supervised learning,
E. Arazo, D. Ortego, P. Albert, N. E. O’Connor, and K. McGuin- ness, “Pseudo-labeling and confirmation bias in deep semi-supervised learning,” in2020 International Joint Conference on Neural Networks (IJCNN). IEEE, 2020, pp. 1–8
2020
-
[36]
Ultra-high- resolution sar and optical image registration: From global benchmark dataset to frequency-guided registration method,
H. Yan, A. Ma, H. Shu, Y . Wan, L. Zhang, and Y . Zhong, “Ultra-high- resolution sar and optical image registration: From global benchmark dataset to frequency-guided registration method,”ISPRS Journal of Photogrammetry and Remote Sensing, vol. 235, pp. 190–210, 2026
2026
discussion (0)
Sign in with ORCID, Apple, or X to comment. Anyone can read and Pith papers without signing in.