REVIEW 4 major objections 6 minor 28 references
Cohesion mediated layering in sheared grains
T0 review · 4 major / 6 minor · reviewed 2026-08-06 · deepseek-v4-flash
Pith's one-line read A sheared mixture of cohesive and non-cohesive grains forms percolating stripes once the product of cohesive-grain concentration and cohesion strength crosses a threshold, and the stripe formation can be predicted from a shear-activated…
desk verdict The DEM collapse is the real result here; the Cahn-Hilliard model is a promising but unproven ansatz that should not be mistaken for a mechanism yet. read the letter →
The pith
A machine-rendered reading of the paper's core claim, the machinery that carries it, and where it could break.
The reading
What carries the argument
The carrying object is a double-well effective free energy functional, $F[c] = F_o[c] + F_{\rm interface}[c]$, whose bulk density $f_o(c) = K[c_o c^2/2 - (1+c_o)c^3/3 + c^4/4]$ has minima at $c=0$ and $c=1$ and a maximum at $c=c_o$, plus a gradient penalty $\frac{1}{2}\kappa(\nabla c)^2$. The segregation flux $j=-M_0\dot\gamma\,\nabla(\delta F/\delta c)$ has mobility proportional to strain rate, so the free energy exerts no dynamics at rest; its linear stability gives a critical wavenumber $k_c=\sqrt{K/(4\kappa)}$, which sets the layer count in a system of size $2\pi$ and is matched against $c_oC$ from the particle simulations.
What would settle it
Stop the shear after layers form and watch the concentration field. The ansatz $M=M_0\dot\gamma$ predicts $j=0$ at $\dot\gamma=0$, so the layer pattern should freeze in place; any coarsening, sharpening, or dissolution of the stripes after the top wall stops would falsify the mobility assumption. A second check is to increase the bed height $L_z$ by a factor of two and verify that the number of layers doubles as required by the critical wavenumber $k_c$.
Extended reading notes
Core claim
The discovery is that increasing $c_o C$ switches the cohesive component from distributed, irregular agglomerates to percolating stripes in plane shear, and that this transition is quantitatively described by a Cahn-Hilliard-type effective free energy. The authors construct $F[c] = \int [K(c_o c^2/2 - (1+c_o)c^3/3 + c^4/4) + \frac{1}{2}\kappa(\nabla c)^2]\,dr$, impose a segregation flux $j = -M(\dot\gamma)\nabla(\delta F/\delta c)$ with $M(\dot\gamma)=M_0\dot\gamma$, and show that the steady-state solutions of the resulting advection-diffusion equation form layers. The DEM measurements of interfacial energy $\langle|\nabla c|^2\rangle$ scale linearly with $c_oC$, and the continuum model gives the same linear scaling with $\sqrt{K/(4\kappa)}$; the paper takes this correspondence as evidence that the double-well free energy is the right macroscopic description, activated only by shear.
Load-bearing premise
The load-bearing premise is that sheared granular mixtures can be described by an effective double-well free energy at all, with dynamics switched on only by shear; if the real grain-scale motion cannot be represented by such a free energy, the predicted layers are built into the assumed shape rather than derived from the physics.
Editorial extensions
If this is right
- For $c_o C \lesssim 2$, cohesive grains form agglomerates whose normalized size grows roughly linearly with $c_o C$; beyond that, agglomerates percolate and stripes span the system.
- The continuum model reproduces steady-state layering from the double-well flux, including the balance between $\partial_z^2 c$, $(\partial_z c)^2$, and $\partial_z^4 c$ terms in the one-dimensional steady state.
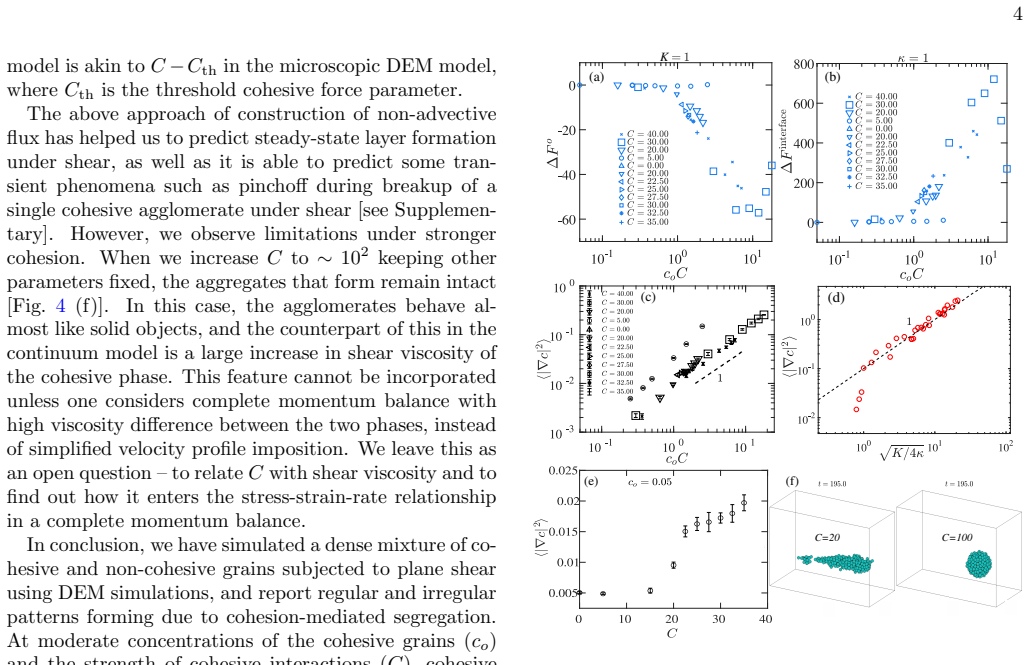
- Average interfacial energy is a linear function of $c_o C$ in particle simulations and of $\sqrt{K/(4\kappa)}$ in the continuum model, giving a parameter map between the two descriptions.
- There is an effective threshold cohesion $C_{\rm th}$: below it the interfacial energy stays negligible, matching a negative bulk curvature $K<0$ in the free energy, for which the homogeneous state is stable.
- For moderate cohesion the flux also captures transient pinchoff during breakup of a single agglomerate, though at very high $C$ the agglomerate acts like a solid and the simplified linear velocity profile breaks down.
Reading between the lines
- Beyond the paper, the same construction should be testable for segregation driven by size or friction differences: if mobility proportional to strain rate is the only ingredient needed, stripes in those systems should also follow a critical-wavenumber scaling set by an effective free-energy curvature.
- Beyond the paper, the correspondence between $c_oC$ and $\sqrt{K/(4\kappa)}$ suggests the dimensionless product is a practical control parameter for experiments, letting one dial layer spacing by changing liquid content or cohesive coating at fixed total concentration.
- Beyond the paper, because the polynomial double well and the logarithmic free energy in the supplementary materials give equivalent critical wavenumbers, the specific functional form is probably not important; what matters is the double-well curvature near $c_o$, which may make the prediction robust to the microscopic cohesion model.
Editorial analysis
A structured set of objections, weighed in public.
Referee Report
Summary. The manuscript reports DEM simulations of a sheared binary mixture of cohesionless and cohesive grains, characterized by a cohesive grain concentration c_o and a cohesion strength C (granular Bond number). It finds that with increasing c_oC, cohesive grains form percolating stripes or layers rather than distributed agglomerates, and that both the agglomerate size ℓ/L and the average normal stress collapse onto c_oC. The authors propose an effective free-energy ansatz: a Cahn–Hilliard-type concentration equation with flux j = -M(γdot)∇(δF/δc), where F has a double-well bulk term and a gradient term, and the mobility M(γdot) = M0γdot vanishes at zero shear. The continuum model reproduces steady-state layers, and the paper reports a correspondence between c_oC and the critical wavenumber sqrt(K/(4κ)) based on the scaling of ⟨|∇c|²⟩ in the DEM and continuum simulations. A threshold behavior at low C is attributed to K ~ C - C_th. The paper also reports transient pinch-off of a single agglomerate as a qualitative test and acknowledges failure at very high C.
Significance. If the proposed effective-free-energy mechanism were validated, it would provide a useful conceptual bridge between granular segregation and equilibrium phase separation, and it could offer a practical route to predicting layer formation in cohesive granular flows. The DEM data collapse onto c_oC is an interesting and potentially robust empirical result, and the paper is transparent about the ansatz nature of the model, with the full DEM contact model provided in the supplement. However, as it stands, the continuum model is constructed in such a way that it cannot fail to phase-separate under shear, and the quantitative evidence linking it to the DEM is a single scaling observable. The central claim therefore needs a stronger, falsifiable test before the correspondence can be regarded as established. The paper also provides no code or data availability statement, which limits reproducibility.
major comments (4)
- [Main text, Eqs. (1)–(3)] The model cannot fail to produce layering. In Eq. (3) the bulk free energy is explicitly forced to have a double-well shape with f''(c_o) < 0, and the mobility M(γdot) = M0γdot means that any nonzero shear activates the Cahn–Hilliard instability. The steady-state stripes in Fig. 3(b,c) are therefore a necessary consequence of the construction rather than a test of the proposed physical mechanism. To make the central claim load-bearing, the authors should provide an independent prediction—for example, the layer spacing or the full concentration profile from the DEM, or a calibrated relation between (c_o, C) and (K, κ) obtained outside the scaling in Fig. 4—and then compare it with the continuum model.
- [Fig. 4(a,b) and Eqs. (5)–(6)] The DEM estimates of 'free energy changes' do not provide an independent test. ΔF_o and ΔF_interface are evaluated with the authors' own F_o and F_interface of Eq. (3), so any segregated configuration will by construction decrease the double-well bulk term and increase the gradient term. The observed competition between the two terms in Fig. 4(a,b) is thus a property of the chosen functional, not evidence that the DEM obeys that functional. A null test—for example, a comparison with a random or non-phase-separating concentration field at the same c_o—is needed before this can be read as validation.
- [Fig. 4(c,d) and critical wavenumber k_c] The claimed correspondence c_oC ↔ sqrt(K/(4κ)) rests on the observation that ⟨|∇c|²⟩ is linearly increasing in both variables. This is a one-observable scaling match, not a quantitative mapping: the DEM control parameter c_oC is dimensionless, while sqrt(K/(4κ)) has the dimension of inverse length, and no conversion factor or calibration relation is given. Moreover, the Supplement shows that a different double-well free energy (Eq. 24) produces the same qualitative behavior, so this scaling is not discriminating. The authors should state what observable would be needed to falsify the correspondence, or calibrate K and κ independently.
- [Eq. (2) and final paragraph] The paper's own limitation statement—that for C ~ 100 the agglomerates behave almost like solid objects and the imposed velocity profile u = γdot z i fails—restricts the domain of validity of the continuum model. This limitation is acknowledged in the text and in Supplement Fig. 9, but it should be incorporated into the central claim rather than appended as an aside, because it implies that the model is applicable only in an intermediate cohesion range where the flux ansatz is most likely to be correct.
minor comments (6)
- [Throughout] Use c_o consistently for the concentration parameter; the printed text frequently uses 'co' (e.g., Eq. (7) and Fig. 2), which is confusing next to the concentration field c.
- [Fig. 2(b)] The statement ℓ/L ∼ c_oC should include the prefactor, the fit range, and the uncertainty; as printed the reader cannot tell whether the collapse is linear or merely monotonic.
- [Main text after Fig. 4(e)] The statement that 'K in the continuum model is akin to C - C_th' is an analogy, not a measurement; K is not directly measured and C_th is not defined quantitatively. Please label it as such and, if possible, report C_th from the threshold in Fig. 4(e).
- [Supplement, Fig. 6] The supplement's validation figure is described as replicating standard results, but no quantitative comparison (e.g., Bagnold scaling exponent or velocity-profile residual) is given; a brief quantitative measure would strengthen the DEM section.
- [Data availability] No code or data availability statement is included. Given that the DEM parameter table and interaction model are described in detail, releasing the simulation or analysis scripts would substantially improve reproducibility.
- [Abstract and conclusion] The abstract and conclusion claim that the free-energy approach closely reproduces the layering, while the high-C failure appears only in the final paragraph; consider stating the moderate-cohesion range of applicability in the abstract.
Circularity Check
Effective free energy is imposed, not derived: layering is guaranteed by the chosen double well, and the free-energy 'test' uses the same constructed functional.
-
self definitional
[Main text, construction of the free energy functional, Eq. (3)]
"To segregate the mixture, we force fo to have a double well shape: f′o = 0 at c = 0, 1, co; f′′o > 0 at c = 0, 1; and f′′o < 0 at c = co. The conditions are satisfied if we construct fo = K[coc2/2 − (1 + co)c3/3 + c4/4] ... Using this flux, the steady-state solution of Eq. 1 is shown ... predicting the formation of layers or stripes."
The double-well condition f′′o < 0 at c = co is exactly the spinodal-instability condition: any small perturbation around the homogeneous concentration co grows, so demixing and layer formation are mathematical consequences of the imposed free-energy shape. The model is built from the target phenomenon (phase separation) and then used to 'predict' that same phenomenon, rather than deriving the free energy from the DEM interaction law (Eqs. 9-10) or from the cohesion parameter C and concentration co.
-
self definitional
[Main text, Eqs. (5)-(6) and Fig. 4(a,b)]
"We test the free energy hypothesis by calculating the change in F o and F interface in a given DEM run as ∆F o = F o[c(t)] − F o[c(t′)], (5) ∆F interface = F interface[c(t)] − F interface[c(t′)], (6) where t′ is the time at the beginning when the system is well mixed, and t is a time chosen when the system attains a quasi steady-state."
The 'test' evaluates the DEM concentration field using the same functional F that was constructed to favor demixing: because fo has minima at c = 0 and c = 1 and a maximum at c = co, any non-uniform field necessarily lowers F o and raises F interface relative to the well-mixed state. The reported competition between bulk free-energy minimization and interfacial-energy maximization is therefore a built-in property of the chosen functional, not independent evidence that the DEM dynamics obey this free energy.
1 more flagged steps
-
fitted input called prediction
[Main text, Fig. 4(c,d) and paragraph on correspondence]
"We find a remarkable correspondence between the critical wavenumber p K/(4κ) in the continuum approach and coC in the DEM simulations. From the concentration field, we quantify the average interfacial energy, ⟨|∇c|2⟩, and find that it scales linearly with coC in the DEM simulations, and also linearly with p K/(4κ) in the continuum model."
In the continuum model, kc = p K/(4κ) is defined by the linear stability of the imposed double-well free energy, and the interfacial energy ⟨|∇c|2⟩ of the resulting steady layers is controlled by the same K and κ. Plotting continuum ⟨|∇c|2⟩ against p K/(4κ) therefore traces the model's own construction. The DEM scaling with coC is an independent observation, but the claimed correspondence is established by matching a single aggregate observable while K and κ remain free parameters of the ansatz; it does not determine K or κ from C or co, so the 'robust correspondence' is a calibration, not a parameter-free prediction.
full rationale
The DEM simulations provide an independent empirical result: cohesive grains form percolating layers, and the agglomerate linear size and normal stress collapse onto curves of coC (Fig. 2). That portion is not circular. The circularity enters when the paper moves from observation to mechanism. The continuum model is not derived from the DEM force law; instead, a Cahn-Hilliard-type free energy is imposed with a double well, which mathematically guarantees spinodal decomposition around co. The authors are transparent about this ('We propose an ansatz', 'we force fo to have a double well shape'), but the subsequent 'prediction' of layering and the 'test' of the free-energy hypothesis using ΔF_o and ΔF_interface evaluated with the same constructed F are circular: any non-uniform field will lower F_o and raise F_interface by construction. The Supplement's demonstration that another double-well free energy also produces layers confirms that the layering outcome is an artifact of the double-well assumption rather than a unique consequence of the specific microscopic cohesion. The reported correspondence between coC and p K/(4κ) is a scaling match of one aggregate observable with free parameters, not a parameter-free derivation. No load-bearing self-citations or imported uniqueness theorems appear; the issue is the ansatz itself. Overall the central mechanistic claim is therefore only partially supported: partial circularity, score 6.
Assumptions & free parameters
free parameters (5)
- K (bulk free-energy coefficient) =
chosen by hand: K=2, 8, 20, 25 in Fig. 3
- κ (gradient/interface coefficient) =
chosen by hand: κ=0.03, 0.09, 0.7, 0.9 in Fig. 3
- M0 (mobility coefficient) =
not specified
- α (alternative model parameter) =
not specified
- Cth (threshold cohesive force) =
≈20 for c_o=0.05 (Fig. 4e)
assumptions (6)
- ad hoc to paper An effective free energy F[c] exists for the non-equilibrium granular mixture and drives segregation.
- ad hoc to paper The bulk free energy density has a double-well shape with extrema at c=0, 1, and c_o.
- ad hoc to paper Mobility is proportional to strain rate, M(γdot)=M0 γdot.
- domain assumption The macroscopic velocity profile is linear, u=γdot z i.
- domain assumption A simplified linear cohesive force captures the cohesion mechanisms relevant to layering.
- standard math Cahn-Hilliard variational calculus and linear stability analysis apply to the mesoscopic concentration field.
invented entities (1)
-
Effective free energy functional F[c] for granular segregation
Cite this review
Pith. "Pith review of Cohesion mediated layering in sheared grains." pith.science (2026). https://pith.science/paper/6WX3JL3P
@misc{pith2026250723573,
  author       = {Pith},
  title        = {Pith review of: Cohesion mediated layering in sheared grains},
  year         = {2026},
  howpublished = {\url{https://pith.science/paper/6WX3JL3P}},
  note         = {Machine review of arXiv:2507.23573}
}
abstract
We consider pattern formation in a sheared dense mixture of cohesive and non-cohesive grains. Our findings show that cohesive grains, which would typically form distributed agglomerates, instead segregate into percolating stripes or layers when the cohesive grain concentration ($c_o$) and cohesion strength ($C$) increase -- in a way that the average agglomerate size and the average normal stress collapse onto a single curve when plotted against $c_oC$. Our central proposal is that the development of interfaces between cohesive and non-cohesive grains is akin to phase separation in binary molecular mixtures driven by an effective free energy, although we are dealing with a non-equilibrium system; we setup the segregation flux such that the effect of this free energy is activated only upon application of the external driving. By constructing the segregation flux proportional to the gradient of the variational derivative of the free energy, we closely reproduce the layering in the steady-state limit. We find a robust correspondence between the parameter $c_o C$ in the discrete simulations and the parameters in the free energy.
Figures


Figures from the paper (7 more)


Reference graph
Works this paper leans on
- [1]
-
[2]
A. Samadani and A. Kudrolli, Physical Review Letters 85, 5102 (2000). (c) (d) C=100 (f) C=20 (e) K (a) (b) FIG. 4. Changes in (a) the bulk free energyF o [Eq. 5], and (b) the interfacial free energy F interface [Eq. 6] as predicted from DEM simulations. (c) The average interfacial energy ⟨|∇c|2⟩ as a function of the parameter coC in the DEM simulations, a...
work page 2000
-
[3]
J. M. Ottino and D. V. Khakhar, Annual review of fluid mechanics 32, 55 (2000)
work page 2000
-
[4]
K. M. Hill and J. Kakalios, Physical Review E 52, 4393 (1995)
work page 1995
- [5]
- [6]
- [7]
-
[8]
A. Gans, O. Pouliquen, and M. Nicolas, Physical Review E 101, 032904 (2020)
work page 2020
Show all 28 references
-
[9]
Jarray, H
A. Jarray, H. Shi, B. J. Scheper, M. Habibi, and S. Lud- ing, Scientific reports 9, 1 (2019)
2019
-
[10]
V. Lee, S. R. Waitukaitis, M. Z. Miskin, and H. M. Jaeger, Nature Physics 11, 733 (2015)
2015
-
[11]
Shinbrot, B
T. Shinbrot, B. Ferdowsi, S. Sundaresan, and N. A. Araujo, Physical Review Materials 2, 125003 (2018)
2018
-
[12]
Yoshimatsu, N
R. Yoshimatsu, N. Ara´ ujo, T. Shinbrot, and H. J. Her- 5 rmann, Granular Matter 20, 1 (2018)
2018
-
[13]
Singh, Aggregation and pattern formation in charged granular gases, Ph.D
C. Singh, Aggregation and pattern formation in charged granular gases, Ph.D. thesis, Georg-August Universit¨ at G¨ ottingen (2019)
2019
-
[14]
Brewster, G
R. Brewster, G. S. Grest, J. W. Landry, and A. J. Levine, Physical Review E 72, 061301 (2005)
2005
-
[15]
P. G. Rognon, J.-N. Roux, M. Naaim, and F. Chevoir, Journal of Fluid Mechanics 596, 21 (2008)
2008
-
[16]
J. R. Royer, D. J. Evans, L. Oyarte, Q. Guo, E. Kapit, M. E. M¨ obius, S. R. Waitukaitis, and H. M. Jaeger, Na- ture 459, 1110 (2009)
2009
-
[17]
Mandal, M
S. Mandal, M. Nicolas, and O. Pouliquen, Proceedings of the National Academy of Sciences 117, 8366 (2020)
2020
-
[18]
T. T. Vo, S. Nezamabadi, P. Mutabaruka, J.-Y. Delenne, and F. Radjai, Nature communications 11, 1 (2020)
2020
-
[19]
Elekes and E
F. Elekes and E. J. Parteli, Proceedings of the National Academy of Sciences 118 (2021)
2021
-
[20]
Macaulay and P
M. Macaulay and P. Rognon, Soft matter 17, 165 (2021)
2021
-
[21]
J. P. Metzger, C. P. McLaren, S. Pinzello, N. A. Conzel- mann, C. M. Boyce, and C. R. M¨ uller, Physical Review Fluids 7, 014309 (2022)
2022
-
[22]
J. M. N. T. Gray, Annual review of fluid mechanics 50, 407 (2018)
2018
-
[23]
P. B. Umbanhowar, R. M. Lueptow, and J. M. Ottino, Annual review of chemical and biomolecular engineering 10, 129 (2019)
2019
-
[24]
J. W. Cahn and J. E. Hilliard, The Journal of chemical physics 28, 258 (1958)
1958
-
[25]
M. E. Cates and E. Tjhung, Journal of Fluid Mechanics 836, P1 (2018)
2018
-
[26]
L. E. Silbert, D. Erta¸ s, G. S. Grest, T. C. Halsey, D. Levine, and S. J. Plimpton, Physical Review E 64, 051302 (2001)
2001
-
[27]
R. A. Bagnold, Proceedings of the Royal Society of Lon- don. Series A. Mathematical and Physical Sciences 225, 49 (1954)
1954
-
[28]
Kim and K
S. Kim and K. Kamrin, Physical Review Letters 125, 088002 (2020). 6 SUPPLEMENT AR Y: COHESION MEDIA TED LA YERING IN SHEARED GRAINS SETUP OF DEM SIMULA TIONS We use the discrete element method (DEM) to solve the equations of motion for grains. Initially, a total of N = 24 × 24...
2020
Reviewed August 6, 2026 · model on record in the stance chip above.
Discussion (0). Continue with ORCID to comment.