Dimensional Balance Improves Large Scale Spatiotemporal Prediction Performance
Pith reviewed 2026-05-20 22:02 UTC · model grok-4.3
The pith
Balancing spatial and temporal dimensions through low-rank compression and extended horizons improves large-scale spatiotemporal prediction accuracy.
A machine-rendered reading of the paper's core claim, the machinery that carries it, and where it could break.
Core claim
The authors establish that a framework harmonizing spatial and temporal feature representations by applying low-rank matrix embedding to compress spatial dimensionality while extending the temporal horizon produces substantial accuracy gains and demonstrates applicability across urban traffic, meteorological, and epidemic datasets.
What carries the argument
Low-rank matrix embedding for spatial compression paired with an extended temporal horizon, guided by entropy measures that diagnose spatiotemporal complexity mismatch.
If this is right
- Prediction error decreases on urban traffic datasets under the same model capacity.
- Meteorological forecasts exhibit higher accuracy with the harmonized representations.
- Epidemic modeling tasks gain reliability from the reduced cumulative temporal errors.
- The approach transfers to multiple domains without requiring domain-specific redesigns.
Where Pith is reading between the lines
- The same compression-plus-extension pattern could be tested on video frame prediction or multi-sensor time series where spatial and temporal scales also compete.
- Entropy mismatch scores might serve as an automatic signal for choosing rank and horizon values in new architectures.
Load-bearing premise
Entropy measures of spatial and temporal complexity can reliably flag mismatches that, once corrected through dimension adjustments, produce better forecasts.
What would settle it
Applying the framework to a new spatiotemporal dataset that exhibits high entropy mismatch yet shows no accuracy gain or a loss relative to baselines would falsify the central claim.
Figures


read the original abstract
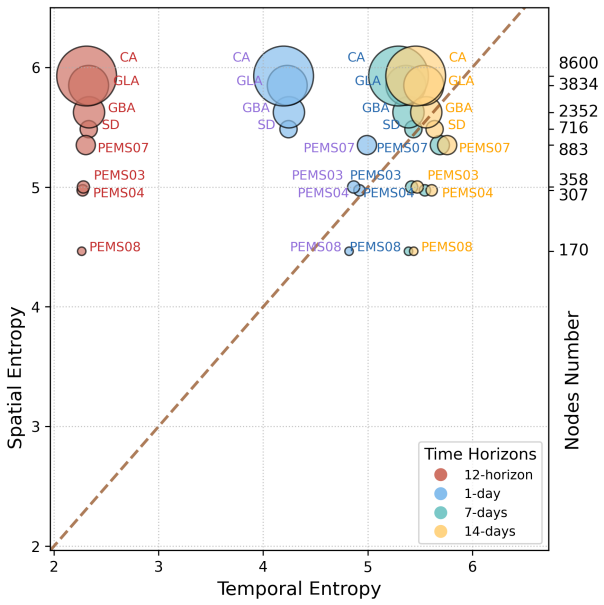
Accurate spatiotemporal pattern analysis is critical in fields such as urban traffic, meteorology, and public health monitoring. However, existing methods face performance bottlenecks, typically yielding only incremental gains and often exhibiting limited cross-domain transferability. We analyze this bottleneck through spatial and temporal entropy measures, which are used as diagnostic indicators of spatiotemporal complexity mismatch rather than as guarantees that entropy alignment alone yields better forecasting. Empirically, larger mismatch is often accompanied by higher prediction uncertainty, especially under a fixed model-capacity budget. Guided by this diagnostic, we propose a scalable, adaptive framework that harmonizes spatial and temporal feature representations. Spatial dimensionality is compressed via low-rank matrix embedding to preserve essential structure, while an extended temporal horizon captures long-range dependencies and mitigates cumulative errors arising from temporal heterogeneity. Extensive experiments on urban traffic, meteorological, and epidemic datasets demonstrate substantial accuracy gains and broad applicability across the evaluated domains, suggesting that the framework is promising for a wide range of spatiotemporal tasks beyond the current study. The code is available on GitHub at https://github.com/ST-Balance/ST-Balance.
Editorial analysis
A structured set of objections, weighed in public.
Referee Report
Summary. The paper claims that spatial and temporal entropy measures serve as diagnostics for spatiotemporal complexity mismatch, which guides a framework using low-rank spatial matrix embedding for dimensionality compression and extended temporal horizons to capture long-range dependencies; this harmonization is said to yield substantial accuracy gains with broad applicability on urban traffic, meteorological, and epidemic datasets.
Significance. If the claimed gains prove robust and the entropy diagnostic is shown to have a causal rather than post-hoc role, the work could offer a practical heuristic for balancing spatial-temporal representations under fixed model capacity, with potential transfer to other large-scale prediction domains.
major comments (3)
- [Abstract] Abstract: the claim of 'substantial accuracy gains' on three domains is unsupported by any quantitative metrics, error bars, baseline comparisons, or statistical significance tests, making it impossible to evaluate the magnitude or reliability of the reported improvements.
- [Framework and Experiments] Framework and Experiments: no before/after entropy values, mismatch reduction measurements, or ablation isolating the diagnostic-to-design step are provided; without these, the central claim that low-rank compression plus horizon extension improves performance specifically because of diagnosed entropy mismatch cannot be distinguished from generic regularization or capacity effects.
- [Framework] Parameter selection: the free parameters (spatial embedding rank and temporal horizon length) are described as guided by entropy diagnostics, yet the manuscript does not demonstrate an explicit separation between diagnostic use and post-hoc fitting to observed performance, weakening the non-circularity of the design process.
minor comments (1)
- [Abstract] The GitHub link is given but the manuscript provides no details on code structure, exact experimental protocols, or data preprocessing steps needed for reproducibility.
Simulated Author's Rebuttal
We thank the referee for their thoughtful comments, which have helped us identify areas where the manuscript can be strengthened. We address each major comment below, indicating the revisions we intend to make in the updated version.
read point-by-point responses
-
Referee: [Abstract] Abstract: the claim of 'substantial accuracy gains' on three domains is unsupported by any quantitative metrics, error bars, baseline comparisons, or statistical significance tests, making it impossible to evaluate the magnitude or reliability of the reported improvements.
Authors: We agree that the abstract would be more informative with quantitative details. In the revised manuscript, we will incorporate specific metrics from our experiments, including accuracy improvements with error bars, comparisons to baselines, and references to statistical tests where performed. This will allow readers to better assess the gains. revision: yes
-
Referee: [Framework and Experiments] Framework and Experiments: no before/after entropy values, mismatch reduction measurements, or ablation isolating the diagnostic-to-design step are provided; without these, the central claim that low-rank compression plus horizon extension improves performance specifically because of diagnosed entropy mismatch cannot be distinguished from generic regularization or capacity effects.
Authors: We acknowledge the need for more direct evidence linking the entropy diagnostic to the design choices. We will include before-and-after entropy values and mismatch reduction measurements in the experiments section. Furthermore, we will add ablation studies that compare the full framework against versions without the entropy-guided components to isolate the effect and distinguish it from generic regularization or capacity increases. revision: yes
-
Referee: [Framework] Parameter selection: the free parameters (spatial embedding rank and temporal horizon length) are described as guided by entropy diagnostics, yet the manuscript does not demonstrate an explicit separation between diagnostic use and post-hoc fitting to observed performance, weakening the non-circularity of the design process.
Authors: To clarify the non-circular nature of our approach, we will expand the description of the parameter selection process. We will explicitly show that entropy diagnostics are computed solely from the input data characteristics, independent of any model training or performance evaluation. The selection of spatial embedding rank and temporal horizon length will be presented as being determined based on these pre-computed diagnostics, with examples illustrating the decision process before reporting final results. revision: yes
Circularity Check
No significant circularity: entropy diagnostics are observational and framework gains rest on independent empirical validation
full rationale
The paper explicitly frames spatial and temporal entropy measures as diagnostic indicators of complexity mismatch rather than guarantees of improved forecasting. The proposed low-rank spatial compression and extended temporal horizon are presented as design choices guided by this observation, followed by direct experimental evaluation on traffic, meteorological, and epidemic datasets. No equations, fitted parameters renamed as predictions, or self-citation chains reduce the reported accuracy gains to the input diagnostics by construction. The derivation remains self-contained because the performance claims are supported by cross-domain empirical results rather than tautological re-expression of the entropy observations.
Axiom & Free-Parameter Ledger
free parameters (2)
- spatial embedding rank
- temporal horizon length
axioms (2)
- domain assumption Low-rank matrix embedding preserves essential spatial structure for downstream prediction
- domain assumption Entropy measures serve as valid indicators of spatiotemporal complexity mismatch
Lean theorems connected to this paper
-
IndisputableMonolith/Cost/FunctionalEquation.leanwashburn_uniqueness_aczel unclear?
unclearRelation between the paper passage and the cited Recognition theorem.
We analyze this bottleneck through spatial and temporal entropy measures, which are used as diagnostic indicators of spatiotemporal complexity mismatch rather than as guarantees... Spatial dimensionality is compressed via low-rank matrix embedding... extended temporal horizon
-
IndisputableMonolith/Foundation/DimensionForcing.leanalexander_duality_circle_linking unclear?
unclearRelation between the paper passage and the cited Recognition theorem.
Figure 1: Scatter plots of spatial entropy vs. temporal entropy... diagonal reference line indicates where spatial and temporal entropies are equal
What do these tags mean?
- matches
- The paper's claim is directly supported by a theorem in the formal canon.
- supports
- The theorem supports part of the paper's argument, but the paper may add assumptions or extra steps.
- extends
- The paper goes beyond the formal theorem; the theorem is a base layer rather than the whole result.
- uses
- The paper appears to rely on the theorem as machinery.
- contradicts
- The paper's claim conflicts with a theorem or certificate in the canon.
- unclear
- Pith found a possible connection, but the passage is too broad, indirect, or ambiguous to say the theorem truly supports the claim.
Reference graph
Works this paper leans on
-
[1]
M. Jin, H. Y. Koh, Q. Wen, D. Zambon, C. Alippi, G. I. Webb, I. King, S. Pan, A survey on graph neural networks for time series: Forecasting, classification, imputation, and anomaly detection, IEEE Transactions on Pattern Analysis and Machine Intelligence 46 (2024) 10466–10485
work page 2024
-
[2]
J. Chen, S. Pan, W. Peng, W. Xu, Bilinear spatiotemporal fusion network: An efficient approach for traffic flow prediction, Neural Networks 187 (2025) 107382
work page 2025
-
[3]
L. Chen, L. Chen, H. Wang, Spatiotemporal multi-view trend-aware network for traffic flow prediction, Knowledge-Based Systems 333 (2026) 115002
work page 2026
-
[4]
K. Bi, L. Xie, H. Zhang, X. Chen, X. Gu, Q. Tian, Accurate medium- range global weather forecasting with 3D neural networks, Nature 619 (7970) (2023) 533–538
work page 2023
-
[5]
H. Wu, H. Zhou, M. Long, J. Wang, Interpretable weather forecast- ing for worldwide stations with a unified deep model, Nature Machine Intelligence 5 (6) (2023) 602–611
work page 2023
-
[6]
M. U. Kraemer, J. L.-H. Tsui, S. Y. Chang, S. Lytras, M. P. Khurana, S. Vanderslott, S. Bajaj, N. Scheidwasser, J. L. Curran-Sebastian, E. Se- menova, et al., Artificial intelligence for modelling infectious disease epidemics, Nature. 638 (8051) (2025) 623–635
work page 2025
-
[7]
M. Liu, Y. Liu, J. Liu, Epidemiology-aware deep learning for infectious disease dynamics prediction, in: Proceedings of the 32nd ACM Interna- tional Conference on Information and Knowledge Management, ACM, 2023, p. 4084–4088.doi:10.1145/3583780.3615139
-
[8]
Y. Li, R. Yu, C. Shahabi, Y. Liu, Diffusion convolutional recurrent neural network: Data-driven traffic forecasting, in: International Conference on Learning Representations, 2018
work page 2018
-
[9]
Z. Wu, S. Pan, G. Long, J. Jiang, C. Zhang, Graph wavenet for deep spatial-temporal graph modeling, in: Proceedings of the Twenty-Eighth International Joint Conference on Artificial Intelligence, IJCAI, 2019, pp. 1907–1913.doi:10.24963/ijcai.2019/264. 30
-
[10]
H. Liu, Z. Dong, R. Jiang, J. Deng, J. Deng, Q. Chen, X. Song, Spatio- temporal adaptive embedding makes vanilla transformer sota for traffic forecasting, in: Proceedings of the 32nd ACM International Conference on Information and Knowledge Management, ACM, 2023, p. 4125–4129. doi:10.1145/3583780.3615160
-
[11]
J. Chen, H. Ye, Z. Ying, Y. Sun, W. Xu, Dynamic trend fusion module for traffic flow prediction, Applied Soft Computing 174 (2025) 112979
work page 2025
-
[12]
C. Chen, K. Petty, A. Skabardonis, P. Varaiya, Z. Jia, Freeway perfor- mance measurement system: mining loop detector data, Transp.Res.Rec. 1748 (1) (2001) 96–102
work page 2001
-
[13]
X. Liu, Y. Xia, Y. Liang, J. Hu, Y. Wang, L. Bai, C. Huang, Z. Liu, B. Hooi, R. Zimmermann, LargeST: a benchmark dataset for large-scale traffic forecasting, in: 37th Conference on Neural Information Processing Systems, NeurIPS, 2023, pp. 75354–75371
work page 2023
-
[14]
Z. Shao, Z. Zhang, F. Wang, Y. Xu, Pre-training enhanced spatial- temporal graph neural network for multivariate time series forecasting, in: Proceedings of the 28th ACM SIGKDD Conference on Knowledge Discovery and Data Mining, KDD ’22, ACM, 2022, p. 1567–1577.doi: 10.1145/3534678.3539396
-
[15]
H. Gao, R. Jiang, Z. Dong, J. Deng, Y. Ma, X. Song, Spatial- temporal-decoupled masked pre-training for spatiotemporal forecast- ing, in: K. Larson (Ed.), Proceedings of the Thirty-Third International Joint Conference on Artificial Intelligence, IJCAI, 2024, pp. 3998–4006. doi:10.24963/ijcai.2024/442
-
[16]
H. Han, M. Zhang, M. Hou, F. Zhang, Z. Wang, E. Chen, H. Wang, J. Ma, Q. Liu, STGCN: A spatial-temporal aware graph learning method for poi recommendation, in: 2020 IEEE International Conference on Data Mining, IEEE, 2020, pp. 1052–1057.doi:10.1109/ICDM50108. 2020.00124
-
[17]
L. Bai, L. Yao, C. Li, X. Wang, C. Wang, Adaptive graph convolutional recurrent network for traffic forecasting, in: 34th Conference on Neural Information Processing Systems, NeurIPS, 2020, pp. 17804–17815. 31
work page 2020
-
[18]
Y. Fang, Y. Qin, H. Luo, F. Zhao, B. Xu, L. Zeng, C. Wang, When spatio- temporal meet wavelets: Disentangled traffic forecasting via efficient spectral graph attention networks, in: 2023 IEEE 39th International Conference on Data Engineering, IEEE, 2023, pp. 517–529
work page 2023
-
[19]
J. Han, W. Zhang, H. Liu, T. Tao, N. Tan, H. Xiong, BigST: Linear complexity spatio-temporal graph neural network for traffic forecasting on large-scale road networks, Proc. VLDB Endow. 17 (5) (2024) 1081–1090. doi:10.14778/3641204.3641217
- [20]
-
[21]
Z. Fang, Q. Long, G. Song, K. Xie, Spatial-temporal graph ode networks for traffic flow forecasting, in: Proceedings of the 27th ACM SIGKDD Conference on Knowledge Discovery and Data Mining, ACM, 2021, p. 364–373.doi:10.1145/3447548.3467430
-
[22]
F. Li, J. Feng, H. Yan, G. Jin, F. Yang, F. Sun, D. Jin, Y. Li, Dynamic graph convolutional recurrent network for traffic prediction: Benchmark and solution, ACM Trans.Knowl.Discov.D. 17 (1) (2023) 1–21
work page 2023
-
[23]
Z. Shao, Z. Zhang, W. Wei, F. Wang, Y. Xu, X. Cao, C. S. Jensen, Decoupled dynamic spatial-temporal graph neural network for traffic forecasting, Proc. VLDB Endow. 15 (11) (2022) 2733–2746
work page 2022
-
[24]
Z. Li, L. Xia, Y. Xu, C. Huang, FlashST: A simple and universal prompt- tuning framework for traffic prediction, in: R. Salakhutdinov, Z. Kolter, K. Heller, A. Weller, N. Oliver, J. Scarlett, F. Berkenkamp (Eds.), Proceedings of the 41st International Conference on Machine Learning, Vol. 235, PMLR, 2024, pp. 28978–28988
work page 2024
-
[25]
Z. Shao, Z. Zhang, F. Wang, W. Wei, Y. Xu, Spatial-temporal identity: A simple yet effective baseline for multivariate time series forecasting, in: Proceedings of the 31st ACM International Conference on Information and Knowledge Management, ACM, 2022, p. 4454–4458.doi:10.1145/ 3511808.3557702
-
[26]
J. Deng, X. Chen, R. Jiang, X. Song, I. W. Tsang, ST-Norm: Spatial and temporal normalization for multi-variate time series forecasting, 32 in: Proceedings of the 27th ACM SIGKDD Conference on Knowledge Discovery and Data Mining, ACM, 2021, p. 269–278.doi:10.1145/ 3447548.3467330
-
[27]
H. Abdi, L. J. Williams, Principal component analysis, Wires.Comput.Stat. 2 (4) (2010) 433–459
work page 2010
-
[28]
L. McInnes, J. Healy, N. Saul, L. Grossberger, Umap: Uniform manifold approximation and projection, Joss. 3 (29) (2018) 861
work page 2018
-
[29]
Node2vec: Scalable feature learning for networks,
A. Grover, J. Leskovec, node2vec: Scalable feature learning for networks, in: Proceedings of the 22nd ACM SIGKDD International Conference on Knowledge Discovery and Data Mining, ACM, 2016, p. 855–864. doi:10.1145/2939672.2939754
-
[30]
M. Ou, P. Cui, J. Pei, Z. Zhang, W. Zhu, Asymmetric transitivity preserving graph embedding, in: Proceedings of the 22nd ACM SIGKDD international conference on Knowledge discovery and data mining, 2016, pp. 1105–1114
work page 2016
-
[31]
H. Wu, J. Xu, J. Wang, M. Long, Autoformer: Decomposition trans- formers with auto-correlation for long-term series forecasting, in: 35th Conference on Neural Information Processing Systems, NeurIPS, 2021, pp. 22419–22430
work page 2021
-
[32]
H. Zhou, S. Zhang, J. Peng, S. Zhang, J. Li, H. Xiong, W. Zhang, Informer: Beyond efficient transformer for long sequence time-series forecasting, in: Proceedings of the AAAI Conference on Artificial In- telligence, Vol. 35, AAAI, 2021, pp. 11106–11115.doi:10.1609/aaai. v35i12.17325
-
[33]
O. D. Anderson, Time-series. 2nd edn., Journal of the Royal Statistical Society. Series D (The Statistician) 25 (4) (1976) 308–310
work page 1976
-
[34]
R. J. Hyndman, G. Athanasopoulos, Forecasting: principles and practice, OTexts, 2018
work page 2018
-
[35]
Global Forecast System (NOAA, accessed 1 Sept. 2024);https://www. ncei.noaa.gov/. 33
work page 2024
-
[36]
H. Hersbach, B. Bell, P. Berrisford, S. Hirahara, A. Horányi, J. Muñoz- Sabater, J. Nicolas, C. Peubey, R. Radu, D. Schepers, et al., The era5 global reanalysis, Quarterly journal of the royal meteorological society 146 (730) (2020) 1999–2049
work page 2020
-
[37]
B. N. Oreshkin, G. Dudek, P. Pełka, E. Turkina, N-beats neural network for mid-term electricity load forecasting, Applied Energy 293 (2021) 116918
work page 2021
-
[38]
J. Lee-Thorp, J. Ainslie, I. Eckstein, S. Ontanon, FNet: Mixing tokens with Fourier transforms, in: M. Carpuat, M.-C. de Marneffe, I. V. Meza Ruiz (Eds.), Proceedings of the 2022 Conference of the North American Chapter of the Association for Computational Linguistics: Human Language Technologies, ACL, 2022, pp. 4296–4313.doi:10. 18653/v1/2022.naacl-main.319
work page 2022
-
[39]
D. Cao, Y. Wang, J. Duan, C. Zhang, X. Zhu, C. Huang, Y. Tong, B. Xu, J. Bai, J. Tong, et al., Spectral temporal graph neural network for multivariate time-series forecasting, in: 34th Conference on Neural Information Processing Systems, NeurIPS, 2020, pp. 17766–17778
work page 2020
-
[40]
T. Zhou, P. Niu, X. Wang, L. Sun, R. Jin, One fits all: power general time series analysis by pretrained lm, in: 37th Conference on Neural Information Processing Systems, NeurIPS, 2023, pp. 43322–43355
work page 2023
-
[41]
S. Wang, H. Wu, X. Shi, T. Hu, H. Luo, L. Ma, J. Y. Zhang, J. ZHOU, TimeMixer: Decomposable multiscale mixing for time series forecasting, in: International Conference on Learning Representations https:// openreview.net/forum?id=7oLshfEIC2, 2024
work page 2024
-
[42]
S. Banerjee, M. Dong, W. Shi, Spatial–temporal synchronous graph transformer network (STSGT) for COVID-19 forecasting, Smart.Health. 26 (2022) 100348
work page 2022
-
[43]
J. Xue, T. Yabe, K. Tsubouchi, J. Ma, S. Ukkusuri, Multiwave COVID-19 prediction from social awareness using web search and mobility data, in: Proceedings of the 28th ACM SIGKDD Conference on Knowledge Discovery and Data Mining, ACM, 2022, p. 4279–4289.doi:10.1145/ 3534678.3539172. 34
-
[44]
X. Pu, J. Zhu, Y. Wu, C. Leng, Z. Bo, H. Wang, Dynamic adap- tive spatio–temporal graph network for COVID-19 forecasting, CAAI Trans.Intell.Technol. 9 (3) (2024) 769–786
work page 2024
-
[45]
S. Deng, S. Wang, H. Rangwala, L. Wang, Y. Ning, Cola-GNN: Cross- location attention based graph neural networks for long-term ili pre- diction, in: Proceedings of the 29th ACM International Conference on Information and Knowledge Management, ACM, 2020, p. 245–254. doi:10.1145/3340531.3411975
-
[46]
1085–1088.doi:10.1145/3209978.3210077
Y.Wu, Y.Yang, H.Nishiura, M.Saitoh, Deeplearningforepidemiological predictions, in: The 41st International ACM SIGIR Conference on Research and Development in Information Retrieval, ACM, 2018, p. 1085–1088.doi:10.1145/3209978.3210077
-
[47]
J. Gao, R. Sharma, C. Qian, L. M. Glass, J. Spaeder, J. Romberg, J. Sun, C. Xiao, STAN: spatio-temporal attention network for pandemic prediction using real-world evidence, Journal of the American Medical Informatics Association 28 (4) (2021) 733–743
work page 2021
-
[48]
F. Xie, Z. Zhang, L. Li, B. Zhou, Y. Tan, EpiGNN: Exploring spatial transmission with graph neural network for regional epidemic forecasting, in: Joint European Conference on Machine Learning and Knowledge Discovery in Databases, Springer, 2022, p. 469–485. doi:10.1007/ 978-3-031-26422-1_29
work page 2022
-
[49]
I. Sutskever, O. Vinyals, Q. V. Le, Sequence to sequence learning with neural networks, in: 28th International Conference on Neural Information Processing Systems, NeurIPS, 2014, pp. 3104–3112. 35
work page 2014
discussion (0)
Sign in with ORCID, Apple, or X to comment. Anyone can read and Pith papers without signing in.