REVIEW 4 major objections 7 minor 43 references
Robust Uplift Modeling with Large-Scale Contexts for Real-time Marketing
T0 review · 4 major / 7 minor · reviewed 2026-08-10 · deepseek-v4-flash
Pith's one-line read The paper claims that grouping large-scale contexts before uplift modeling, then adding user-context and treatment-feature interactions, consistently improves incentive targeting in real-time marketing.
desk verdict A useful, reproducible uplift-with-contexts wrapper whose 'consistent improvement' claim overreaches its own Table 1; worth reviewing, needs honest evaluation and softer claims. read the letter →
The pith
A machine-rendered reading of the paper's core claim, the machinery that carries it, and where it could break.
The reading
What carries the argument
The load-bearing object is the response-guided context embedding produced by a Lipschitz-regularized regressor $f(\boldsymbol{x}^u, \xi_\theta(\boldsymbol{x}^c), t)$, whose squared-error loss is combined with a softplus parameterization of per-layer Lipschitz constants. Proposition 1 states that if $f$ is $c$-Lipschitz in the embedding and approximates the true response function $h$ within $\mu$, then the response-function distance between two contexts is bounded by $c$ times their embedding distance plus $2\mu$: $\|h(\boldsymbol{x}^u,\boldsymbol{x}^c_i,t) - h(\boldsymbol{x}^u,\boldsymbol{x}^c_j,t)\| \le c\,\|\xi(\boldsymbol{x}^c_i) - \xi(\boldsymbol{x}^c_j)\|_2 + 2\mu$. This justifies clustering the learned embeddings with K-means: nearby embeddings mean nearby response functions, so the bias from merging contexts stays small. The grouped and relabeled data then feeds any base uplift model, while the feature interaction module adds a parallel co-attention for user-context response prediction and a cross-attention mechanism that computes the treatment information gain $\hat{\boldsymbol{e}}_\Delta = \boldsymbol{a}^1_t * \hat{\boldsymbol{e}}_f - \boldsymbol{a}^0_t * \hat{\boldsymbol{e}}_f$, used both as a per-sample loss weight and as an additive uplift prediction.
What would settle it
On a synthetic dataset where contexts are clustered by equal average response but opposite treatment effects, run UMLC and compare its precision-in-estimation-of-heterogeneous-effect ($\epsilon_{PEHE}$) and QINI against a base model that keeps individual context features; if performance drops, the grouping step has introduced treatment-effect bias that the response-based bound in Proposition 1 does not control.
Extended reading notes
Core claim
The central claim is that large-scale context features can be handled before uplift modeling by turning them into a small number of response-guided groups, and that explicit feature interactions then let the model find treatment-sensitive samples. UMLC trains a response regression on user features, context embeddings and treatment with Lipschitz regularization, so that close embeddings in context space mean close effects on the response; K-means clustering of those embeddings gives context groups, and samples with the same user, treatment and group are averaged into one relabeled instance. Around this, a feature interaction module predicts the control response with user-context co-attention and predicts uplift with a cross-attention that computes the information gain between treatment-embedding attention weights, using that gain both as an additive uplift term and as a per-sample loss weight. The paper's experiments show that four base uplift models (CFRNet, DragonNet, EUEN, UniTE), when wrapped in UMLC, beat their unmodified versions on AUUC, QINI and KENDALL on both datasets, and that the synthetic ground-truth evaluation shows lower absolute error on the average treatment effect ($\epsilon_{ATE}$) and on PEHE.
Load-bearing premise
The whole method assumes that contexts placed in the same group really do have nearly the same effect on the user's response, so that averaging their outcomes into one relabeled sample does not distort the estimate of how much the treatment changes behavior.
Editorial extensions
If this is right
- Wrapping UMLC around CFRNet, DragonNet, EUEN or UniTE improves AUUC and QINI on both datasets, with the largest gains on QINI, so existing uplift models can be upgraded without changing their internals.
- Removing any of the three components (context grouping, user-context interaction, or treatment-feature interaction) lowers performance in the ablation study, so the gain is not concentrated in a single module.
- The synthetic ground-truth comparison shows that UMLC variants reduce absolute error on average treatment effect ($\epsilon_{ATE}$) and PEHE relative to baselines, indicating the metric gains reflect better treatment-effect estimation, not just ranking noise.
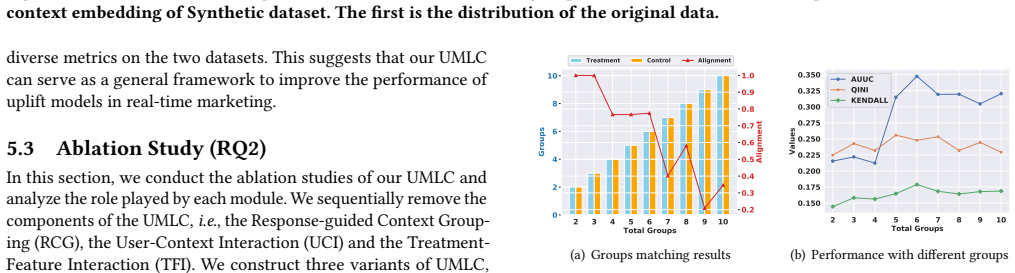
- The group count $K$ can be read off the trained embedding: alignment between treatment and control group assignments and model performance both peak near the true number of response groups, so the framework does not require an expensive search for $K$.
- The production dataset confirms the framework on real short-video data where video clarity acts as the treatment and viewing time as the response, supporting applicability in deployed platforms.
Reading between the lines
- The theory only bounds the distance between response functions inside a cluster, not the distance between treatment effects; a clustered context with an average response like its neighbors but an opposite treatment effect could bias the uplift estimate even when Assumption 1 holds on the response.
- Because the framework claims compatibility across different cluster algorithms (K-means, hierarchical, spectral, DBSCAN) and base models, the effective ingredient is likely the Lipschitz-regularized embedding plus aggregation, which could transfer to other per-item decision settings such as ad creative ranking or news recommendation.
- The experiments use randomized treatment assignment; a natural extension is to test whether the response-guided grouping also corrects selection bias in observational data, where treatment and control groups differ in user features as well as contexts.
Signed reviews
Editorial analysis
A structured set of objections, weighed in public.
Referee Report
Summary. The paper proposes UMLC, a model-agnostic framework for uplift modeling in real-time marketing with large-scale context features. UMLC comprises two modules: a response-guided context grouping (RCG) module that learns context embeddings and clusters them into groups, and a feature interaction module with user-context interaction (UCI) and treatment-feature interaction (TFI). The framework is wrapped around several base uplift models (CFRNet, DragonNet, EUEN, UniTE, and meta-learners) and evaluated on a synthetic dataset with ground-truth potential outcomes and on a production dataset from a short-video platform. The paper claims consistent performance improvements, especially on QINI, supported by a theoretical analysis (Assumptions 1-2, Proposition 1) and extensive experiments including ablations, hyperparameter analysis, and ground-truth uplift evaluation.
Significance. If the framework delivers what it claims, it addresses a practically important gap: most uplift models ignore context features, while real-time marketing requires per-item incentives. The paper's strengths include a publicly available codebase, a synthetic dataset with ground-truth CATE, a production experiment, and compatibility tests across multiple base models. The ground-truth synthetic evaluation (Table 4) provides independent evidence beyond the QINI-tuned comparisons. However, the central claim of consistent improvement is not fully established by the reported experiments, and the theory does not directly bound the CATE error introduced by grouping and aggregation. With targeted revisions, the paper could be a solid industrial contribution.
major comments (4)
- [§5.2, Table 1] The claim that UMLC 'can consistently achieve performance improvement' on different uplift models is contradicted by several cells in Table 1. For example: Synthetic AUUC for DragonNet (0.2549±0.0208 vs 0.2574±0.0365), Synthetic KENDALL for CFRNet-mmd (0.1647±0.0152 vs 0.1689±0.0134) and CFRNet-wass (0.1584±0.0112 vs 0.1594±0.0166), Production QINI for DragonNet (1.8514±0.0463 vs 1.8750±0.0522), and Production KENDALL for EUEN (0.2631±0.0251 vs 0.3157±0.0220) and DragonNet (0.3368±0.0265 vs 0.3894±0.0258). Because the standard deviations overlap in many comparisons and no significance tests are reported, the conclusion that UMLC is a general framework that improves arbitrary base models is not supported by the evidence. Please report paired significance tests across the five seeds, quantify the number of wins/losses across metrics and base models, and revise the wording to match the empirical pattern.
- [§5.1.3 and §5.2] All models, including baselines, are tuned with QINI as the reference objective, and the paper highlights QINI as the key improvement metric. This introduces a selection effect: the QINI gains partly reflect the hyperparameter search objective rather than the framework itself. The text explicitly acknowledges this ('This may be because we tune the model hyperparameters by using the QINI as the objective'), which is honest but weakens the headline claim. The synthetic ground-truth results in Table 4 provide some independent support, but to disentangle the framework effect from the tuning objective, please also report results where hyperparameters are selected on AUUC or KENDALL, or at least report the validation-set QINI used for early stopping. This is important because the mixed AUUC and KENDALL results in Table 1 suggest the framework's benefit is metric- and base-model-specific.
- [§4.1.2, Eqs. (4)-(9)] The theoretical analysis bounds the distance of the response function h between contexts within a group (Assumption 1 and Proposition 1), but the method's grouping and aggregation operate on observed responses y (Eq. 9) and are used to predict uplift τ, the difference of conditional means under treatment and control. The paper does not show that the relabeled dataset preserves the CATE or that the grouping bias on the uplift is controlled. If contexts within a cluster have heterogeneous treatment effects, averaging responses as in Eq. (9) can introduce bias in the uplift estimate that is not bounded by the paper's theory, which only bounds the response function distance. Please either add a theoretical statement bounding the error in CATE introduced by grouping and aggregation (e.g., under an additional Lipschitz condition on the treatment effect), or clearly state the limitation and soften the theoretical claims accordingly.
- [§5.3, Table 2] The ablation study's conclusion that 'removing any part may bring performance degradation' and that this verifies the validity of each component is not uniformly supported by Table 2. For instance, for UMLC (DragonNet) on Synthetic AUUC, removing RCG improves the mean from 0.2549 to 0.3094; for UMLC (EUEN) on Production KENDALL, removing RCG improves the mean from 0.2631 to 0.3789; and for UMLC (CFRNet-mmd) on Production KENDALL, removing RCG gives 0.3578 vs 0.3473. Since no significance tests are reported and the standard deviations are large, the claim that each component is always helpful is too strong. Please analyze which components contribute on which metrics and base models, and discuss the possibility of negative interactions. This is directly relevant to RQ2.
minor comments (7)
- [Figure 7] Figure 7 is described as a figure but contains a tabular structure (Top s% rows and columns); please format it consistently as either a table or a figure, and mention it in the text accordingly.
- [Figure 8 captions] The captions for Figure 8 contain the typo 'Synthenic' in three places; change to 'Synthetic'.
- [§5.1.1 (Production dataset)] The production experiment defines treatment as high-clarity versus low-clarity video, which is a content-quality change rather than an incentive such as a discount or bonus. Please clarify how this maps to the 'incentive' formulation used in the introduction and problem statement.
- [Eq. (15)] The scaling factor in the cross-attention is written as sqrt(K_d), where K_d is later described as the output embedding dimension; typically the scaling is the square root of the key dimension. Please state the dimension convention explicitly and check the notation.
- [§C.3 (KENDALL metric)] The description of the KENDALL metric is vague: it says 'average predicted uplift and the predicted uplift in each bin' but does not specify whether the correlation is between predicted and binned actual uplift, how bins are formed, or whether it is Kendall's tau-a or tau-b. Please provide a precise definition in the main text or appendix.
- [§4.1.3, Eq. (8)] The paper states that the Lipschitz regularization weight α is set to 10^-4 in all experiments because 'the value of α is stated to be minimal,' citing [20]. Since α is a free parameter, please provide a sensitivity analysis for α or empirical justification from a validation set, as is done for β and γ in Figure 8.
- [§4.2.2, Eq. (18)] The sample-weight term w_batch is computed as the softmax over exp(τ̃ - τ̂), i.e., using the model's own predictions to reweight the loss. This can create a feedback loop where the model upweights samples it already predicts as having high uplift. Please discuss this potential self-reinforcing bias and whether any regularization or gradient-stopping is applied to the weight computation.
Circularity Check
QINI headline gain is partly an artifact of tuning on QINI; the framework's core derivation and other benchmark results remain self-contained.
-
fitted input called prediction
[Section 5.1.3 (Implementation Details) and Section 5.2 (Overall Performance), Table 1]
"We use the QINI as a reference to search for the best hyper-parameters for all baselines and our model. ... integrating our UMLC on different uplift models can consistently achieve performance improvement, especially on QINI. This may be because we tune the model hyperparameters by using the QINI as the objective."
The headline evidence for UMLC is the QINI improvement, but QINI is exactly the objective used for hyperparameter selection. The reported 'especially on QINI' gain is therefore not an independent confirmation of the framework; it is the metric being optimized during model selection, and the paper's own explanation attributes the gain to the tuning protocol. The claim is statistically forced in the sense that selecting all models on QINI inflates their QINI, and the paper highlights this same score. The AUUC, KENDALL, and ground-truth PEHE results remain independent evidence, so the circularity is partial.
full rationale
The derivation chain is otherwise self-contained. Assumptions 1 and 2 plus Proposition 1 form a conditional mathematical argument: the bound on context-grouping error follows from the existence of a predictive, Lipschitz-regularized regressor; this is a triangle-inequality theorem rather than a circular prediction, though it is also not an external check because the bound is satisfied by construction when the training objective succeeds. The synthetic data is generated to satisfy Assumption 1, so the favorable K=6 grouping result is an internal-consistency check rather than independent validation. The self-citations in the paper, particularly [18] and [34] by overlapping authors, appear only as related-work context and are not load-bearing for the central claim; no uniqueness theorem is imported from prior work. The assertion of 'consistent' improvement is weakened by several Table 1 cells where UMLC underperforms its base model (e.g., Synthetic AUUC for DragonNet 0.2549 vs 0.2574, Production QINI for DragonNet 1.8514 vs 1.8750, Production KENDALL for EUEN 0.2631 vs 0.3157), but that is an evidence-quality concern rather than circularity. Overall, the core framework has independent grounding in ground-truth PEHE and the production experiment, with one partial circularity in the QINI claim, giving a score of 4.
Assumptions & free parameters
free parameters (4)
- Number of context groups K =
6 (Synthetic), ~20 (Production)
- Lipschitz regularization weight alpha =
1e-4
- Treatment-feature interaction loss weight beta =
tuned via Optuna (range 0.1-0.9)
- Information-gain regularization weight gamma =
tuned via Optuna (range 0.1-0.9)
assumptions (5)
- domain assumption Neyman-Rubin potential outcomes framework with unconfoundedness and overlap, so that CATE is identifiable from observed data.
- ad hoc to paper Within a context group, contexts have a similar effect on the response: |E[y|x_u,x_c^i,t] - E[y|x_u,x_c^j,t]| <= delta for all i,j in the same group.
- ad hoc to paper There exists a transformation xi such that the response function is Lipschitz in xi up to constants zeta, eta (Assumption 2).
- ad hoc to paper K-means on the learned context embedding yields groups that satisfy Assumption 1.
- domain assumption Treatment assignment is independent of context features in the RCT data (randomization).
invented entities (1)
-
Context group label g (proxy context)
Cite this review
Pith. "Pith review of Robust Uplift Modeling with Large-Scale Contexts for Real-time Marketing." pith.science (2026). https://pith.science/paper/AQDHJG7W
@misc{pith2026250215697,
  author       = {Pith},
  title        = {Pith review of: Robust Uplift Modeling with Large-Scale Contexts for Real-time Marketing},
  year         = {2026},
  howpublished = {\url{https://pith.science/paper/AQDHJG7W}},
  note         = {Machine review of arXiv:2502.15697}
}
read the original abstract
Improving user engagement and platform revenue is crucial for online marketing platforms. Uplift modeling is proposed to solve this problem, which applies different treatments (e.g., discounts, bonus) to satisfy corresponding users. Despite progress in this field, limitations persist. Firstly, most of them focus on scenarios where only user features exist. However, in real-world scenarios, there are rich contexts available in the online platform (e.g., short videos, news), and the uplift model needs to infer an incentive for each user on the specific item, which is called real-time marketing. Thus, only considering the user features will lead to biased prediction of the responses, which may cause the cumulative error for uplift prediction. Moreover, due to the large-scale contexts, directly concatenating the context features with the user features will cause a severe distribution shift in the treatment and control groups. Secondly, capturing the interaction relationship between the user features and context features can better predict the user response. To solve the above limitations, we propose a novel model-agnostic Robust Uplift Modeling with Large-Scale Contexts (UMLC) framework for Real-time Marketing. Our UMLC includes two customized modules. 1) A response-guided context grouping module for extracting context features information and condensing value space through clusters. 2) A feature interaction module for obtaining better uplift prediction. Specifically, this module contains two parts: a user-context interaction component for better modeling the response; a treatment-feature interaction component for discovering the treatment assignment sensitive feature of each instance to better predict the uplift. Moreover, we conduct extensive experiments on a synthetic dataset and a real-world product dataset to verify the effectiveness and compatibility of our UMLC.
Figures


Figures from the paper (8 more)



Reference graph
Works this paper leans on
-
[1]
Takuya Akiba, Shotaro Sano, Toshihiko Yanase, Takeru Ohta, and Masanori Koyama. 2019. Optuna: A next-generation hyperparameter optimization frame- work. In Proceedings of the 25th ACM SIGKDD international conference on knowl- edge discovery & data mining . 2623–2631
2019
-
[2]
Susan Athey and Stefan Wager. 2019. Estimating treatment effects with causal forests: An application. Observational studies 5, 2 (2019), 37–51
work page 2019
-
[3]
Mouloud Belbahri, Alejandro Murua, Olivier Gandouet, and Vahid Partovi Nia
-
[4]
Ola Bratteli and Derek William Robinson. 2012. Operator algebras and quantum statistical mechanics: Volume 1: C*-and W*-Algebras. Symmetry Groups. Decom- position of States. Springer Science & Business Media
work page 2012
-
[5]
Dimitrios Buhalis and Marie Foerste. 2015. SoCoMo marketing for travel and tourism: Empowering co-creation of value. Journal of destination marketing & management 4, 3 (2015), 151–161
work page 2015
-
[6]
Dimitrios Buhalis and Yeyen Sinarta. 2019. Real-time co-creation and nowness service: lessons from tourism and hospitality. Journal of Travel & Tourism Mar- keting 36, 5 (2019), 563–582
work page 2019
-
[7]
Muffy Calder, Mario Kolberg, Evan H Magill, and Stephan Reiff-Marganiec. 2003. Feature interaction: a critical review and considered forecast. Computer Networks 41, 1 (2003), 115–141
work page 2003
-
[8]
Huigang Chen, Totte Harinen, Jeong-Yoon Lee, Mike Yung, and Zhenyu Zhao
Show all 43 references
-
[9]
Per-Erik Danielsson. 1980. Euclidean distance mapping. Computer Graphics and image processing 14, 3 (1980), 227–248
1980
-
[10]
Eustache Diemert, Artem Betlei, Christophe Renaudin, and Massih-Reza Amini
-
[11]
Markus Frölich. 2004. Finite-sample properties of propensity-score matching and weighting estimators. Review of Economics and Statistics 86, 1 (2004), 77–90
2004
-
[12]
Chunjing Gan, Dan Yang, Binbin Hu, Ziqi Liu, Yue Shen, Zhiqiang Zhang, Jinjie Gu, Jun Zhou, and Guannan Zhang. 2023. Making Large Language Models Better Knowledge Miners for Online Marketing with Progressive Prompting Augmentation. arXiv preprint arXiv:2312.05276 (2023)
2023 arXiv
-
[13]
Yury Gorishniy, Ivan Rubachev, and Artem Babenko. 2022. On embeddings for numerical features in tabular deep learning. Advances in Neural Information Processing Systems 35 (2022), 24991–25004
2022
-
[14]
Patrik Hoyer, Dominik Janzing, Joris M Mooij, Jonas Peters, and Bernhard Schölkopf. 2008. Nonlinear causal discovery with additive noise models.Advances in neural information processing systems 21 (2008)
2008
-
[15]
Abdul Jabbar, Pervaiz Akhtar, and Samir Dani. 2020. Real-time big data processing for instantaneous marketing decisions: A problematization approach. Industrial Marketing Management 90 (2020), 558–569
2020
-
[16]
Wenwei Ke, Chuanren Liu, Xiangfu Shi, Yiqiao Dai, S Yu Philip, and Xiaoqiang Zhu. 2021. Addressing exposure bias in uplift modeling for large-scale online advertising. In 2021 IEEE International Conference on Data Mining (ICDM) . IEEE, 1156–1161
2021
-
[17]
Sören R Künzel, Jasjeet S Sekhon, Peter J Bickel, and Bin Yu. 2019. Metalearners for estimating heterogeneous treatment effects using machine learning. Proceedings of the national academy of sciences 116, 10 (2019), 4156–4165
2019
-
[18]
Dugang Liu, Xing Tang, Han Gao, Fuyuan Lyu, and Xiuqiang He. 2023. Explicit Feature Interaction-aware Uplift Network for Online Marketing. arXiv preprint arXiv:2306.00315 (2023)
2023 arXiv
-
[19]
Guodong Liu, Yan Xu, and Kevin Tomsovic. 2015. Bidding strategy for micro- grid in day-ahead market based on hybrid stochastic/robust optimization. IEEE Transactions on Smart Grid 7, 1 (2015), 227–237
2015
-
[20]
Hsueh-Ti Derek Liu, Francis Williams, Alec Jacobson, Sanja Fidler, and Or Litany
-
[21]
Runshi Liu and Zhipeng Hou. 2023. UniTE: A Unified Treatment Effect Estimation Method for One-sided and Two-sided Marketing. In Proceedings of the 32nd ACM International Conference on Information and Knowledge Management . 1472–1481
2023
-
[22]
Yun Liu, Yuanzheng Li, Hoay Beng Gooi, Ye Jian, Huanhai Xin, Xichen Jiang, and Jianfei Pan. 2017. Distributed robust energy management of a multimicrogrid system in the real-time energy market. IEEE Transactions on Sustainable Energy 10, 1 (2017), 396–406
2017
-
[23]
Jiasen Lu, Jianwei Yang, Dhruv Batra, and Devi Parikh. 2016. Hierarchical question-image co-attention for visual question answering. Advances in neural information processing systems 29 (2016)
2016
-
[24]
Jiaqi Ma, Zhe Zhao, Xinyang Yi, Jilin Chen, Lichan Hong, and Ed H Chi. 2018. Modeling task relationships in multi-task learning with multi-gate mixture-of- experts. In Proceedings of the 24th ACM SIGKDD international conference on knowledge discovery & data mining . 1930–1939
2018
-
[25]
Belbahri Mouloud, Gandouet Olivier, and Kazma Ghaith. 2020. Adapting neural networks for uplift models. arXiv preprint arXiv:2011.00041 (2020)
2020 arXiv
-
[26]
Jie Peng, Hao Zou, Jiashuo Liu, Shaoming Li, Yibao Jiang, Jian Pei, and Peng Cui. 2023. Offline policy evaluation in large action spaces via outcome-oriented action grouping. In Proceedings of the ACM Web Conference 2023 . 1220–1230
2023
-
[27]
Nicholas J Radcliffe and Patrick D Surry. 2011. Real-world uplift modelling with significance-based uplift trees. White Paper TR-2011-1, Stochastic Solutions (2011), 1–33
2011
-
[28]
Donald B Rubin. 2005. Causal inference using potential outcomes: Design, mod- eling, decisions. J. Amer. Statist. Assoc. 100, 469 (2005), 322–331
2005
-
[29]
Piotr Rzepakowski and Szymon Jaroszewicz. 2010. Decision trees for uplift modeling. In 2010 IEEE International Conference on Data Mining . IEEE, 441–450
2010
-
[30]
Piotr Rzepakowski and Szymon Jaroszewicz. 2012. Decision trees for uplift mod- eling with single and multiple treatments. Knowledge and Information Systems 32 (2012), 303–327
2012
-
[31]
Uri Shalit, Fredrik D Johansson, and David Sontag. 2017. Estimating individual treatment effect: generalization bounds and algorithms. InInternational conference on machine learning. PMLR, 3076–3085
2017
-
[32]
Claudia Shi, David Blei, and Victor Veitch. 2019. Adapting neural networks for the estimation of treatment effects. Advances in neural information processing systems 32 (2019)
2019
-
[33]
Yang Sun, Junwei Pan, Alex Zhang, and Aaron Flores. 2021. FM2: Field-matrixed factorization machines for recommender systems. In Proceedings of the web conference 2021. 2828–2837
2021
-
[34]
Zexu Sun, Bowei He, Ming Ma, Jiakai Tang, Yuchen Wang, Chen Ma, and Dugang Liu. 2023. Robustness-enhanced Uplift Modeling with Adversarial Feature De- sensitization. arXiv preprint arXiv:2310.04693 (2023)
2023 arXiv
-
[35]
Wanjie Tao, Huihui Liu, Xuqi Li, Qun Dai, Hong Wen, and Zulong Chen. 2023. Event-Aware Adaptive Clustering Uplift Network for Insurance Creative Ranking. In Proceedings of the 46th International ACM SIGIR Conference on Research and Development in Information Retrieval . 1966–1970
2023
-
[36]
Ruoxi Wang, Rakesh Shivanna, Derek Cheng, Sagar Jain, Dong Lin, Lichan Hong, and Ed Chi. 2021. Dcn v2: Improved deep & cross network and practical lessons for web-scale learning to rank systems. In Proceedings of the web conference 2021 . 1785–1797
2021
-
[37]
Anpeng Wu, Kun Kuang, Ruoxuan Xiong, Bo Li, and Fei Wu. 2023. Stable estimation of heterogeneous treatment effects. In International Conference on Machine Learning. PMLR, 37496–37510
2023
-
[38]
Liuyi Yao, Sheng Li, Yaliang Li, Mengdi Huai, Jing Gao, and Aidong Zhang. 2018. Representation learning for treatment effect estimation from observational data. Advances in neural information processing systems 31 (2018)
2018
-
[39]
Weijia Zhang, Jiuyong Li, and Lin Liu. 2021. A unified survey of treatment effect heterogeneity modelling and uplift modelling. ACM Computing Surveys (CSUR) 54, 8 (2021), 1–36. 9 KDD ’25, August 3–7, 2025, Toronto, ON, Canada Zexu Sun, et al. A PROOF OF PROPOSITION 1 Propositi...
2021
-
[2018]
A large scale benchmark for uplift modeling. In KDD
-
[2020]
arXiv preprint arXiv:2002.11631 (2020)
Causalml: Python package for causal machine learning. arXiv preprint arXiv:2002.11631 (2020)
2020 arXiv
-
[2021]
The Annals of Applied Statistics 15, 3 (2021), 1247–1272
Qini-based uplift regression. The Annals of Applied Statistics 15, 3 (2021), 1247–1272
2021
-
[2022]
In ACM SIGGRAPH 2022 Conference Proceedings
Learning smooth neural functions via lipschitz regularization. In ACM SIGGRAPH 2022 Conference Proceedings . 1–13
2022
Reviewed August 10, 2026 · model on record in the stance chip above.
Discussion (0). Continue with ORCID to comment.