Descriptor Covariance and Correlation Hierarchy in Moir\'e Exciton Photoluminescence
Pith reviewed 2026-06-27 23:31 UTC · model grok-4.3
The pith
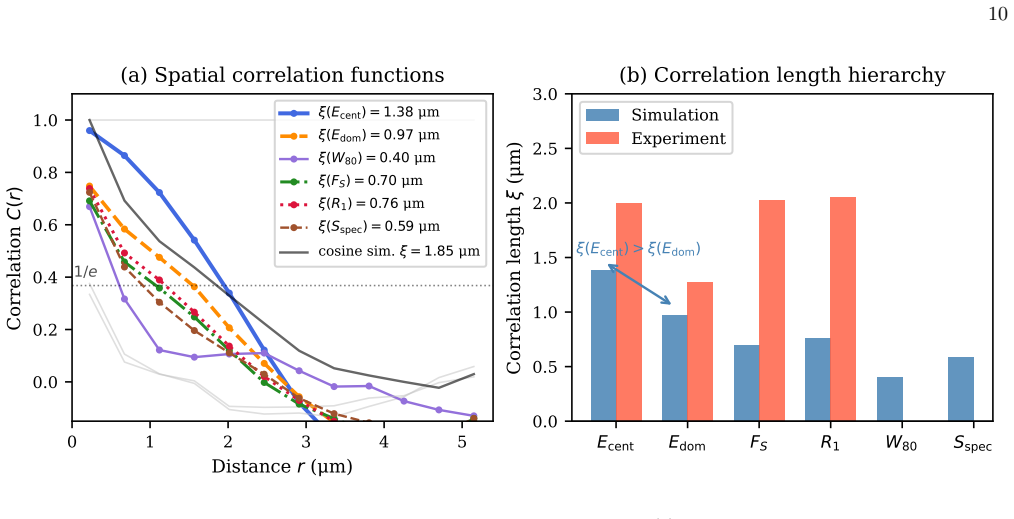
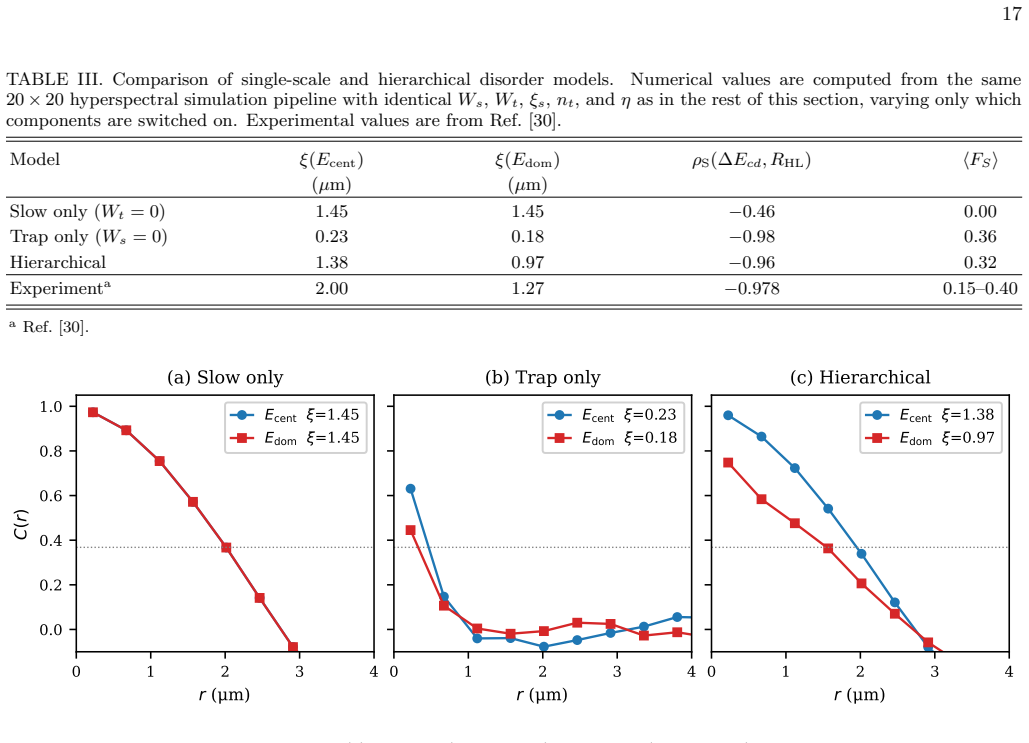
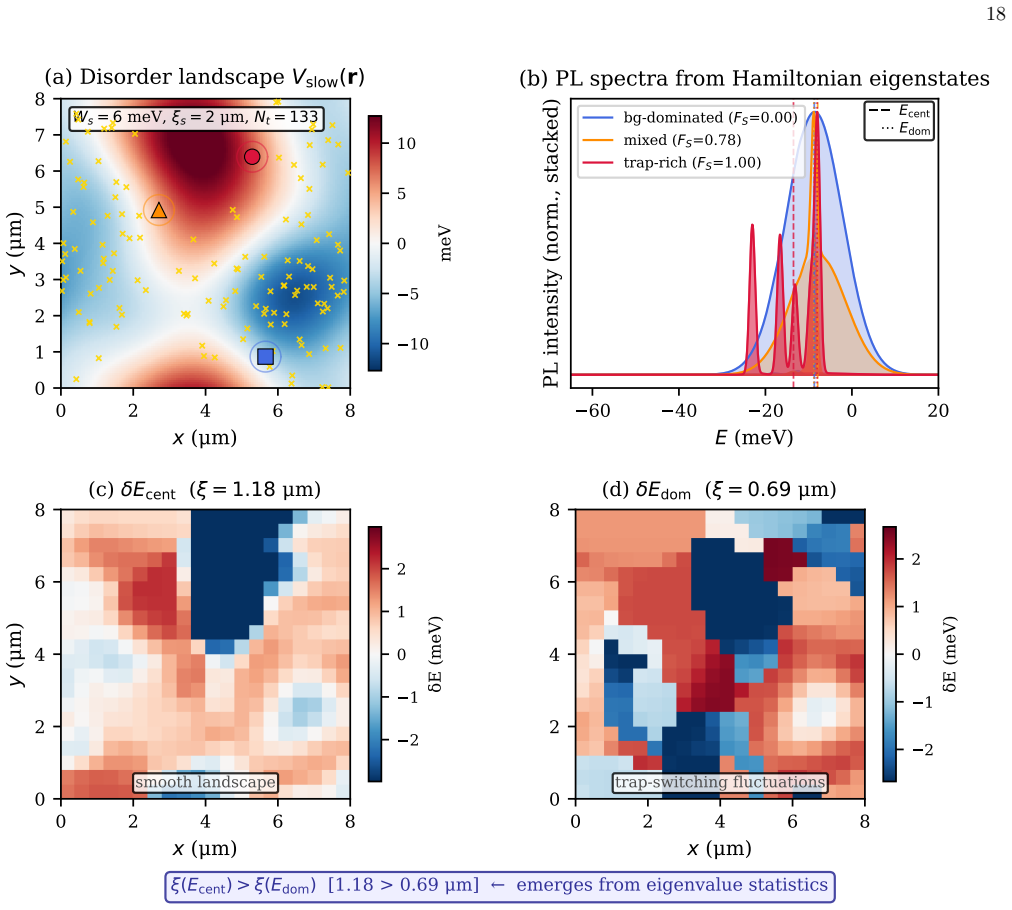
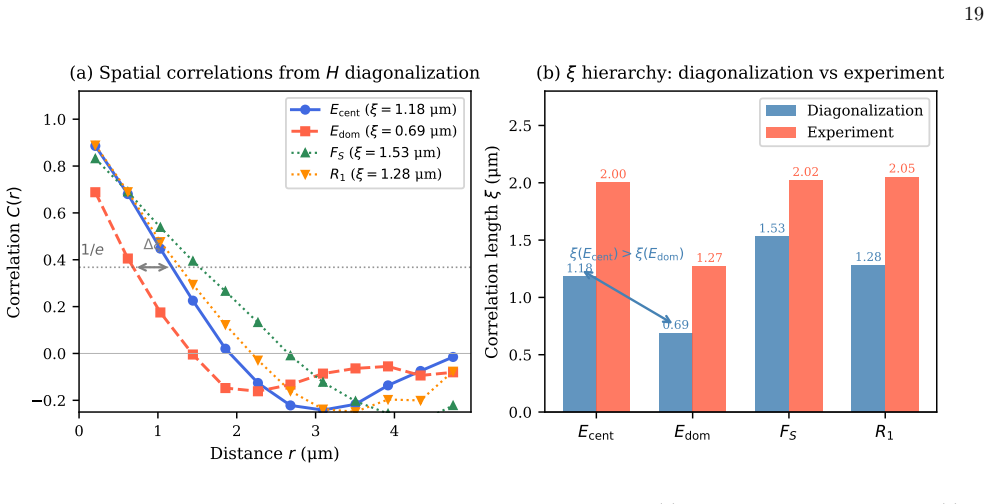
Dominant-peak energy in moiré photoluminescence decomposes into background and short-range fluctuation terms that enforce the spatial correlation hierarchy ξ(E_cent) ≥ ξ(E_dom).
A machine-rendered reading of the paper's core claim, the machinery that carries it, and where it could break.
Core claim
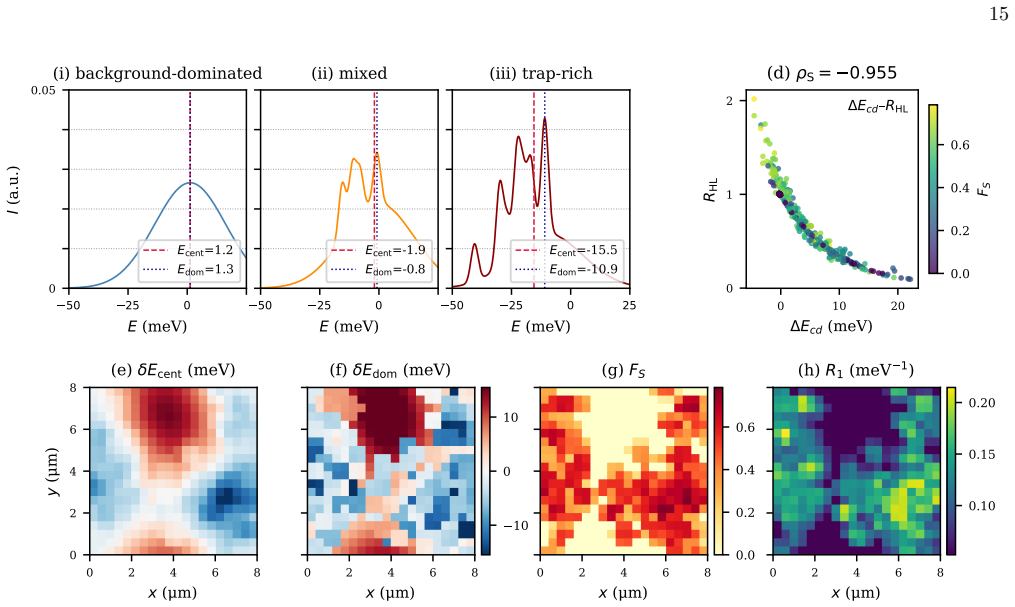
The central result is the correlation hierarchy ξ(E_cent) ≥ ξ(E_dom), derived from the decomposition of the dominant-peak energy into a smooth background contribution and a short-range trap-switching fluctuation term. The same framework explains the principal inter-descriptor Spearman correlations, including the near-perfect anti-correlation ρ_S(ΔE_cd, R_HL) ≈ -0.978 as a robust spectral-shape relation for spectra with a dominant unimodal envelope. The framework provides a peak-decomposition-free route to infer effective disorder parameters from hyperspectral data through the descriptor covariance structure, without microscopic line assignment.
What carries the argument
Decomposition of dominant-peak energy into a shared smooth background term plus an additive short-range trap-switching fluctuation term that selectively shortens the correlation length of the dominant energy.
If this is right
- The correlation hierarchy ξ(E_cent) ≥ ξ(E_dom) follows directly once the energy decomposition is accepted.
- The near-perfect anti-correlation ρ_S(ΔE_cd, R_HL) ≈ -0.978 is a geometric consequence of the unimodal envelope shape.
- Effective disorder parameters can be read from the descriptor covariance matrix without assigning microscopic lines.
- Different descriptors act as filters that isolate distinct components of the multi-scale disorder landscape.
Where Pith is reading between the lines
- The same decomposition could be tested by comparing correlation lengths extracted at different temperatures, where trap-switching rates change.
- If the background term is truly smooth on the micron scale, its correlation length should approach the sample size in the absence of longer-range strain gradients.
- Descriptor covariance matrices from other moiré systems could be compared to extract relative strengths of trap versus background disorder.
Load-bearing premise
The dominant-peak energy can be decomposed into a smooth background contribution and a short-range trap-switching fluctuation term that directly produces the observed spatial correlation hierarchy.
What would settle it
A hyperspectral map in which the measured spatial correlation length of the dominant-peak energy exceeds that of the central energy would falsify the hierarchy.
Figures

read the original abstract
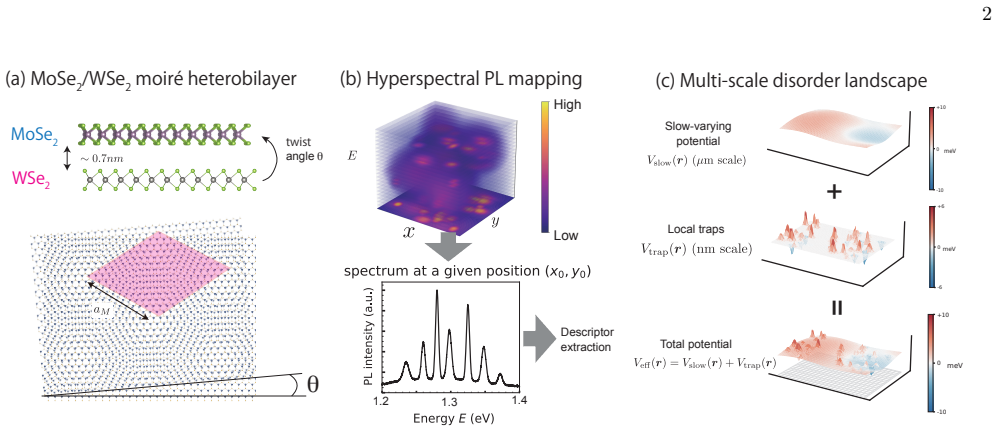
We develop a minimal theory for the spatial organization of photoluminescence spectra in moir\'e transition-metal dichalcogenide heterobilayers. Motivated by hyperspectral mapping of MoSe$_2$/WSe$_2$, which reveals micron-scale correlations among nine peak-decomposition-free spectral descriptors, we propose a descriptor-based disorder-filter picture in which different descriptors probe different components of a multi-scale disorder landscape, producing a hierarchy of spatial correlation lengths. The central result is the correlation hierarchy $\xi(E_{\rm cent}) \ge \xi(E_{\rm dom})$, derived from the decomposition of the dominant-peak energy into a smooth background contribution and a short-range trap-switching fluctuation term. The same framework explains the principal inter-descriptor Spearman correlations, including the near-perfect anti-correlation $\rho_{\rm S}(\Delta E_{\rm cd}, R_{\rm HL}) \approx -0.978$ as a robust spectral-shape relation for spectra with a dominant unimodal envelope. The framework provides a peak-decomposition-free route to infer effective disorder parameters from hyperspectral data through the descriptor covariance structure, without microscopic line assignment.
Editorial analysis
A structured set of objections, weighed in public.
Referee Report
Summary. The manuscript develops a minimal theory for the spatial organization of photoluminescence spectra in moiré TMD heterobilayers, motivated by hyperspectral mapping of MoSe₂/WSe₂ that reveals micron-scale correlations among nine peak-decomposition-free spectral descriptors. It proposes a descriptor-based disorder-filter picture in which different descriptors probe different components of a multi-scale disorder landscape. The central result is the correlation hierarchy ξ(E_cent) ≥ ξ(E_dom), derived from decomposing the dominant-peak energy into a smooth background contribution plus a short-range trap-switching fluctuation term. The framework also accounts for principal inter-descriptor Spearman correlations, including ρ_S(ΔE_cd, R_HL) ≈ -0.978 as a spectral-shape relation, and offers a route to infer effective disorder parameters from descriptor covariance without microscopic line assignment.
Significance. If the decomposition is shown to be robust and the hierarchy holds under realistic moiré disorder, the work provides a useful peak-decomposition-free interpretive framework for hyperspectral data in moiré excitonics. The direct connection between observed descriptor covariances and multi-scale disorder components could aid extraction of effective parameters from experiment. The grounding in real hyperspectral maps is a positive feature.
major comments (2)
- [§3] §3 (derivation of the hierarchy): The central claim that ξ(E_cent) ≥ ξ(E_dom) follows directly from writing E_dom = E_background(smooth, long-range) + δE_trap(short-range) is load-bearing, yet the manuscript supplies no explicit functional form for the two terms, no disorder Hamiltonian, and no numerical test confirming that E_cent remains insensitive to the trap term when the background itself contains sub-micron variations. Without such a demonstration the inequality is not guaranteed by the decomposition alone.
- [§4] §4 (validation against data): The abstract and framework state that the same decomposition explains the observed inter-descriptor correlations, but no quantitative comparison (e.g., predicted vs. measured correlation lengths or error bars on ξ values) is shown to establish that the hierarchy survives when trap switching perturbs the centroid or when background fluctuations are not strictly long-range. This leaves the generality of the result unverified.
minor comments (1)
- Notation for the nine descriptors is introduced without a compact table summarizing their definitions and units; adding one would improve readability.
Simulated Author's Rebuttal
We thank the referee for the careful reading and constructive comments on our manuscript. We address each major comment point by point below, indicating where revisions will strengthen the work while defending the core logic of the descriptor-based disorder-filter framework.
read point-by-point responses
-
Referee: [§3] §3 (derivation of the hierarchy): The central claim that ξ(E_cent) ≥ ξ(E_dom) follows directly from writing E_dom = E_background(smooth, long-range) + δE_trap(short-range) is load-bearing, yet the manuscript supplies no explicit functional form for the two terms, no disorder Hamiltonian, and no numerical test confirming that E_cent remains insensitive to the trap term when the background itself contains sub-micron variations. Without such a demonstration the inequality is not guaranteed by the decomposition alone.
Authors: We agree that an explicit demonstration strengthens the claim. The decomposition E_dom = E_background + δE_trap logically implies the hierarchy because E_cent is constructed to average over the full spectral envelope and is therefore dominated by the long-range background term, while E_dom is directly shifted by the short-range trap term; this follows from the definitions of the descriptors without requiring a specific Hamiltonian. Nevertheless, to address the concern, the revised manuscript will add a minimal numerical model in Section 3 (or an appendix) with explicit forms: E_background drawn from a Gaussian random field with tunable correlation length >1 μm and δE_trap as an independent short-range (sub-100 nm) fluctuation. Simulations will confirm that E_cent remains insensitive to δE_trap even when the background contains sub-micron variations, thereby verifying ξ(E_cent) ≥ ξ(E_dom). revision: yes
-
Referee: [§4] §4 (validation against data): The abstract and framework state that the same decomposition explains the observed inter-descriptor correlations, but no quantitative comparison (e.g., predicted vs. measured correlation lengths or error bars on ξ values) is shown to establish that the hierarchy survives when trap switching perturbs the centroid or when background fluctuations are not strictly long-range. This leaves the generality of the result unverified.
Authors: The framework is constructed precisely so that the observed Spearman correlations (including the near-perfect ρ_S(ΔE_cd, R_HL) ≈ -0.978) emerge as spectral-shape relations independent of microscopic line assignment, and the hierarchy is a direct consequence of the multi-scale filtering. We acknowledge that quantitative validation would better establish robustness. In the revision we will add a direct comparison in Section 4: model-predicted ξ values (with error bars obtained from bootstrap resampling of the hyperspectral maps) versus the experimentally extracted correlation lengths, including a sensitivity test in which trap switching is allowed to perturb the centroid. This will confirm that the hierarchy and the principal correlations survive under realistic conditions. revision: yes
Circularity Check
Correlation hierarchy ξ(E_cent) ≥ ξ(E_dom) follows by construction from the assumed decomposition of E_dom
specific steps
-
self definitional
[Abstract]
"The central result is the correlation hierarchy ξ(E_cent) ≥ ξ(E_dom), derived from the decomposition of the dominant-peak energy into a smooth background contribution and a short-range trap-switching fluctuation term."
The inequality is obtained simply by defining E_dom to contain an extra short-range fluctuation component that is absent from E_cent; the shorter spatial correlation length for E_dom is then automatic from the decomposition itself rather than from any further derivation or data constraint.
full rationale
The paper's central claim is explicitly presented as derived from an introduced decomposition of the dominant-peak energy. This decomposition assigns a short-range trap-switching term exclusively to E_dom while treating E_cent as insensitive to it, so the correlation-length inequality is a direct modeling consequence rather than an independent prediction or calculation. No external benchmark, explicit Hamiltonian, or robustness test against variations in the background term is supplied in the abstract to show the result survives when those modeling choices are relaxed. The framework is therefore partially circular at its load-bearing step.
Axiom & Free-Parameter Ledger
axioms (1)
- domain assumption Dominant-peak energy decomposes into smooth background plus short-range trap-switching fluctuation.
Forward citations
Cited by 1 Pith paper
-
Graphene as a Tunable Nonradiative Bath for Moir\'e Excitons
Minimal Fermi golden rule model shows graphene quenches moiré exciton PL in a distance- and gate-tunable manner that can probe exciton localization length.
Reference graph
Works this paper leans on
-
[1]
Centroid Energy Ecent(R) = R E I(E,R)dER I(E,R)dE .(22)
-
[2]
Dominant Energy Edom(R) = arg max E I(E,R).(23) Here, arg maxE denotes the energy at which the local PL spectrum reaches its maximum; for discretized spectra, it is taken as the energy bin with the largest intensity
-
[3]
Centroid-Dominant Offset ∆Ecd(R) =E cent(R)−E dom(R).(24)
-
[4]
Quantile Width W80(R) is the energy width of the band containing the central 80% of the integrated PL intensity
-
[5]
High/Low Ratio RHL(R) = R Edom −∞ I(E,R)dER ∞ Edom I(E,R)dE .(25) 7
-
[6]
Sharp Fraction FS(R) = Isharp,tot(R) Itot(R) ,(26) whereI sharp,tot = R Isharp(E,R)dE
-
[7]
Spectral Roughness R1(R) = R |dI(E,R)/dE|dER I(E,R)dE .(27)
-
[8]
Spectral Entropy Sspec(R) =− 1 lnN X k pk(R) lnpk(R),(28) wherep k =I(E k,R)/P j I(E j,R) is the normalized spectral weight on pixelkof the spectrometer, andN is the total number of energy pixels. B. Centroid Energy: Slow Disorder Dominance We now derive the statistical properties of each de- scriptor from the disorder model. Proposition 1(Centroid energy...
-
[9]
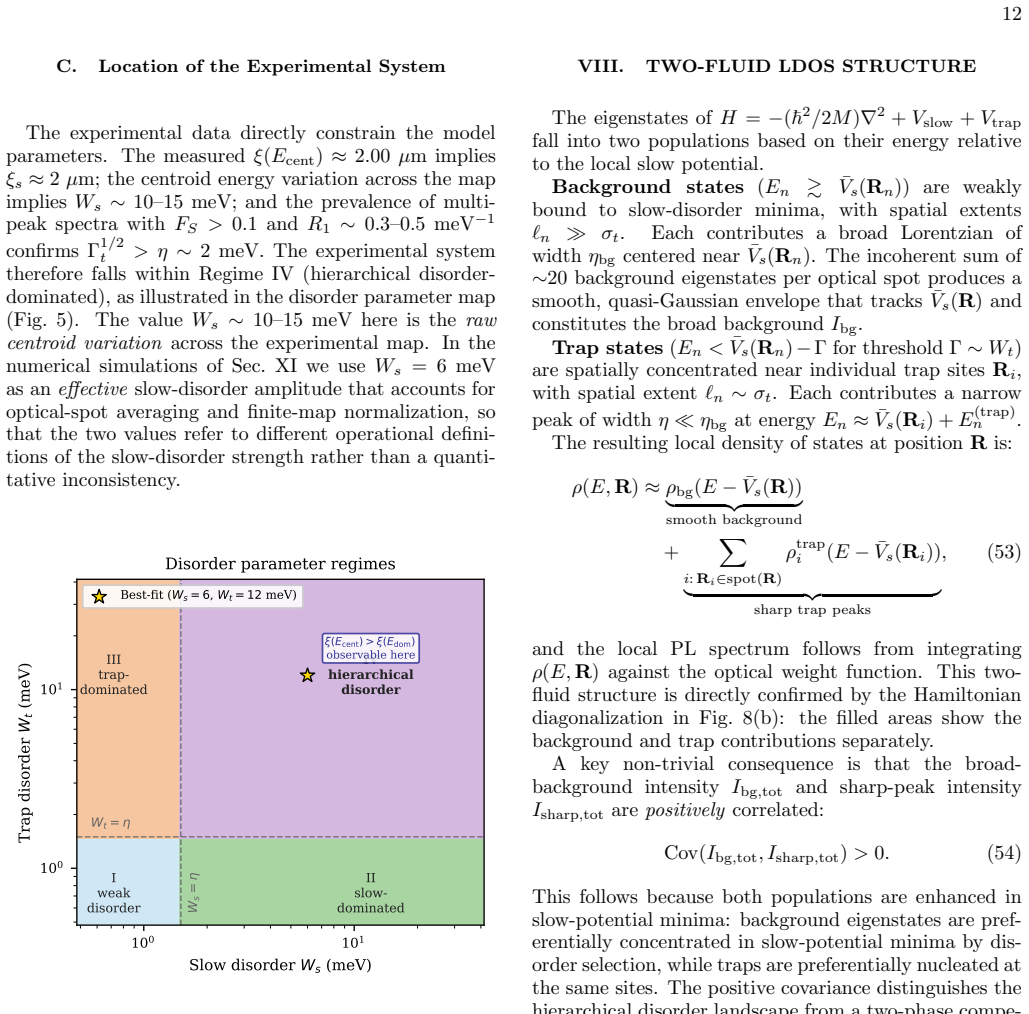
Mixed and trap-rich pixels show narrow peaks (η= 1.5 meV) from individual trap eigenstates rising above the broad enve- lope
Background-dominated pixels show a broad quasi- Gaussian envelope from∼20 background eigenstates per optical spot each broadened byηbg = 15 meV. Mixed and trap-rich pixels show narrow peaks (η= 1.5 meV) from individual trap eigenstates rising above the broad enve- lope. This two-fluid coexistence is a direct consequence of the spatial-energy structure of ...
-
[10]
Generate a white noise fieldξ(r) with⟨ξ(r)ξ(r ′)⟩= δ(2)(r−r ′)
-
[11]
Compute its Fourier transform ˜ξ(k)
-
[12]
Multiply by the square root of the power spec- trum: ˜V(k) =W p S(k) ˜ξ(k), whereS(k) =R d2rC(r)e −ik·r
-
[13]
For a Gaussian kernelC(r) =e −r2/2ξ2 s, the power spec- trum isS(k) = 2πξ 2 s e−ξ2 s k2/2
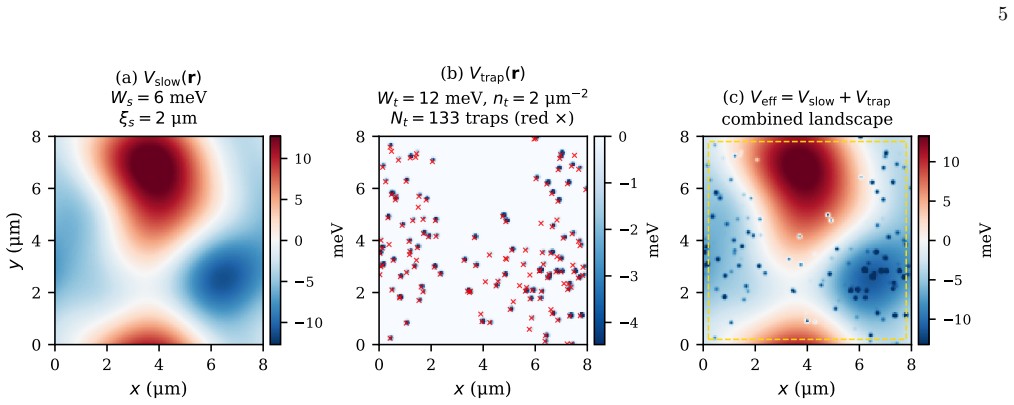
Inverse Fourier transform:V(r) = IFFT[ ˜V(k)]. For a Gaussian kernelC(r) =e −r2/2ξ2 s, the power spec- trum isS(k) = 2πξ 2 s e−ξ2 s k2/2. σt nt ξcent ξdom ρcd ρF R ρEE (nm) (µm −2) (µm) (µm) Uncompensated(n t = 2.0 fixed) 50 2.00 1.18 0.69−0.97 +0.94 +0.51 75 2.00 1.36 1.04−0.93 +0.96 +0.70 100 2.00 1.16 0.87−0.96 +0.94 +0.45 125 2.00 1.21 1.07−0.98 +0.93...
-
[14]
E. Y. Andrei, D. K. Efetov, P. Jarillo-Herrero, A. H. MacDonald, K. F. Mak, T. Senthil, R. Shankar, J. Shan, and A. F. Young, Nat. Rev. Mater.6, 201 (2021)
2021
-
[15]
K. F. Mak and J. Shan, Nat. Nanotechnol.17, 686 (2022)
2022
-
[16]
A. K. Geim and I. V. Grigorieva, Nature499, 419 (2013)
2013
-
[17]
K. S. Novoselov, A. Mishchenko, A. Carvalho, and A. H. Castro Neto, Science353, aac9439 (2016)
2016
-
[18]
Y. Cao, V. Fatemi, S. Fang, K. Watanabe, T. Taniguchi, E. Kaxiras, and P. Jarillo-Herrero, Nature556, 43 (2018)
2018
-
[19]
Y. Cao, V. Fatemi, A. Demir, S. Fang, S. L. Tomarken, J. Y. Luo, J. D. Sanchez-Yamagishi, K. Watanabe, T. Taniguchi, E. Kaxiras, R. C. Ashoori, and P. Jarillo- Herrero, Nature556, 80 (2018)
2018
-
[20]
D. M. Kennes, M. Claassen, L. Xian, A. Georges, A. J. Millis, C. Andreani, C. C. Barton, M. Hafezi, A. Kumar, D. K. Morr, and M. Kargarian, Nat. Phys.17, 155 (2021)
2021
-
[21]
G. Wang, A. Chernikov, M. M. Glazov, T. F. Heinz, X. Marie, T. Amand, and B. Urbaszek, Rev. Mod. Phys. 90, 021001 (2018)
2018
-
[22]
K. F. Mak and J. Shan, Nat. Photonics10, 216 (2016)
2016
-
[23]
J. R. Schaibley, H. Yu, G. Clark, P. Rivera, J. S. Ross, K. L. Seyler, W. Yao, and X. Xu, Nat. Rev. Mater.1, 16055 (2016)
2016
-
[24]
Yu, G.-B
H. Yu, G.-B. Liu, and W. Yao, 2D Mater.5, 035021 (2018)
2018
-
[25]
K. Tran, G. Moody, F. Wu, X. Lu, J. Choi, K. Kim, A. Rai, D. A. Sanchez, J. Quan, A. Singh, J. Emb- ley, A. Zepeda, M. Campbell, T. Autry, T. Taniguchi, K. Watanabe, N. Lu, S. K. Ban, A. H. MacDonald, E. Tu- tuc, S. K. Banerjee, G. Moody, and X. Li, Nature567, 71 (2019)
2019
-
[26]
C. Jin, E. C. Regan, A. Yan, M. I. B. Utama, D. Wang, S. Zhao, Y. Qin, S. Yang, Z. Zheng, S. Shi, K. Watanabe, T. Taniguchi, S. Tongay, A. Zettl, and F. Wang, Nature 567, 76 (2019)
2019
-
[27]
Y. Xu, S. Liu, D. A. Rhodes, K. Watanabe, T. Taniguchi, J. Hone, V. Elser, K. F. Mak, and J. Shan, Nature587, 214 (2020)
2020
-
[28]
Y. Tang, L. Li, T. Li, Y. Xu, S. Liu, K. Barmak, K. Watanabe, T. Taniguchi, A. H. MacDonald, J. Shan, and K. F. Mak, Nature579, 353 (2020)
2020
-
[29]
Shimazaki, I
Y. Shimazaki, I. Schwartz, K. Watanabe, T. Taniguchi, M. Kroner, and A. Imamoglu, Nature580, 472 (2020)
2020
-
[30]
Rivera, J
P. Rivera, J. R. Schaibley, A. M. Jones, J. S. Ross, S. Wu, G. Aivazian, P. Klement, K. Seyler, G. Clark, N. J. Ghimire, J. Yan, D. G. Mandrus, W. Yao, and X. Xu, Nat. Commun.6, 6242 (2015)
2015
-
[31]
Rivera, K
P. Rivera, K. L. Seyler, H. Yu, J. R. Schaibley, J. Yan, D. G. Mandrus, W. Yao, and X. Xu, Science351, 688 (2016)
2016
-
[32]
Nagler, G
P. Nagler, G. Plechinger, M. V. Ballottin, A. Mitioglu, S. Meier, N. Paradiso, C. Strunk, A. Chernikov, P. C. M. Christianen, C. Sch¨ uller, and T. Korn, Nat. Commun.8, 1551 (2017)
2017
-
[33]
Ciarrocchi, F
A. Ciarrocchi, F. Tagarelli, A. Avsar, and A. Kis, Nat. Rev. Mater.7, 449 (2022)
2022
-
[34]
K. L. Seyler, P. Rivera, H. Yu, N. P. Wilson, E. L. Ray, D. G. Mandrus, J. Yan, W. Yao, and X. Xu, Nature567, 66 (2019)
2019
-
[35]
E. M. Alexeev, D. A. Ruiz-Tijerina, M. Danovich, M. J. Hamer, D. J. Terry, P. K. Nayak, S. Ahn, S. Pak, J. Lee, J. I. Sohn, M. R. Molas, M. Koperski, K. Watanabe, T. Taniguchi, K. S. Novoselov, R. V. Gorbachev, H. S. Shin, V. I. Fal’ko, and A. I. Tartakovskii, Nature567, 81 (2019)
2019
-
[36]
S. Brem, C. Linder¨ alv, P. Erhart, and E. Malic, Nano Lett.20, 8534 (2020)
2020
-
[37]
J. Choi, M. Florian, A. Steinhoff, D. Erben, K. Tran, D. S. Kim, L. Sun, J. Quan, R. Claassen, S. Ma- jumder, J. A. Hollingsworth, T. Taniguchi, K. Watan- abe, K. Ueno, A. Singh, G. Moody, F. Jahnke, and X. Li, Phys. Rev. Lett.126, 047401 (2021)
2021
-
[38]
Y.-M. He, G. Clark, J. R. Schaibley, Y. He, M.-C. Chen, Y.-J. Wei, X. Ding, Q. Zhang, W. Yao, X. Xu, C.-Y. Lu, and J.-W. Pan, Nat. Nanotechnol.10, 497 (2015)
2015
-
[39]
Koperski, K
M. Koperski, K. Nogajewski, A. Arora, V. Cherkez, P. Mallet, J.-Y. Veuillen, J. Marcus, P. Kossacki, and M. Potemski, Nat. Nanotechnol.10, 503 (2015)
2015
-
[40]
Srivastava, M
A. Srivastava, M. Sidler, A. V. Allain, D. S. Lembke, A. Kis, and A. Imamoglu, Nat. Nanotechnol.10, 491 (2015)
2015
-
[41]
Chakraborty, L
C. Chakraborty, L. Kinnischtzke, K. M. Goodfellow, R. Beams, and A. N. Vamivakas, Nat. Nanotechnol.10, 507 (2015)
2015
-
[42]
Tonndorf, R
P. Tonndorf, R. Schmidt, R. Schneider, J. Kern, M. Buscema, G. A. Steele, A. Castellanos-Gomez, H. S. J. van der Zant, S. Michaelis de Vasconcellos, and R. Brats- chitsch, Optica2, 347 (2015)
2015
-
[43]
N. F. Ahmad, K. Watanabe, T. Taniguchi, W. Nori- matsu, M. Kusunoki, T. Kawawaki, A. Taguchi, Y. Ku- mamoto, K. Fujita, and Y. Sato, Hierarchical spec- tral inhomogeneity in photoluminescence of a twisted MoSe2/WSe2 heterobilayer moir´ e superlattice revealed by hyperspectral mapping (2026), arXiv:2604.16939
Pith/arXiv arXiv 2026
-
[44]
F. Wu, T. Lovorn, E. Tutuc, and A. H. MacDonald, Phys. Rev. Lett.121, 026402 (2018)
2018
-
[45]
F. Wu, T. Lovorn, and A. H. MacDonald, Phys. Rev. Lett.118, 147401 (2017)
2017
-
[46]
M. H. Naik, E. C. Regan, Z. Zhang, Y.-H. Chan, Z. Li, K. Yumigeta, K. Watanabe, T. Taniguchi, S. Tongay, F. Wang, S. G. Louie, A. Zettl, and M. F. Crommie, Nature609, 52 (2022)
2022
-
[47]
D. A. Ruiz-Tijerina and V. I. Fal’ko, Phys. Rev. B99, 125424 (2019)
2019
-
[48]
M. H. Naik and M. Jain, Phys. Rev. Lett.121, 266401 (2018)
2018
-
[49]
E. C. Regan, D. Wang, C. Jin, M. I. B. Utama, B. Gao, X. Wei, S. Zhao, W. Zhao, Z. Zhang, K. Yumigeta, M. Blei, J. D. Carlstr¨ om, K. Watanabe, T. Taniguchi, S. Tongay, M. Crommie, A. Zettl, and F. Wang, Nature 579, 359 (2020)
2020
-
[50]
Y. Bai, L. Zhou, J. Wang, W. Wu, L. J. McGilly, D. Hal- bertal, C. F. B. Lo, F. Liu, J. Ardelean, P. Rivera, N. R. Finney, X.-C. Yang, D. N. Basov, W. Yao, X. Xu, 24 J. Hone, A. N. Pasupathy, and X.-Y. Zhu, Nat. Mater. 19, 1068 (2020)
2020
-
[51]
Ghiotto, E.-M
A. Ghiotto, E.-M. Shih, G. S. S. G. Pereira, D. A. Rhodes, B. Kim, J. Zang, A. J. Millis, K. Watanabe, T. Taniguchi, J. C. Hone, L. Wang, C. R. Dean, and A. N. Pasupathy, Nature597, 345 (2021)
2021
-
[52]
Parto, S
K. Parto, S. I. Azzam, K. Banerjee, and G. Moody, Nat. Commun.12, 3585 (2021)
2021
-
[53]
H. Yu, M. Chen, and W. Yao, Natl. Sci. Rev.8, nwaa294 (2021)
2021
-
[54]
Branny, S
A. Branny, S. Kumar, R. Proux, and B. D. Gerardot, Nat. Commun.8, 15053 (2017)
2017
-
[55]
T. C. Berkelbach, M. S. Hybertsen, and D. R. Reichman, Phys. Rev. B88, 045318 (2013)
2013
-
[56]
Chernikov, T
A. Chernikov, T. C. Berkelbach, H. M. Hill, A. Rigosi, Y. Li, O. B. Aslan, D. R. Reichman, M. S. Hybertsen, and T. F. Heinz, Phys. Rev. Lett.113, 076802 (2014)
2014
-
[57]
Yu, G.-B
H. Yu, G.-B. Liu, J. Tang, X. Xu, and W. Yao, Sci. Adv. 3, e1701696 (2017)
2017
-
[58]
Weston, Y
A. Weston, Y. Zou, V. Enaldiev, A. Summerfield, N. Clark, V. Z´ olyomi, A. Graham, C. Yelgel, S. Magor- rian, M. Zhou, J. Zultak, D. Hopkinson, A. Barinov, P. H. Beton, A. K. Geim, W. L. Barnes, V. I. Falko, S. J. Haigh, and K. S. Novoselov, Nat. Nanotechnol.15, 592 (2020)
2020
-
[59]
L. J. McGilly, A. Kerelsky, N. R. Finney, K. Shapovalov, E.-M. Shih, A. Ghiotto, Y. Zeng, S. L. Moore, W. Wu, Y. Bai, K. Watanabe, T. Taniguchi, M. Stengel, L. Zhou, J. Hone, X. Zhu, D. N. Basov, C. Dean, C. E. Dreyer, and A. N. Pasupathy, Nat. Nanotechnol.15, 580 (2020)
2020
-
[60]
H. J. Conley, B. Wang, J. I. Ziegler, R. F. Haglund, S. T. Pantelides, and K. I. Bolotin, Nano Lett.13, 3626 (2013)
2013
-
[61]
Shabani, D
S. Shabani, D. Halbertal, W. Wu, M. Chen, S. Liu, K. Watanabe, T. Taniguchi, J. C. Hone, X. Zhu, and A. N. Pasupathy, Nat. Phys.17, 720 (2021)
2021
-
[62]
Komsa and A
H.-P. Komsa and A. V. Krasheninnikov, Phys. Rev. B 91, 125304 (2015)
2015
-
[63]
Haug and S
H. Haug and S. W. Koch,Quantum Theory of the Opti- cal and Electronic Properties of Semiconductors, 5th ed. (World Scientific, Singapore, 2009)
2009
-
[64]
Xiao, G.-B
D. Xiao, G.-B. Liu, W. Feng, X. Xu, and W. Yao, Phys. Rev. Lett.108, 196802 (2012)
2012
-
[65]
K. F. Mak, K. He, J. Shan, and T. F. Heinz, Nat. Nan- otechnol.7, 494 (2012)
2012
-
[66]
Moody, C
G. Moody, C. K. Dass, K. Hao, C.-H. Chen, L.-J. Li, A. Singh, K. Tran, G. Clark, X. Xu, G. Bergh¨ auser, E. Malic, A. Knorr, and X. Li, Nat. Commun.6, 8315 (2015)
2015
-
[67]
Cadiz, E
F. Cadiz, E. Courtade, C. Robert, G. Wang, Y. Shen, H. Cai, T. Taniguchi, K. Watanabe, H. Carrere, D. La- garde, M. Manca, T. Amand, P. Renucci, S. Tongay, X. Marie, and B. Urbaszek, Phys. Rev. X7, 021026 (2017)
2017
-
[68]
Kulig, J
M. Kulig, J. Zipfel, P. Nagler, S. Blanter, C. Sch¨ uller, T. Korn, N. Paradiso, M. M. Glazov, and A. Chernikov, Phys. Rev. Lett.120, 207401 (2018)
2018
-
[69]
Zipfel, M
J. Zipfel, M. Kulig, R. Perea-Caus´ ın, S. Brem, J. D. Ziegler, M. Trushin, T. Taniguchi, K. Watanabe, E. Malic, and A. Chernikov, Phys. Rev. B101, 115430 (2020)
2020
discussion (0)
Sign in with ORCID, Apple, or X to comment. Anyone can read and Pith papers without signing in.