REVIEW 3 major objections 3 minor 28 references
Archetypes or ability? Clustering for modelling student mathematical competence
T0 review · 3 major / 3 minor · reviewed 2026-08-02 · deepseek-v4-flash
Pith's one-line read A study of 119,034 UK maths mock exams finds that a single overall-ability score predicts question success almost as well as question-specific models, challenging the archetype assumption behind personalised learning.
desk verdict Solid large-scale replication of 'ability dominates' with a useful cluster-correlation diagnostic; the unexamined pass/fail threshold is the main gap and should be addressed, not a reason to reject. read the letter →
The pith
A machine-rendered reading of the paper's core claim, the machinery that carries it, and where it could break.
The reading
What carries the argument
The Bernoulli Mixture Model (BMM): a latent-class model that assigns each student a probability of belonging to each cluster, with each cluster defined by per-question pass probabilities. Fitted with expectation-maximisation and selected by BIC across 17 candidate cluster counts (2 to 64), it both predicts pass/fail and yields interpretable 'archetype' profiles. The paper then uses Pearson correlations between cluster profiles, and between each profile and the average grade, to quantify how much of the cluster shape is just a scaling of overall ability. The k-nearest-neighbour and logistic regression baselines provide the predictive comparison.
What would settle it
Recompute the BMM cluster correlations and the accuracy gap between the multi-question and single-ability logistic regression using alternative binarisation thresholds (e.g., 30% or 70% of marks) or using partial-credit scores. If at any reasonable threshold the optimal cluster count rises well above 12, or the cluster-profile correlations fall below 0.6, the 'ability dominates' conclusion is an artefact of the encoding. Alternatively, if a per-skill IRT model significantly outperforms the single-ability logistic regression (beyond the reported ~1% gap) on the same data, the small-personalisat
Extended reading notes
Core claim
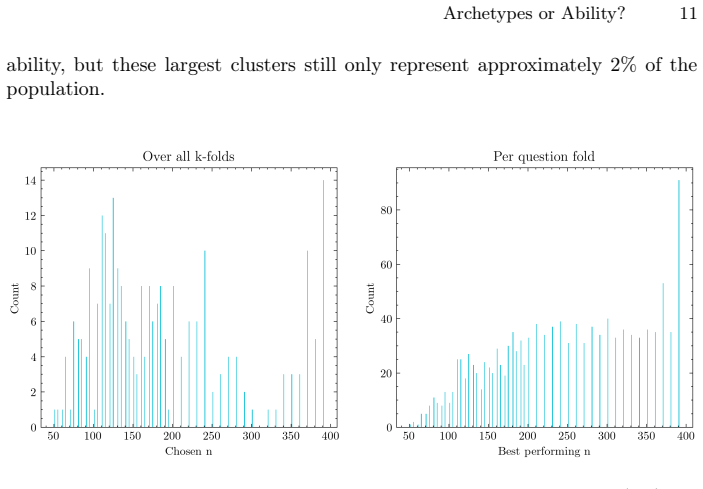
Using a Bernoulli Mixture Model selected by Bayesian Information Criterion on 119,034 students and 13 UK mock GCSE exams (question results binarised as pass/fail), the paper shows that the optimal number of latent clusters concentrates around 10-12 and that pairwise linear (Pearson) correlations between cluster probability profiles are mostly above 0.6, with most clusters correlating strongly with the overall average grade. This means the archetypes the model recovers are effectively different amplitude rescalings of a common ability profile. Predictive performance confirms this: a single-ability logistic regression achieves 76.9% accuracy, while a multi-question logistic regression achieves
Load-bearing premise
The pass/fail threshold — over half marks on a question counts as a pass — is assumed to preserve the latent structure of mathematical competence; all clustering and correlation results depend on this binary encoding, and the paper does not test whether other thresholds change the conclusion.
Editorial extensions
If this is right
- Personalised learning systems that tailor questions by topic can expect at most a small accuracy gain over ranking students by overall ability — around one percentage point in this dataset.
- The near-linear rescaling result gives curriculum designers a simple diagnostic: look for low-correlation clusters to identify genuine, non-ability-based differences in student competency profiles.
- Explainable models such as logistic regression and BMM match the accuracy of more complex baselines, supporting their use where accountability matters, such as predicted grades.
- Model performance is worst for mid-ability students, so platforms deploying these models should counterbalance the tendency to give middle-band students lower-quality recommendations.
- The BMM with cluster-count and correlation distributions provides a reference benchmark for future work on national-scale educational data.
Reading between the lines
- If the linear-rescaling finding generalises beyond these 13 exams, the 'prerequisite ladder' model of mathematics curricula — where skills must be mastered sequentially — may be descriptively weaker than commonly assumed; question difficulty rather than skill modularity could drive most of the variance.
- A testable extension: repeat the analysis on partial-credit scores or error-diagnosis data to see whether the small personalisation signal grows. If it does, the binary threshold may be hiding real skill structure.
- The rare low-correlation clusters, such as the 'unusual profile' shown in one exam, may correspond to students taught in a different topic order or with discontinuous study histories; linking cluster membership to school-level metadata could identify teaching-practice effects.
- Because the paper finds only a small gain from question-level features, an economic inference is that investment in modelling per-topic mastery may be less impactful than improving the quality of the overall ability estimate itself, for example through adaptive testing.
Editorial analysis
A structured set of objections, weighed in public.
Referee Report
Summary. The paper analyses a large proprietary dataset of 119,034 UK students' question-level scores on 13 GCSE mock exams. Each question is binarized into pass/fail (Section 3.2: 'over half marks on a question counts as a pass'), and the authors fit a Bernoulli Mixture Model (BMM) to search for latent student 'archetypes'. They compare BMM and k-nearest neighbours against two logistic regression baselines: a single-ability model using only average grade (LogRegs) and a multi-question model using all other question scores as features (LogRegm). The central claims are that (i) few distinct clusters are present, (ii) overall ability is the dominant factor in predicting question success, and (iii) cluster probability profiles are largely linear rescalings of average grade. Support comes from BIC-based cluster selection (Section 5.4), Pearson correlations between cluster profiles (Figure 8), and the small accuracy difference between LogRegm and LogRegs (Table 1). The best model reaches 78% accuracy, and all models are well calibrated.
Significance. If the conclusions hold, the paper provides a large-scale, explainable benchmark for educational machine learning that challenges the common assumption of discrete, modular skill profiles. The paper is methodologically careful in using 8-fold cross-validation, held-out test sets, per-question evaluation, and BIC for model selection. The comparison of a single-ability baseline against multi-question models is a useful and reproducible design. However, the absence of a sensitivity analysis for the binary threshold weakens the generalisability of the central conclusion. The reported cluster counts (10-12 for most questions) also sit uncomfortably with the abstract's 'few distinct clusters' phrasing. With threshold robustness demonstrated, the paper would be a solid contribution; without it, the headline conclusion remains conditional.
major comments (3)
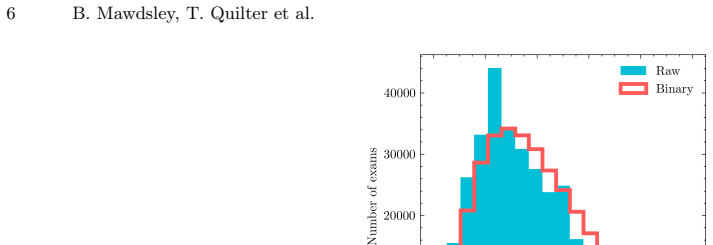
- [Section 3.2, Figure 1; used throughout Sections 5.2 and 5.4] The pass/fail threshold ('over half marks') is arbitrary and never varied, yet all evidence for the central claim — the small LogRegm−LogRegs gap (Table 1), the BMM cluster correlation analysis (Figure 8), and the BIC cluster counts (Figure 6) — is computed on this binary encoding. At very low or very high thresholds, the binary variables approach constants, which would restrict correlations and change cluster shapes; at an intermediate threshold, correlations can be artificially inflated, making clusters look like rescalings of average grade. Since the raw mark distribution is available (Figure 1), the authors should re-run the key analyses with at least one or two alternative thresholds (e.g., passing only on 30%, 40%, 60%, 70%) and report whether the LogRegm−LogRegs difference and the cluster correlation distributions are stable. Without this, the 'overall ability dominates' conclusio
- [Abstract and Section 5.4, Figures 6 and 7] The abstract claims 'few distinct clusters are present', but Figure 6 shows that BIC selects 10–12 clusters for most questions, and Figure 7 shows a minimum BIC in the 10–14 range. Ten to twelve clusters for a 20-question exam is not obviously 'few', especially the abstract contrasts this with 'discrete abilities' and 'foundational abilities'. The authors should either temper the 'few' claim or define a criterion (e.g., relative to the maximum of 64 explored, or relative to a single-cluster baseline) that quantifies what 'few' means. As written, the claim overstates the sparsity of the learned cluster structure.
- [Section 5.4, Figure 8] The claim that clusters are 'a linear rescaling of average grade' is based on Pearson correlations, but no null model or baseline is provided. Under a unidimensional latent-ability model (e.g., a Rasch/IRT model) with a fixed threshold, cluster profiles estimated by a BMM would be expected to be highly linearly correlated simply because all items load on the same latent factor. The observed high correlations may therefore be a mathematical consequence of the model and threshold, not an empirical discovery. A simulation study generating data from a single-factor model and applying the same BMM pipeline would provide a reference distribution for the correlation coefficients and make Figure 8 informative. This is relevant because the cluster-correlation evidence is presented as independent support for the dominance of overall ability.
minor comments (3)
- [Section 3.1] The 7.5% row-removal procedure is described in two places: scores above full marks are dropped, and then it is stated that rows where a teacher has entered the same score for several questions are dropped 'to completely remove this potential source of contamination'. The wording is confusing; clarify whether these are the same rows or whether two separate filters are applied.
- [Section 5.3, Figure 4] The calibration analysis uses bin_confint but does not state the number of bins used. Specifying the binning procedure would improve reproducibility.
- [General] The abstract and text use 'few distinct clusters' while Table 1 and Figure 6 report BIC-selected cluster counts around 10–12. Consider adding a one-sentence explanation in the Introduction or Section 5.4 that defines 'few' in the context of the 20-question exams.
Circularity Check
No significant circularity: the central claims are held-out test-set empirical findings, and the only self-citation is corroborative, not load-bearing.
full rationale
This is an empirical data-analysis paper rather than a derivation, and I found no step where a prediction is equivalent to an input by construction. The BMM, kNN, and logistic-regression models are trained on a 90% split and evaluated on a held-out 10% test set (Section 5.1), so the accuracy comparisons in Table 1 are genuine predictions. The conclusion that overall ability dominates is supported by the small LogRegm minus LogRegs gap (0.778 vs 0.769) and by the cluster-shape correlations in Figure 8; these correlations are computed from the fitted cluster profiles and the data, but the BMM objective does not force cluster profiles to be linearly correlated with the average score. Indeed, the paper reports low-correlation exceptions (Figure 14), so the high typical correlation is an empirical result, not a tautology. The only self-citation, [20], is used as corroboration ('supporting the conclusion from [20]', Section 5.2) and the paper independently reproduces the finding on a new dataset; it is not load-bearing. The pass/fail threshold introduced in Section 3.2 is a modeling choice whose sensitivity is not tested, but that is a robustness limitation, not a circular reduction. No equation-level or definition-level circularity is present.
Assumptions & free parameters
free parameters (4)
- Pass/fail threshold =
>50% marks on a question
- BMM cluster count k =
Typically 10-12, selected by BIC
- kNN neighbourhood size k =
Varies around 120, range 3-400
- Logistic regression coefficients beta =
Fitted to training data
assumptions (5)
- domain assumption Mock exam question-level pass/fail is a valid representation of mathematical competence
- standard math EM algorithm converges to a meaningful optimum for Bernoulli mixtures
- domain assumption BIC is an appropriate criterion for selecting the number of clusters
- domain assumption Dropped rows (negative scores and scores above full marks, 7.5%) are missing at random with respect to student competence
- domain assumption Students sitting different exams are comparable within an exam
Cite this review
Pith. "Pith review of Archetypes or ability? Clustering for modelling student mathematical competence." pith.science (2026). https://pith.science/paper/D7N5PIRX
@misc{pith2026260726063,
  author       = {Pith},
  title        = {Pith review of: Archetypes or ability? Clustering for modelling student mathematical competence},
  year         = {2026},
  howpublished = {\url{https://pith.science/paper/D7N5PIRX}},
  note         = {Machine review of arXiv:2607.26063}
}
read the original abstract
Personalised learning systems often assume that mathematical ability is combined of discrete abilities, acquired sequentially and dependent upon first acquiring foundational abilities, and students often report different strengths. In this work, we explore the validity of these assumptions by applying clustering methods to a large dataset of 119,034 students, spanning 13 national-level exams sat in the United Kingdom and collected by the platform. Classifying question results as pass or fail, we use a Bernoulli Mixture Model to search for latent populations which would be indicative of discrete skill-sets. We find that few distinct clusters are present in the data and that the dominant factor is overall student ability, which is further supported by the high degree of linear correlation between the probability distributions of the resulting clusters. Our best performing model achieves an accuracy of 78 percent, competitive with more complicated models in the literature whilst being more explainable. Comparing this models performance with logistic regression baselines and with k-nearest neighbours, we find a small improvement when using performance on each individual question as features. This suggests that whilst overall ability level is the dominant factor for predicting performance, small further personalisation improvements can be made by tailoring to a students exact strengths, but that students do not appear to develop strongly differing ability across topics. Our work offers a national scale test of machine learning in education and offers a new benchmark for the field, demonstrating how explainable models can reach competitive performance
Figures


Figures from the paper (11 more)



Reference graph
Works this paper leans on
-
[20]
arXiv preprint arXiv:2509.23484 (2025)
Quilter, T., Ilick, A., Poon, K., Turner, R.: Accurate predictions in edu- cation with discrete variational inference. arXiv preprint arXiv:2509.23484 (2025)
arXiv 2025
-
[1]
Aldowah, H., Al-Samarraie, H., Fauzy, W.M.: Educational data mining and learning analytics for 21st century higher education: A review and synthesis. Telematics and Informatics37, 13–49 (2019).https://doi.org/https:// doi.org/10.1016/j.tele.2019.01.007,https://www.sciencedirect. com/science/article/pii/S0736585318304234
-
[2]
Neural Computation12(1), 141–152 (2000)
Carreira-Perpinán, M.A., Renals, S.: Practical identifiability of finite mix- tures of multivariate bernoulli distributions. Neural Computation12(1), 141–152 (2000)
2000
-
[3]
Journal of Computing in Higher Education33, 614–634 (2021)
Chango, W., Cerezo, R., Sanchez-Santillan, M., Azevedo, R., Romero, C.: Improving prediction of students’ performance in intelligent tutoring sys- tems using attribute selection and ensembles of different multimodal data sources. Journal of Computing in Higher Education33, 614–634 (2021)
2021
-
[4]
In: International Conference on Computer Science and Education
Chen, L., Li, T., Chen, Y., Zhao, L., Peng, L., Zhang, S., Liang, W.: Re- search on improving higher education exam quality based on weighted k- medoids clustering. In: International Conference on Computer Science and Education. pp. 194–209. Springer (2023)
2023
-
[5]
In: 2017 IEEE 23rd international symposium for design and technology in electronic packaging (SIITME)
Ciolacu, M., Tehrani, A.F., Beer, R., Popp, H.: Education 4.0—fostering student’s performance with machine learning methods. In: 2017 IEEE 23rd international symposium for design and technology in electronic packaging (SIITME). pp. 438–443. IEEE (2017)
2017
-
[6]
Department for Education: Statistics: performance ta- bles (2023),https://www.gov.uk/government/collections/ statistics-performance-tables
2023
-
[7]
5281/zenodo.4106649,http://doi.org/10.5281/zenodo.4106649
Garrett, J.D.: garrettj403/SciencePlots (Sep 2021).https://doi.org/10. 5281/zenodo.4106649,http://doi.org/10.5281/zenodo.4106649
Show all 28 references
-
[8]
In: Zhou, Z.H
Ghosh, A., Lan, A.: Bobcat: Bilevel optimization-based computerized adap- tive testing. In: Zhou, Z.H. (ed.) Proceedings of the Thirtieth Interna- tional Joint Conference on Artificial Intelligence, IJCAI-21. pp. 2410–2417. International Joint Conferences on Artificial Intelli...
2021 doi
-
[9]
arXiv preprint arXiv:2208.12610 (2022)
Gong, W., Smith, D., Wang, Z., Barton, C., Woodhead, S., Pawlowski, N., Jennings, J., Zhang, C.: Instructions and guide: Causal insights for learning paths in education. arXiv preprint arXiv:2208.12610 (2022)
2022 arXiv
-
[10]
In: To ap- pear: Proceedings of AIED (Memphis, USA, July 9 - July 13, 2013) (2013)
Käser, T., Busetto, A.G., Solenthaler, B., Kohn, J., von Aster, M., Gross, M.: Cluster-based prediction of mathematical learning patterns. In: To ap- pear: Proceedings of AIED (Memphis, USA, July 9 - July 13, 2013) (2013)
2013
-
[11]
British Educational Research Journal47(3), 725–741 (2021).https://doi.org/https:// doi.org/10.1002/berj.3705,https://bera-journals.onlinelibrary
Kelly, A.: A tale of two algorithms: The appeal and repeal of calcu- lated grades systems in england and ireland in 2020. British Educational Research Journal47(3), 725–741 (2021).https://doi.org/https:// doi.org/10.1002/berj.3705,https://bera-journals.onlinelibrary. wiley.com...
2020 doi
-
[12]
Br Polit18(2022).https://doi.org/ {https://doi.org/10.1057/s41293-021-00162-y}
Kippin,S.,Cairney,P.:Thecovid-19examsfiascoacrosstheuk:fournations and two windows of opportunity. Br Polit18(2022).https://doi.org/ {https://doi.org/10.1057/s41293-021-00162-y}
2022 doi
-
[13]
arXiv preprint arXiv:2305.16165 (2023)
Kumar, N.A., Feng, W., Lee, J., McNichols, H., Ghosh, A., Lan, A.: A con- ceptual model for end-to-end causal discovery in knowledge tracing. arXiv preprint arXiv:2305.16165 (2023)
2023 arXiv
-
[14]
Computational Intelligence and Neuroscience2022(1), 3762431 (2022)
Liu, R.: Data analysis of educational evaluation using k-means clustering method. Computational Intelligence and Neuroscience2022(1), 3762431 (2022)
2022
-
[15]
Applied Sciences13(5), 3267 (2023)
Mohd Talib, N.I., Abd Majid, N.A., Sahran, S.: Identification of student be- havioral patterns in higher education using k-means clustering and support vector machine. Applied Sciences13(5), 3267 (2023)
2023
-
[16]
Technological forecasting and social change 194, 122664 (2023)
Mukul, E., Büyüközkan, G.: Digital transformation in education: A system- atic review of education 4.0. Technological forecasting and social change 194, 122664 (2023)
2023
-
[17]
Education Economics28(4), 333–350 (2020).https://doi.org/10.1080/09645292
Murphy, R., Wyness, G.: Minority report: the impact of predicted grades on university admissions of disadvantaged groups. Education Economics28(4), 333–350 (2020).https://doi.org/10.1080/09645292. 2020.1761945,https://doi.org/10.1080/09645292.2020.1761945
2020
-
[18]
Ofsted: Education inspection framework for Septem- ber 2023 (2023),https://www.gov.uk/government/ publications/education-inspection-framework/ education-inspection-framework-for-september-2023
2023
-
[19]
Journal of Machine Learning Research 12, 2825–2830 (2011)
Pedregosa, F., Varoquaux, G., Gramfort, A., Michel, V., Thirion, B., Grisel, O., Blondel, M., Prettenhofer, P., Weiss, R., Dubourg, V., Vanderplas, J., Passos, A., Cournapeau, D., Brucher, M., Perrot, M., Duchesnay, E.: Scikit- learn: Machine learning in Python. Journal of Mac...
2011
-
[21]
Applied sciences10(3), 1042 (2020)
Rastrollo-Guerrero, J.L., Gómez-Pulido, J.A., Durán-Domínguez, A.: Ana- lyzing and predicting students’ performance by means of machine learning: A review. Applied sciences10(3), 1042 (2020)
2020
-
[22]
In: JMLR workshop and conference proceedings
Saarela, M., Yener, B., Zaki, M.J., Kärkkäinen, T.: Predicting math per- formance from raw large-scale educational assessments data: a machine learning approach. In: JMLR workshop and conference proceedings. vol. 48, pp. 1–8. JMLR (2016)
2016
-
[23]
Large-scale assessments in education8(1), 1–20 (2020)
Salles, F., Dos Santos, R., Keskpaik, S.: When didactics meet data sci- ence: Process data analysis in large-scale mathematics assessment in france. Large-scale assessments in education8(1), 1–20 (2020)
2020
-
[24]
Jour- nal of Cognition and Development22(5), 695–720 (2021).https:// 18 B
Scofield, J.E., Hoard, M.K., Nugent, L., V, J.L., Geary, D.C.: Mathe- matics clusters reveal strengths and weaknesses in adolescents’ mathe- matical competencies, spatial abilities, and mathematics attitudes. Jour- nal of Cognition and Development22(5), 695–720 (2021).https://...
2021
-
[25]
NeurIPS Education Challenge 2020 (2020),https://eedi.com/projects/neurips-education-challenge
Takehara, D., Shinahara, Y.: Practical strategies for improving the perfor- mance of student response prediction. NeurIPS Education Challenge 2020 (2020),https://eedi.com/projects/neurips-education-challenge
2020
-
[26]
Usiskin, Z.: Van hiele levels and achievement in secondary school geometry (1982)
1982
-
[27]
arXiv preprint arXiv:2007.12061 (2020)
Wang, Z., Lamb, A., Saveliev, E., Cameron, P., Zaykov, Y., Hernández- Lobato, J.M., Turner, R.E., Baraniuk, R.G., Barton, C., Jones, S.P., Wood- head, S., Zhang, C.: Diagnostic questions: The neurips 2020 education chal- lenge. arXiv preprint arXiv:2007.12061 (2020)
2020 arXiv
-
[28]
Journal of Learning Disabilities53(1), 19– 35 (2020).https://doi.org/10.1177/0022219419881632,https://doi
Woods, A.D., Ahmed, S.F., Katz, B.D., Morrison, F.J.: How sta- ble is early academic performance? using cluster analysis to classify low achievement and ef. Journal of Learning Disabilities53(1), 19– 35 (2020).https://doi.org/10.1177/0022219419881632,https://doi. org/10.1177/0...
2020 doi
Reviewed August 2, 2026 · model on record in the stance chip above.
Discussion (0). Sign in to comment.