REVIEW 5 major objections 5 minor 20 references
Tracking Behavioral Patterns among Students in an Online Educational System
T0 review · 5 major / 5 minor · reviewed 2026-08-14 · deepseek-v4-flash
Pith's one-line read Weighted non-negative matrix factorization of weekly student-activity logs separates Danish primary-school students into five behavioral clusters, three tied to higher quiz performance and two tied to lower performance; the same…
desk verdict Descriptive NMF cluster map of a large Danish primary-school dataset is worth a look, but the performance labels are not backed by stability or validation. read the letter →
The pith
A machine-rendered reading of the paper's core claim, the machinery that carries it, and where it could break.
The reading
What carries the argument
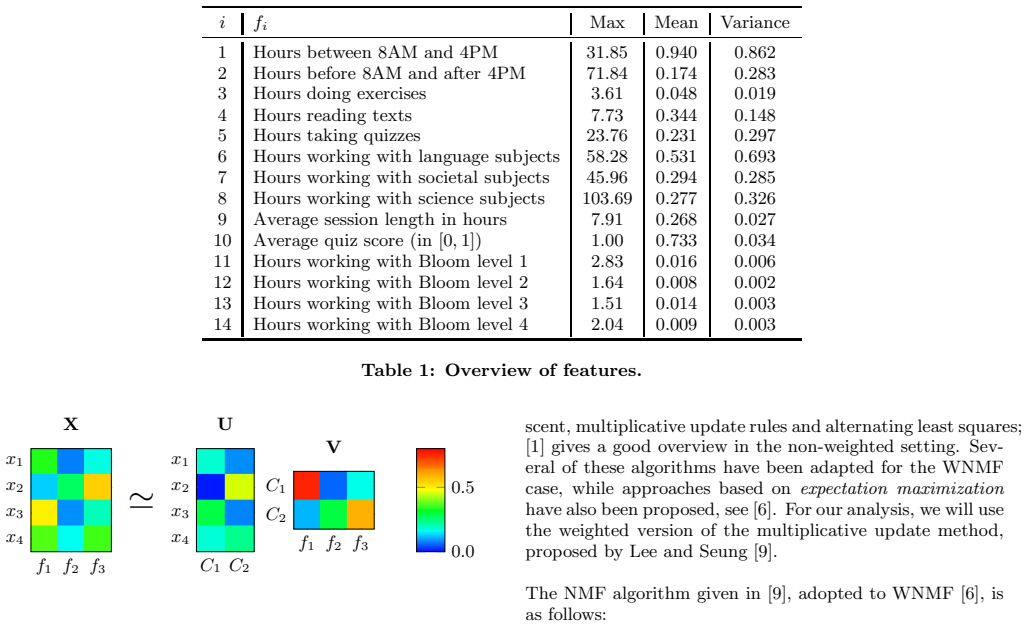
Non-negative matrix factorization (NMF): a factorization X ≈ UV of the non-negative student-period-by-feature matrix into a membership matrix U and a cluster matrix V, computed with multiplicative update rules adapted to missing values by weighting. The rows of V are rescaled to sum to one so clusters are comparable; a threshold on the decrease in reconstruction error selects the number of clusters k. This machinery does the work of turning millions of session logs into a small set of readable behavioral prototypes, and it lets the authors attach each student in each week a membership vector over the prototypes.
What would settle it
Run the same weighted NMF many times with different random initializations on the same data and compare the cluster matrices V: if the feature loadings change materially across runs, the 'optimal' and 'sub-optimal' labels are artifacts of initialization, not stable properties of student behavior.
Extended reading notes
Core claim
The central discovery is that a low-rank non-negative factorization of a student-by-feature matrix, built from weekly aggregates of session logs, separates student behavior into interpretable clusters whose feature loadings align with performance. In the first experiment, five clusters emerge: science readers, language quiz-takers, societal readers, school-time language workers, and at-home quiz-takers; the first three carry high average quiz scores and long session lengths, while the last two do not. In the second experiment, three clusters separate Bloom's-taxonomy levels by subject: language work concentrates on remember/understand, societal work on analyze/evaluate, and science work uses almost no higher-level exercises. The authors conclude that the dependencies revealed by the factorization identify optimal and sub-optimal behaviors with respect to subject and performance, and that the same decomposition can be used to follow how memberships shift week by week.
Load-bearing premise
The load-bearing premise is that the single factorization produced by one randomly initialized run, with its chosen number of clusters, is stable and meaningful enough that the feature loadings can be read as real behavioral dependencies.
Editorial extensions
If this is right
- For language subjects, recommending quizzes and keeping work within school hours should, if the dependencies are causal, raise average quiz scores more than assigning reading.
- For societal and science subjects, reading texts during school hours is the behavior most associated with high performance, so content and assignments should emphasize sustained reading.
- Working mostly outside school hours and taking quizzes there is associated with no performance boost, so schools might investigate why home sessions do not translate into quiz scores.
- System-wide tracking shows average time spent in the platform rising from about 15 to 25–45 minutes per week per subject, so the cluster structure can serve as a monitoring tool for adoption trends.
- Because clusters are uncorrelated at student level while correlated at system level, aggregate dashboards can mask individual behavioral trade-offs; school-level interpretations should rely on membership distributions rather than averages.
Reading between the lines
- The same pipeline could be run on other platforms' logs: the feature set is generic enough that the optimal/sub-optimal labels are testable hypotheses elsewhere, provided the factorization's k is validated per dataset.
- The paper never analyzes individual students' transitions due to privacy, but its own method implies a natural next test: whether students who move from the at-home cluster to the school-hours clusters subsequently improve quiz scores within a few weeks.
- The observed association between long sessions and high performance may reflect that high performers choose to stay longer, not that longer sessions cause performance; an intervention study or instrumental-variable design is needed before recommending longer sessions.
Signed reviews
Editorial analysis
A structured set of objections, weighed in public.
Referee Report
Summary. The paper analyzes log data from Clio Online, a Danish online educational platform, using weighted non-negative matrix factorization (WNMF) to obtain soft clusterings of student-week feature vectors. Data from 14,810 students and roughly 3 million sessions over 112 weekly periods are aggregated into 14 features covering time of day, activity type, subject, Bloom's taxonomy level, session length, and quiz performance. The first experiment clusters students on features f1-f10 and interprets five clusters as optimal or sub-optimal behaviors, concluding, for example, that language students benefit most from quizzes during school hours while home use yields no performance gain. The second experiment clusters on subject and Bloom-level features and reports how exercise complexity varies across subject areas. The paper also plots average cluster membership over time to describe system-wide behavioral trends.
Significance. If the behavioral-performance dependencies reported here are reliable, they have practical value for educational intervention design, such as recommending quizzes for language students or encouraging in-school system use. The data set is large and from a real deployed system, and the weighted NMF extension for bounded missing values is a reasonable technical choice. The paper also illustrates a useful way to track soft cluster memberships over time. However, the contribution is primarily an application report, and the central claims currently rest on a single non-convex factorization without stability analysis, statistical validation, or sensitivity analysis. The paper does not ship code or data, so the validity of the conclusions depends entirely on the completeness of the methodological reporting, which is currently insufficient.
major comments (5)
- [Section 2.2 and Section 3.1] The factorization is performed with a single run of randomly initialized WNMF, and the number of clusters k is selected by an incompletely specified rule ('some threshold, which depends on the initial error'). Because NMF is non-convex and the authors themselves note the scaling/rotation ambiguity of U and V, a single run does not justify interpreting the five rows of V in Figure 3 as stable behavioral dependencies. Please report results over multiple random restarts (e.g., distributions of V entries, cophenetic correlation, or cluster agreement measures) and describe the exact k-selection procedure and threshold. Without such evidence, the 'three optimal and two sub-optimal behaviors' conclusion in Section 4 is not secured.
- [Section 2.2] The statement 'As a consequence clusters will be uncorrelated on a student level, since otherwise we would pick a lower k' is not a logical consequence of the stated k-selection rule. The rule compares reconstruction errors for successive k; it does not by itself constrain the correlations among columns of U. This claim should either be proved from the properties of the weighted multiplicative update or removed and replaced with a direct examination of the empirical correlation structure of U.
- [Section 2.2 and Table 1] The handling of missing values for f10 (average quiz score) depends on an unspecified bound c and on a heuristic in which weights are toggled when (UV)_ij crosses c. Since f10 is central to the performance-related conclusions, and since it is missing for students who took no quizzes in a period, the paper should report the fraction of missing entries, test sensitivity of the V matrix to c, and verify that the C2 high-f5/high-f10 association (Section 3.1) is not an artifact of the imputation heuristic or of the subpopulation of quiz-takers only.
- [Section 2.1 and Table 1] The manuscript does not state whether the columns of X are normalized or scaled before applying WNMF. The features have very different ranges (e.g., f1 has maximum 31.85 and variance 0.862, while f11 has maximum 2.83 and variance 0.006). Without column scaling, the Frobenius-error objective is dominated by large-magnitude features, which directly affects which loadings appear in V. Please specify the exact preprocessing, or justify the use of raw scales, and ideally include a sensitivity check under alternative scaling choices.
- [Section 3.1] The 'optimal' and 'sub-optimal' performance labels are read off from the fitted V matrix, and f10 is one of the features used to construct the factorization. Consequently, stating that a cluster 'has high performance' is in part a restatement of the fitted loadings rather than an independent empirical finding. To support claims such as 'home use yields no performance gain,' the paper needs statistical validation: for example, bootstrap confidence intervals or permutation tests on the differences between loadings, or an out-of-sample check of whether the non-f10 features and cluster memberships predict f10. Without such tests, the causal-sounding performance conclusions are not established.
minor comments (5)
- [Section 3.1] In the C5 description, the phrase 'the high importance of f4 indicates that this most often occur for students working with languages' is confusing because f4 is reading texts, not language subjects; if the intended reference is f6 (language subjects), please align the text with Figure 3.
- [Section 3.1] There is a typo in the C1 description: 'These students seem to spent a lot of time reading (f4)' should read 'spend.'
- [Section 2.1] The session threshold of 600 seconds is justified by a recommendation from Clio Online, but a brief sensitivity analysis for this threshold would strengthen the reproducibility of the preprocessing.
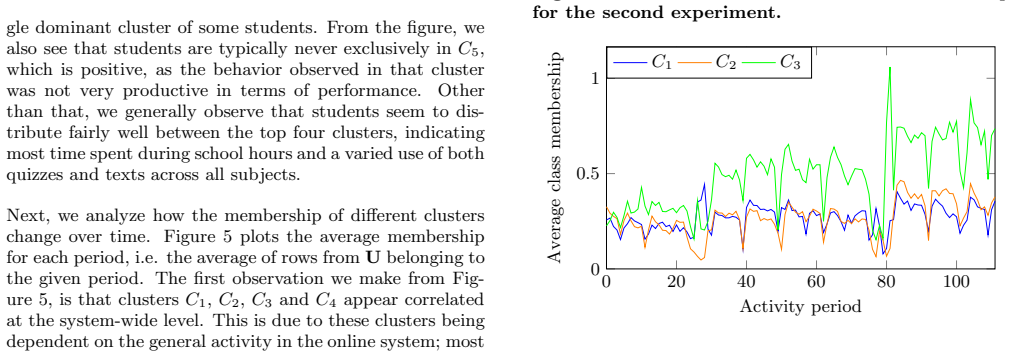
- [Figures 5 and 8] The temporal descriptions of correlation between clusters are qualitative; reporting the actual correlation coefficients of the average membership time series would make the claims in Section 3.1 and 3.2 more precise.
- [Section 3.2] The sentence 'the clustering has many high values which is most likely explained by having a teacher who uses the system exclusively in only one of the subjects' is speculative; if it is intended as a finding, it needs supporting evidence.
Circularity Check
Performance findings are readings of the fitted V matrix because f10 is an input feature; optimal/sub-optimal labels reduce to the factorization.
-
fitted input called prediction
[Section 3.1, Figure 3 and cluster observations; f10 defined in Section 2.1 Table 1.]
"Furthermore, students in this cluster seem to both have fairly long average session length and high performance (f9 and f10)."
The WNMF is fit to the feature matrix X that includes f10 (average quiz score). The cluster-feature matrix V is fitted so that X approximately equals UV; therefore a high f10 loading in cluster C2 is produced by the factorization itself. The paper then labels C2 as high-performance and concludes that 'students working mostly with language subjects gain most performance from spending time taking quizzes.' This uses f10 both to define the cluster and as the evidence of the performance gain, so the reported dependency is a restatement of the fitted V row rather than an independently validated finding.
-
fitted input called prediction
[Section 3.1, cluster C5; Section 4 conclusions.]
"Finally, C5 indicates that working mostly from home and primarily taking quizzes, does not improve performance."
C5 is the cluster with highest V loading for f2 (non-school hours); its low f10 loading is part of the same fitted V matrix that was optimized to reproduce X. The statement that this behavior 'does not improve performance' interprets the fitted f10 value, i.e. the outcome feature that was included as an input to the factorization. The sub-optimal label is not an external measurement; it is the value being factored, so the conclusion is circular with the construction of the clusters.
full rationale
The paper's pipeline is self-contained in that it applies standard weighted NMF to Clio Online log data and does not rest its central claim on a self-citation chain; the authors' own prior work [4], [12] is related but not load-bearing. However, the central performance claims in Section 3.1 reduce to the fitted factorization because f10 (average quiz score) is one of the columns of X. The V matrix is found by minimizing ||W⊙(X-UV)||_F, so a cluster's f10 loading is a fitted value, and calling C2 'optimal' or C5 'sub-optimal' is a direct interpretation of those loadings. The supplementary statements about quiz-taking improving language performance and home use yielding no gain are therefore not predictions validated on independent data; they are readings of the input covariance encoded in V. The paper does not report repeated-run stability, k sensitivity, or held-out performance validation. The unsupported k-selection claim in Section 2.2 is a correctness issue, not a circularity, and no uniqueness theorem or ansatz is imported from the authors' earlier work. The score reflects the construction-level reduction of the outcome claim, not any citation-based circularity.
Assumptions & free parameters
free parameters (5)
- Session threshold (600 seconds) =
600 seconds
- Missing-value bound c =
unspecified
- Number of clusters k =
5 (experiment 1), 3 (experiment 2)
- Error-decrease threshold for k selection =
not specified
- Bloom taxonomy regrouping =
4 levels
assumptions (5)
- domain assumption Student behavior in a week can be approximated by a non-negative linear combination of a small number of underlying behavior profiles.
- domain assumption Average quiz score (f10) is a valid measure of student performance.
- domain assumption The 600-second threshold correctly separates sessions.
- domain assumption Bloom taxonomy levels assigned to exercises are accurate.
- standard math The multiplicative update algorithm converges to a useful stationary point.
Cite this review
Pith. "Pith review of Tracking Behavioral Patterns among Students in an Online Educational System." pith.science (2026). https://pith.science/paper/DAPSL42Q
@misc{pith2026190808937,
  author       = {Pith},
  title        = {Pith review of: Tracking Behavioral Patterns among Students in an Online Educational System},
  year         = {2026},
  howpublished = {\url{https://pith.science/paper/DAPSL42Q}},
  note         = {Machine review of arXiv:1908.08937}
}
read the original abstract
Analysis of log data generated by online educational systems is an essential task to better the educational systems and increase our understanding of how students learn. In this study we investigate previously unseen data from Clio Online, the largest provider of digital learning content for primary schools in Denmark. We consider data for 14,810 students with 3 million sessions in the period 2015-2017. We analyze student activity in periods of one week. By using non-negative matrix factorization techniques, we obtain soft clusterings, revealing dependencies among time of day, subject, activity type, activity complexity (measured by Bloom's taxonomy), and performance. Furthermore, our method allows for tracking behavioral changes of individual students over time, as well as general behavioral changes in the educational system. Based on the results, we give suggestions for behavioral changes, in order to optimize the learning experience and improve performance.
Figures


Figures from the paper (3 more)


Reference graph
Works this paper leans on
-
[1]
INTRODUCTION + RELATED WORK How students behave in educational systems is an impor- tant topic in educational data mining. Knowledge of this behavior in an educational system can help us understand how students learn, and help guide the development for op- timal learning based on actual use. This behaviour can be understood both through an explicit study ...
work page 2015
-
[2]
EXPERIMENTAL SETUP This section describes our experimental setup and methods. We start by describing our data and how it is preprocessed, and then move on to describing our clustering method. 2.1 Data Preprocessing As mentioned, we consider log data generated in the Dan- ish online educational system Clio Online. The system is used in Danish primary schoo...
work page 2015
-
[3]
gives a good overview in the non-weighted setting. Sev- eral of these algorithms have been adapted for the WNMF case, while approaches based on expectation maximization have also been proposed, see [6]. For our analysis, we will us e the weighted version of the multiplicative update method, proposed by Lee and Seung [9]. The NMF algorithm given in [9], ad...
-
[4]
Repeatedly update U and V by the following rules: U← U⊙ (W⊙ X) VT (W⊙ (UV)) VT V← V⊙ UT (W⊙ X) UT (W⊙ (UV)) where division is done element-wise. The literature explores several ways of initializing U and V; in our case, we will simply use random initialization. The alternating optimization steps are applied until the decre ase in error reaches below a set...
-
[5]
EXPERIMENTS AND RESULTS In this section, we present two different experiments using the setup described above. In the first experiment, we inves- tigate the relation between activity, activity type, subje ct, time of day, average session length and performance. In the second experiment, we investigate the relation between complexities of exercises and subje...
-
[6]
We have identified three optimal and two sub-optimal behaviors in relation to subject and performance
CONCLUSIONS AND FUTURE WORK Several points can be taken from our analysis. We have identified three optimal and two sub-optimal behaviors in relation to subject and performance. One notably conclu- sion is that students using the Clio Online system during non-school hours (at home) do not seem to gain any signifi- cant boost to performance. We also saw how ...
-
[7]
ACKNOWLEDGMENTS The work is supported by the Innovation Fund Denmark through the Danish Center for Big Data Analytics Driven Innovation (DABAI) project. The authors would like to thank Clio Online, and the reviewers for their thorough and insightful feedback
-
[8]
Michael W. Berry, Murray Browne, Amy N. Langville, V. Paul Pauca, and Robert J. Plemmons. Algorithms and Applications for Approximate Nonnegative Matrix Factorization. Computational Statistics & Data Analysis, 52(1):155 – 173, 2007
work page 2007
Show all 20 references
-
[9]
Semi-Markov model for simulating MOOC students
Louis Faucon, Lukasz Kidzinski, and Pierre Dillenbourg. Semi-Markov model for simulating MOOC students. In Proceedings of the 9th International Conference on Educational Data Mining (EDM), pages 358–363. International Educational Data Mining Society (IEDMS), 2016
2016
-
[10]
Gelman, Matt Revelle, Carlotta Domeniconi, Kalyan Veeramachaneni, and Aditya Johri
Ben U. Gelman, Matt Revelle, Carlotta Domeniconi, Kalyan Veeramachaneni, and Aditya Johri. Acting the Same Differently: A Cross-Course Comparison of User Behavior in MOOCs. In Proceedings of the 9th International Conference on Educational Data Mining (EDM), pages 376–381. Inter...
2016
-
[11]
Sequence modelling for analysing student interaction with educational systems
Christian Hansen, Casper Hansen, Niklas Hjuler, Stephen Alstrup, and Christina Lioma. Sequence modelling for analysing student interaction with educational systems. In Proceedings of the 10th International Conference on Educational Data Mining (EDM), pages 232–237. Internation...
2017
-
[12]
Donnelly, and Sidney K
Stephen Hutt, Caitlin Mills, Shelby White, Patrick J. Donnelly, and Sidney K. D’Mello. The Eyes Have It: Gaze-based Detection of Mind Wandering during Learning with an Intelligent Tutoring System. In Proceedings of the 9th International Conference on Educational Data Mining (E...
2016
-
[13]
Weighted Nonnegative Matrix Factorization
Yong-Deok Kim and Seungjin Choi. Weighted Nonnegative Matrix Factorization. In Proceedings of IEEE International Conference on Acoustics, Speech and Signal Processing (ICASSP) , pages 1541–1544, 2009
2009
-
[14]
Temporally Coherent Clustering of Student Data
Severin Klingler, Tanja K ¨aser, Barbara Solenthaler, and Markus Gross. Temporally Coherent Clustering of Student Data. In Proceedings of the 9th International Conference on Educational Data Mining (EDM) , pages 102–109. International Educational Data Mining Society (IEDMS), 2016
2016
-
[15]
Non Negative Matrix Factorization Clustering Capabilities; Application on Multivariate Image Segmentation
Cosmin Lazar and Andrei Doncescu. Non Negative Matrix Factorization Clustering Capabilities; Application on Multivariate Image Segmentation. In Proceedings of the 3rd International Conference on Complex, Intelligent and Software Intensive Systems (CISIS), pages 924–929, 2009
2009
-
[16]
Lee and H
Daniel D. Lee and H. Sebastian Seung. Algorithms for Non-negative Matrix Factorization. In Advances in Neural Information Processing Systems 13, Papers from Neural Information Processing Systems (NIPS) 2000, Denver, CO, USA , pages 556–562, 2000
2000
-
[17]
Non-negative matrix factorization for clustering: A survey
Tao Li and Chris Ding. Non-negative matrix factorization for clustering: A survey. In Data Clustering: Algorithms and Applications , pages 149–176. Chapman & Hall/CRC, January 2013
2013
-
[18]
On the Convergence of Multiplicative Update Algorithms for Non-negative Matrix Factorization
Chih-Jen Lin. On the Convergence of Multiplicative Update Algorithms for Non-negative Matrix Factorization. Trans. Neur. Netw. , 18(6):1589–1596, 2007
2007
-
[19]
On Predicting Student Performance Using Low-rank Matrix Factorization Techniques
Stephan Lorenzen, Ninh Pham, and Stephen Alstrup. On Predicting Student Performance Using Low-rank Matrix Factorization Techniques. In Proceedings of the 16th European Conference on e-Learning (ECEL) , pages 326–334. Academic Conferences and Publishing International, 2017
2017
-
[20]
Berry, Victor P
Farial Shahnaz, Michael W. Berry, Victor P. Pauca, and Robert J. Plemmons. Document clustering using nonnegative matrix factorization. Information Processing & Management , 42(2):373 – 386, 2006
2006
Reviewed August 14, 2026 · model on record in the stance chip above.
Discussion (0). Continue with ORCID to comment.